Thesis - Department of Materials Science and Metallurgy - University ...
Thesis - Department of Materials Science and Metallurgy - University ...
Thesis - Department of Materials Science and Metallurgy - University ...

You also want an ePaper? Increase the reach of your titles
YUMPU automatically turns print PDFs into web optimized ePapers that Google loves.
Theory <strong>of</strong> the Pearlite Transformation in<br />
Steels<br />
By<br />
Ashwin Suresh P<strong>and</strong>it<br />
Robinson College, Cambridge<br />
<strong>University</strong> <strong>of</strong> Cambridge<br />
<strong>Department</strong> <strong>of</strong> <strong>Materials</strong> <strong>Science</strong> <strong>and</strong> <strong>Metallurgy</strong><br />
Pembroke Street, Cambridge CB2 3QZ<br />
A dissertation submitted for the<br />
degree <strong>of</strong> Doctor <strong>of</strong> Philosophy<br />
at the <strong>University</strong> <strong>of</strong> Cambridge<br />
June 2011
Preface<br />
This dissertation is submitted for the Doctor <strong>of</strong> Philosophy in Natural <strong>Science</strong>s<br />
at the <strong>University</strong> <strong>of</strong> Cambridge. The research reported herein was conducted under<br />
the supervision <strong>of</strong> Pr<strong>of</strong>essor H. K. D. H. Bhadeshia in the <strong>Department</strong> <strong>of</strong> <strong>Materials</strong><br />
<strong>Science</strong> <strong>and</strong> <strong>Metallurgy</strong>, <strong>University</strong> <strong>of</strong> Cambridge, between June 2008 <strong>and</strong> June 2011.<br />
This work is to the best <strong>of</strong> my knowledge original, except where acknowledgment<br />
<strong>and</strong> references are made to the previous work. Neither this, nor any substantially<br />
similar dissertation has been or is being submitted for any degree, diploma or other<br />
qualification at any other university or institution. This dissertation does not exceed<br />
the word limit <strong>of</strong> 60,000 words.<br />
Some <strong>of</strong> the work described herein has been published:<br />
1. A. S. P<strong>and</strong>it <strong>and</strong> H. K. D. H. Bhadeshia, “Mixed Diffusion-Controlled Growth<br />
<strong>of</strong> Pearlite in Binary Steel”, Proceedings <strong>of</strong> the Royal Society A 467, 508-521<br />
(2011).<br />
2. A. S. P<strong>and</strong>it <strong>and</strong> H. K. D. H. Bhadeshia, “Diffusion-controlled Growth <strong>of</strong><br />
Pearlite in Ternary Steels”, Proceedings <strong>of</strong> the Royal Society A, In press.<br />
Ashwin Suresh P<strong>and</strong>it<br />
June 2011<br />
i
Acknowledgements<br />
I would like to express my sincere gratitude to my supervisor Pr<strong>of</strong>essor Harshad<br />
Kumar Dharamshi Hansraj Bhadeshia for his invaluable guidance, inspiration <strong>and</strong><br />
encouragement during the work <strong>and</strong> my stay here. Without his motivation <strong>and</strong> quest<br />
for excellence, this work would have never been fruitful.<br />
I would like to thank Pr<strong>of</strong>essor A. L. Greer for the provision <strong>of</strong> Laboratory fa-<br />
cilities in the <strong>Department</strong> <strong>of</strong> <strong>Materials</strong> <strong>Science</strong> <strong>and</strong> <strong>Metallurgy</strong> at the <strong>University</strong> <strong>of</strong><br />
Cambridge.<br />
I earnestly acknowledge the financial support <strong>and</strong> study leave provided by Tata<br />
Steel Limited to pursue my research at the <strong>University</strong> <strong>of</strong> Cambridge. I would like to<br />
acknowledge the valuable support <strong>and</strong> guidance provided by Dr. Debashish Bhat-<br />
tacharjee, Director (Research, Development <strong>and</strong> Technology, Tata Steel Europe) as<br />
my industrial supervisor. I also express my gratitude to Robinson College Cambridge<br />
<strong>and</strong> Cambridge Philosophical Society for their valuable financial support during the<br />
course <strong>of</strong> completion <strong>of</strong> my research.<br />
I would like to thank every member <strong>of</strong> the <strong>Department</strong> <strong>and</strong> staff for being helpful<br />
<strong>and</strong> supportive to me especially Kevin, Frank, Simon <strong>and</strong> Dave. I would like to thank<br />
Mathew, Arijit <strong>and</strong> Steve for the fruitful technical discussions on related matters.<br />
All the help <strong>and</strong> support provided by Amir, Stephane, Radu, Jaiven, Pei Yan, Hala,<br />
Aseel, James, Lucy, Ivan, Hector <strong>and</strong> other past <strong>and</strong> present group members is<br />
greatly acknowledged. I shall cherish for long the memory <strong>of</strong> being with the PT-<br />
group <strong>and</strong> the c<strong>of</strong>fee time discussions. The association with friends in the college<br />
<strong>and</strong> the department has been very fruitful.<br />
I wish to express the deepest sense <strong>of</strong> gratitude to my parents for instilling good<br />
values in me <strong>and</strong> for being a constant source <strong>of</strong> inspiration. I am greatly indebted to<br />
my wife, Nishita <strong>and</strong> daughter, Devanshi for their wholehearted support, underst<strong>and</strong>-<br />
ing <strong>and</strong> for motivating me to pursue my goals. I really appreciate the perseverance<br />
ii
<strong>and</strong> self-sacrifice displayed by my wife through the course <strong>of</strong> this work <strong>and</strong> for st<strong>and</strong>-<br />
ing firm by my side through the difficult situations. I am grateful to all my family<br />
members <strong>and</strong> friends for their continuous moral support.<br />
iii
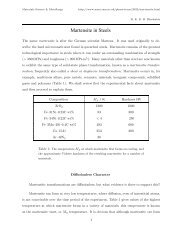
Abstract<br />
A new theory has been proposed for the growth <strong>of</strong> pearlite in a binary Fe-C alloy,<br />
which tackles simultaneously the diffusion flux in the austenite <strong>and</strong> through the<br />
transformation interface. This has been shown to better represent the experimental<br />
data reported on the growth <strong>of</strong> pearlite in spite <strong>of</strong> the fact that considerations <strong>of</strong><br />
equilibrium at junctions between interfaces are ab<strong>and</strong>oned for the sake <strong>of</strong> simplicity.<br />
The theory, for the first time, leads to a realistic value for the activation energy for<br />
the interfacial diffusion <strong>of</strong> carbon, less than that for volume diffusion in austenite <strong>and</strong><br />
greater than for volume diffusion in ferrite. The maximum growth rate <strong>and</strong> maximum<br />
rate <strong>of</strong> entropy production criteria for determining the critical interlamellar spacing<br />
have been derived in the context <strong>of</strong> mixed flux model with the result that certain<br />
parameters which are normally assumed to be constant, become a function <strong>of</strong> the<br />
transformation temperature.<br />
For the sake <strong>of</strong> completeness, a third diffusion flux through the ferrite has also<br />
been incorporated in the mixed diffusion–controlled growth theory. Although inclu-<br />
sion <strong>of</strong> flux through the ferrite leads to an increase in the growth rate as compared to<br />
that through the austenite alone, it is shown that the combination <strong>of</strong> fluxes through<br />
austenite <strong>and</strong> the interface represents the experimental data rather well. Further-<br />
more, the evidence for cementite thickening behind the transformation front, which<br />
is a natural consequence <strong>of</strong> the flux through the ferrite, is weak. Hence it is suggested<br />
that this consideration may be excluded from the proposed theory.<br />
The growth <strong>of</strong> pearlite in a more complex ternary system containing a mixture<br />
<strong>of</strong> interstitial <strong>and</strong> substitutional solutes has also been addressed. None <strong>of</strong> the ex-<br />
perimental data for Mn <strong>and</strong> Cr containing steels are consistent with transformation<br />
involving no-partitioning or even the negligible–partitioning <strong>of</strong> the solute between the<br />
phases involved. The available data suggest that the growth <strong>of</strong> pearlite in ternary<br />
or multicomponent steels is accompanied by the partitioning <strong>of</strong> the substitutional<br />
solute between the product phases using the assumption <strong>of</strong> local equilibrium. The<br />
iv
growth rate is deduced using Hillert’s approach based on the thermodynamic data<br />
available from the ternary phase boundaries <strong>and</strong> assuming that the interlamellar<br />
spacing adopted is consistent with maximum rate <strong>of</strong> entropy production. The im-<br />
portance <strong>of</strong> a reliable value <strong>of</strong> interfacial energy, (σ αθ ) <strong>of</strong> ferrite-cementite interfaces<br />
is emphasised, especially when the growth rates are to be calculated in the absence<br />
<strong>of</strong> interlamellar spacing data.<br />
In order to be able to implement the theory developed so far to an industrial<br />
scenario, a “divorced”eutectoid transformation exploited during the spheroidising<br />
annealing <strong>of</strong> steels has been discussed quantitatively. It has been shown through a<br />
rigorous analysis that there exists a wider window for the processing <strong>of</strong> these steels,<br />
which should lead to a more efficient heat treatment process.<br />
It is thought that the work presented in this thesis can be integrated into the si-<br />
multaneous transformation model which includes various other transformation prod-<br />
ucts typical in steels, that would lead to better algorithms for the calculation <strong>of</strong><br />
microstructure.<br />
v
Contents<br />
1 Introduction 1<br />
1.1 Scope <strong>of</strong> research . . . . . . . . . . . . . . . . . . . . . . . . . . . . . 3<br />
2 Literature Review 5<br />
2.1 General Phase Transformations in Steel . . . . . . . . . . . . . . . . . 5<br />
2.1.1 Rate controlling factors . . . . . . . . . . . . . . . . . . . . . . 6<br />
2.2 Theory <strong>of</strong> Pearlite Nucleation . . . . . . . . . . . . . . . . . . . . . . 7<br />
2.2.1 Classical nucleation theory . . . . . . . . . . . . . . . . . . . . 7<br />
2.2.2 Theory <strong>of</strong> transient nucleation . . . . . . . . . . . . . . . . . . 9<br />
2.3 Methods to Determine the Rate <strong>of</strong> Nucleation . . . . . . . . . . . . . 10<br />
2.3.1 Measurements based on stereology . . . . . . . . . . . . . . . 11<br />
2.3.2 Based on transformed volume fractions . . . . . . . . . . . . . 12<br />
2.4 Influence <strong>of</strong> Grain Boundary Sites on Nucleation . . . . . . . . . . . . 12<br />
2.5 Active Nucleus for Pearlite Formation . . . . . . . . . . . . . . . . . . 14<br />
2.6 Orientation Gradients in Pearlite . . . . . . . . . . . . . . . . . . . . 16<br />
2.7 Mechanism <strong>of</strong> Diffusion in Metals . . . . . . . . . . . . . . . . . . . . 19<br />
2.7.1 Volume diffusion coefficient <strong>of</strong> carbon in austenite . . . . . . . 20<br />
2.7.2 Grain boundary diffusivity . . . . . . . . . . . . . . . . . . . . 21<br />
2.7.3 Diffusion along phase boundaries . . . . . . . . . . . . . . . . 22<br />
2.8 Mechanisms <strong>of</strong> Pearlite Growth . . . . . . . . . . . . . . . . . . . . . 23<br />
2.8.1 Volume diffusion . . . . . . . . . . . . . . . . . . . . . . . . . 23<br />
2.8.2 Interface diffusion . . . . . . . . . . . . . . . . . . . . . . . . . 26<br />
i
CONTENTS<br />
2.8.3 Other proposed mechanisms for pearlite . . . . . . . . . . . . 29<br />
2.9 Pearlite in Multicomponent Steels . . . . . . . . . . . . . . . . . . . . 32<br />
2.9.1 Thermodynamics <strong>of</strong> ternary systems . . . . . . . . . . . . . . 32<br />
2.9.2 Partitioning during the growth <strong>of</strong> pearlite . . . . . . . . . . . 33<br />
2.10 Divergent Pearlite . . . . . . . . . . . . . . . . . . . . . . . . . . . . . 39<br />
3 Pearlite Growth in Fe-C alloys 42<br />
3.1 Introduction . . . . . . . . . . . . . . . . . . . . . . . . . . . . . . . . 42<br />
3.2 Interlamellar Spacing Criteria . . . . . . . . . . . . . . . . . . . . . . 42<br />
3.2.1 Maximum growth rate . . . . . . . . . . . . . . . . . . . . . . 43<br />
3.2.2 Maximum rate <strong>of</strong> entropy production . . . . . . . . . . . . . . 43<br />
3.2.3 Interface instability . . . . . . . . . . . . . . . . . . . . . . . . 44<br />
3.3 Pearlite Growth Based on Conventional Theories . . . . . . . . . . . 47<br />
3.3.1 Collector plate model . . . . . . . . . . . . . . . . . . . . . . . 50<br />
3.3.2 Combined volume <strong>and</strong> phase boundary diffusion . . . . . . . . 51<br />
3.4 Model Formulation: Mixed Diffusion-Controlled Growth . . . . . . . 52<br />
3.4.1 Assumptions . . . . . . . . . . . . . . . . . . . . . . . . . . . . 52<br />
3.4.2 Weighted average diffusion coefficient . . . . . . . . . . . . . . 53<br />
3.4.3 Combined fluxes during pearlite growth . . . . . . . . . . . . . 54<br />
3.4.4 Evaluation <strong>of</strong> spacing criteria . . . . . . . . . . . . . . . . . . 58<br />
3.4.5 Interfacial energy . . . . . . . . . . . . . . . . . . . . . . . . . 59<br />
3.5 Conclusions . . . . . . . . . . . . . . . . . . . . . . . . . . . . . . . . 70<br />
4 Influence <strong>of</strong> Diffusion in Ferrite on Pearlite Growth 71<br />
4.1 Introduction . . . . . . . . . . . . . . . . . . . . . . . . . . . . . . . . 71<br />
4.2 Diffusion in Ferrite . . . . . . . . . . . . . . . . . . . . . . . . . . . . 72<br />
4.3 Model Formulation . . . . . . . . . . . . . . . . . . . . . . . . . . . . 73<br />
4.4 Conclusions . . . . . . . . . . . . . . . . . . . . . . . . . . . . . . . . 79<br />
5 Pearlite Growth in Ternary alloys 82<br />
5.1 Introduction . . . . . . . . . . . . . . . . . . . . . . . . . . . . . . . . 82<br />
5.2 Partitioning <strong>of</strong> Substitutional Solutes . . . . . . . . . . . . . . . . . . 83<br />
ii
CONTENTS<br />
5.3 Local Equilibrium in Ternary Systems . . . . . . . . . . . . . . . . . 86<br />
5.3.1 Partitioning local–equilibrium in Fe-C-Mn . . . . . . . . . . . 89<br />
5.4 Grain Boundary Diffusion . . . . . . . . . . . . . . . . . . . . . . . . 89<br />
5.5 Pearlite Growth Rate in Fe-C-Mn Steels . . . . . . . . . . . . . . . . 93<br />
5.5.1 Assumptions . . . . . . . . . . . . . . . . . . . . . . . . . . . . 93<br />
5.5.2 Activation energy for boundary diffusion . . . . . . . . . . . . 94<br />
5.5.3 Interfacial energy . . . . . . . . . . . . . . . . . . . . . . . . . 95<br />
5.5.4 Calculation <strong>of</strong> growth rate . . . . . . . . . . . . . . . . . . . . 100<br />
5.6 Pearlite Growth Rate in Fe-C-Cr System . . . . . . . . . . . . . . . . 102<br />
5.7 Conclusions . . . . . . . . . . . . . . . . . . . . . . . . . . . . . . . . 107<br />
6 Divorced Eutectoid Transformation in Steels 109<br />
6.1 Introduction . . . . . . . . . . . . . . . . . . . . . . . . . . . . . . . . 109<br />
6.2 Background . . . . . . . . . . . . . . . . . . . . . . . . . . . . . . . . 110<br />
6.3 Divorced Eutectoid Transformation in Fe-C System . . . . . . . . . . 114<br />
6.4 Divorced Eutectoid Transformation in Bearing Steels . . . . . . . . . 117<br />
6.5 Determination <strong>of</strong> Carbide Particle Spacing . . . . . . . . . . . . . . . 121<br />
6.6 Experimental Evaluation . . . . . . . . . . . . . . . . . . . . . . . . . 123<br />
6.7 Conclusions . . . . . . . . . . . . . . . . . . . . . . . . . . . . . . . . 125<br />
7 Conclusions <strong>and</strong> Scope for Future Work 130<br />
Appendix A: Dissolution <strong>of</strong> Pearlite 134<br />
Appendix B: Divergent Pearlite 137<br />
Appendix C: Program for Pearlite Growth in Binary Steels 140<br />
1.1 Provenance <strong>of</strong> Source Code . . . . . . . . . . . . . . . . . . . . . . . . 140<br />
1.2 Purpose . . . . . . . . . . . . . . . . . . . . . . . . . . . . . . . . . . 140<br />
1.3 Specification . . . . . . . . . . . . . . . . . . . . . . . . . . . . . . . . 140<br />
1.4 Description . . . . . . . . . . . . . . . . . . . . . . . . . . . . . . . . 140<br />
1.5 References . . . . . . . . . . . . . . . . . . . . . . . . . . . . . . . . . 141<br />
iii
CONTENTS<br />
1.6 Parameters . . . . . . . . . . . . . . . . . . . . . . . . . . . . . . . . 141<br />
1.6.1 Input files . . . . . . . . . . . . . . . . . . . . . . . . . . . . . 142<br />
1.6.2 Output parameters . . . . . . . . . . . . . . . . . . . . . . . . 142<br />
1.6.3 Output files . . . . . . . . . . . . . . . . . . . . . . . . . . . . 142<br />
1.7 Program Listing . . . . . . . . . . . . . . . . . . . . . . . . . . . . . . 143<br />
Appendix D: Program for Pearlite Growth in Ternary Steels 155<br />
1.1 Provenance <strong>of</strong> Source Code . . . . . . . . . . . . . . . . . . . . . . . . 155<br />
1.2 Purpose . . . . . . . . . . . . . . . . . . . . . . . . . . . . . . . . . . 155<br />
1.3 Specification . . . . . . . . . . . . . . . . . . . . . . . . . . . . . . . . 155<br />
1.4 Description . . . . . . . . . . . . . . . . . . . . . . . . . . . . . . . . 155<br />
1.5 References . . . . . . . . . . . . . . . . . . . . . . . . . . . . . . . . . 156<br />
1.6 Parameters . . . . . . . . . . . . . . . . . . . . . . . . . . . . . . . . 157<br />
1.6.1 Input parameters . . . . . . . . . . . . . . . . . . . . . . . . . 157<br />
1.6.2 Output parameters . . . . . . . . . . . . . . . . . . . . . . . . 157<br />
1.7 Program Listing . . . . . . . . . . . . . . . . . . . . . . . . . . . . . . 157<br />
iv
Nomenclature<br />
α Ferrite<br />
¯c Average concentration in austenite<br />
∆G Free energy change<br />
∆Gchem<br />
Chemical free energy change<br />
∆H Enthalpy change during austenite-pearlite transformation<br />
∆Hform<br />
∆Hm<br />
∆Sform<br />
∆Sm<br />
∆T Undercooling<br />
Enthalpy change for vacancy formation<br />
Enthalpy change for vacancy migration<br />
Entropy change for vacancy formation<br />
Entropy change for vacancy migration<br />
δ Thickness <strong>of</strong> the interface<br />
˙S Entropy production rate<br />
γ Austenite<br />
λ Particle spacing<br />
v
ν Jump frequency<br />
ωγ<br />
Nearest neighbour carbon-carbon interaction energy<br />
CONTENTS<br />
D Weighted average diffusion coefficient <strong>of</strong> carbon in austenite<br />
Ψ Factor representing difference in energy required for creation <strong>of</strong> an<br />
interface <strong>and</strong> the energy released due to removal <strong>of</strong> the grain boundary<br />
area<br />
σ αγ Interfacial free energy per unit area for ferrite-austenite interface<br />
σ αθ Interfacial energy per unit area <strong>of</strong> ferrite-cementite interfaces<br />
τ Incubation time for nucleation<br />
θ Cementite<br />
a γ Activity <strong>of</strong> carbon in austenite<br />
c αθ Concentration in ferrite which is in equilibrium with cementite<br />
c αγ<br />
e<br />
c γα<br />
e<br />
c γθ<br />
e<br />
c θγ<br />
e<br />
Concentration in ferrite which is in equilibrium with austenite<br />
Concentration in austenite which is in equilibrium with ferrite<br />
Concentration in austenite which is in equilibrium with cementite<br />
Concentration in cementite which is in equilibrium with austenite<br />
d Austenite grain size<br />
Dα<br />
DB<br />
D γ<br />
C<br />
Deff<br />
Diffusion coefficient <strong>of</strong> carbon in ferrite<br />
Boundary diffusion coefficient<br />
Volume diffusion coefficient <strong>of</strong> carbon in austenite<br />
Effective diffusion coefficient<br />
vi
f(t) Fraction transformed at time t<br />
G ∗ Critical free energy for formation <strong>of</strong> nucleus<br />
Gstrain<br />
G α V<br />
G γ<br />
V<br />
Strain energy per unit volume<br />
Free energy per unit volume <strong>of</strong> ferrite<br />
Free energy per unit volume <strong>of</strong> austenite<br />
h Planck’s constant<br />
J Diffusion flux<br />
JV<br />
Nucleation rate per unit volume<br />
k Boltzmann’s constant<br />
Nb<br />
Nc<br />
Ne<br />
NV<br />
Nj<br />
p i j<br />
Number <strong>of</strong> nucleation sites at the grain boundaries<br />
Number <strong>of</strong> nucleation sites at the grain corners<br />
Number <strong>of</strong> nucleation sites at the grain edges<br />
Number <strong>of</strong> nucleation sites per unit volume<br />
Number <strong>of</strong> particles per unit volume <strong>of</strong> true diameter j<br />
CONTENTS<br />
probability <strong>of</strong> finding a particle <strong>of</strong> apparent diameter range i on the<br />
plane <strong>of</strong> polish from a particle <strong>of</strong> true diameter range j<br />
Q Activation energy<br />
R Universal gas constant<br />
r Radius <strong>of</strong> spherical nucleus at any instance<br />
r ∗ Critical radius <strong>of</strong> the nucleus<br />
S Interlamellar spacing<br />
vii
s Boundary segregation coefficient<br />
S α Thickness <strong>of</strong> ferrite lamellae<br />
S θ Thickness <strong>of</strong> cementite lamellae<br />
Sc<br />
Critical interlamellar spacing<br />
T Absolute temperature<br />
v Growth rate<br />
Vm<br />
Molar volume <strong>of</strong> austenite<br />
W Work done for the formation <strong>of</strong> critical nucleus<br />
xC<br />
YC<br />
Mole fraction <strong>of</strong> carbon in steel<br />
Site fraction <strong>of</strong> carbon in interstitial sub-lattice<br />
Z Zeldovich non-equilibrium factor<br />
z Coordination number<br />
viii<br />
CONTENTS
Chapter 1<br />
Introduction<br />
Pearlite is a common constituent <strong>of</strong> steels <strong>and</strong> materially adds to its strength. Typical<br />
applications <strong>of</strong> pearlitic steels include rails, ropes for bridges <strong>and</strong> elevators, tyre cords<br />
etc. to list a few. It has been identified since more than a century <strong>and</strong> derives its<br />
name after Sorby, who first reported that the structure resembles the irridescence<br />
<strong>of</strong> a pearl [1]. The differential etching <strong>of</strong> ferrite with respect to cementite results<br />
in the latter acting as diffraction grating for the light <strong>of</strong> various wavelengths from<br />
the pearlite colony, thus giving it a “pearly”appearance. A colony <strong>of</strong> pearlite when<br />
viewed in three dimensions consists <strong>of</strong> an interpenetrating bicrystal <strong>of</strong> ferrite <strong>and</strong><br />
cementite [2–4]. In planar sections the phases appear as lamellae which grow at a<br />
common front with the austenite.<br />
It is well established that with the exception <strong>of</strong> cobalt, all other alloying ele-<br />
ments retard the transformation <strong>of</strong> austenite to pearlite as these elements decrease<br />
the nucleation <strong>and</strong> the growth rate <strong>of</strong> pearlite by shifting the time-temperature-<br />
transformation curve to longer times. This has a great technological importance in<br />
the context <strong>of</strong> the ability to produce low temperature microstructures such as bainite<br />
<strong>and</strong> martensite.<br />
It is well known that formation <strong>of</strong> pearlite is a reconstructive process <strong>and</strong> the<br />
growth is characterised by two distinct processes: (a) redistribution <strong>of</strong> carbon into<br />
1
cementite <strong>and</strong> (b) change in crystallographic structure since the product phases have<br />
a structure different from the parent austenite <strong>and</strong> that the rate <strong>of</strong> growth is governed<br />
by the diffusion <strong>of</strong> carbon atoms especially in Fe-C steels [5]. The active nucleus for<br />
pearlite formation can be either ferrite or cementite depending on the temperature<br />
<strong>and</strong> composition. The nucleation sites can be grain boundaries or inclusions <strong>and</strong><br />
once either the ferrite or cementite is nucleated, the conditions surrounding the new<br />
nucleus are ripe for nucleation <strong>of</strong> the other <strong>and</strong> pearlite grows in a co-operative<br />
manner. When the austenite is supercooled below the A1 (eutectoid temperature),<br />
<strong>and</strong> isothermally transformed, the pearlite grows at a constant rate with a constant<br />
interlamellar spacing between the ferrite <strong>and</strong> cementite. The interlamellar spacing<br />
decreases at higher undercoolings <strong>and</strong> the pearlite formed under such conditions<br />
cannot be resolved using the optical microscope. When the interlamellar spacing<br />
is large, the diffusion distances for the transport <strong>of</strong> solute are larger <strong>and</strong> hence the<br />
growth <strong>of</strong> pearlite is slowed down. The growth rate increases at higher undercoolings<br />
since the free energy change accompanying the transformation increases. However<br />
since the reaction is diffusion-controlled, the diffusion distances must be reduced to<br />
compensate for the decrease in diffusivity. Consequently the interlamellar spacing is<br />
reduced as the transformation temperature decreases.<br />
Under certain set <strong>of</strong> conditions, pearlite may exist as spheroidised cementite in<br />
the matrix <strong>of</strong> ferrite, also termed as “divorced eutectoid”. The microstructure has<br />
been named so in recognition <strong>of</strong> the fact that there is no co-operation between the<br />
ferrite <strong>and</strong> cementite as in the case <strong>of</strong> lamellar pearlite. Such structures are pro-<br />
duced by spheroidising annealing treatment where the primary objective is to re-<br />
duce the hardness in order to achieve good machinability as in the case <strong>of</strong> bearings<br />
steels. The formation <strong>of</strong> divorced eutectoid relies on the presence <strong>of</strong> finely spaced<br />
pre-existing cementite particles in the austenite matrix. The key to achieve a com-<br />
pletely spheroidised structure lies in the heat treatment process which should avoid<br />
the formation <strong>of</strong> lamellar structure when the steel is being cooled from the austenis-<br />
ing temperature. This summary <strong>of</strong> a few aspects <strong>of</strong> the pearlite reaction conceals<br />
numerous difficulties in the quantitative expression <strong>of</strong> its growth kinetics. The de-<br />
2
1.1 Scope <strong>of</strong> research<br />
tails are described in a subsequent chapter but it is important to realise that the<br />
theoretical design <strong>of</strong> steels become difficult without a proper treatment <strong>of</strong> pearlite<br />
as an intervening phase mixture.<br />
1.1 Scope <strong>of</strong> research<br />
It has long been possible to estimate the growth rate <strong>of</strong> pearlite assuming volume<br />
diffusion–control [6, 7] <strong>and</strong> the work has been reviewed thoroughly in [8–11]. There<br />
have, on the other h<strong>and</strong>, been reports [12–14] that the rates calculated in this way sig-<br />
nificantly underestimate those measured, possibly because <strong>of</strong> mass transport within<br />
the transformation interface [15, 16]. Most <strong>of</strong> the comparisons with experimental<br />
data have been based either on the volume or interface diffusion–controlled approach<br />
in isolation, but none <strong>of</strong> them have proved to be convincing. The former assumes<br />
that the redistribution <strong>of</strong> carbon at the transformation front occurs as a result <strong>of</strong><br />
diffusion through the volume <strong>of</strong> austenite while the latter relies on the migration <strong>of</strong><br />
solute through the advancing pearlite-austenite growth front. There is in principle<br />
no reason why fluxes through both <strong>of</strong> these routes should not operate simultaneously.<br />
In the absence <strong>of</strong> a clear underst<strong>and</strong>ing <strong>of</strong> controlling mechanisms, the outcomes <strong>of</strong><br />
calculations are ambiguous or rely on uncertain assumptions.<br />
Most <strong>of</strong> the commercially produced steels contain either one or more alloying addi-<br />
tions, principally in order to improve the hardenability. The ternary steels, Fe-C-X,<br />
containing a substitutional solute (X) have been studied in considerable detail during<br />
the growth <strong>of</strong> pre-eutectoid ferrite from austenite. With pearlite there is an addi-<br />
tional complication because <strong>of</strong> the partitioning <strong>of</strong> the substitutional solute between<br />
the product phases. It has been reported that the growth <strong>of</strong> pearlite in such steels<br />
is accompanied by either long-range partitioning <strong>of</strong> X, termed as partitioning local<br />
equilibrium or by a limited partitioning resulting in a concentration spike ahead <strong>of</strong><br />
the transformation front, or negligible partitioning local equilibrium. Earlier studies<br />
indicated a so-called no-partitioning temperature below which the substitutional so-<br />
lute does not partition <strong>and</strong> the growth <strong>of</strong> pearlite is limited by the diffusion <strong>of</strong> carbon<br />
3
1.1 Scope <strong>of</strong> research<br />
[17–19]. Above this characteristic temperature the diffusion <strong>of</strong> the substitutional so-<br />
lute through the boundary controls the growth rate <strong>of</strong> pearlite. However neither <strong>of</strong><br />
these two scenarios could correctly predict the growth rate at low temperatures.<br />
In view <strong>of</strong> the uncertainties surrounding the exact mechanism for the growth <strong>of</strong><br />
pearlite in binary <strong>and</strong> ternary steels, the current research aims at providing a sim-<br />
plified theory without making any prior assumptions regarding the conditions under<br />
which one or the other diffusion flux is dominant.<br />
4
Chapter 2<br />
Literature Review<br />
2.1 General Phase Transformations in Steel<br />
Solid-state phase transformations in steel can be classified as reconstructive or dis-<br />
placive. A reconstructive transformation leads to an uncoordinated movement <strong>of</strong><br />
atoms in which there is no atomic correspondence between the parent <strong>and</strong> product<br />
phase. There is a diffusion flux <strong>of</strong> atoms that leads to a new crystal structure. The<br />
flow <strong>of</strong> matter is sufficient to minimise the strain energy so that only the volume<br />
change contributes to the alteration <strong>of</strong> shape. Such a process requires long-range<br />
diffusion, which may be sluggish at low temperatures. Allotriomorphic ferrite, id-<br />
iomorphic ferrite <strong>and</strong> pearlite are examples <strong>of</strong> reconstructive transformations.<br />
Displacive transformation is characterised by a well-coordinated movement <strong>of</strong><br />
atoms in which the atomic correspondence between the parent <strong>and</strong> product phases is<br />
preserved. This leads to a macroscopic change in shape <strong>of</strong> the sample when the latter<br />
is not constrained. In a polycrystalline material involving several grains adjacent to<br />
each other this product phase grows in the form <strong>of</strong> thin plates which is a morphology<br />
which reduces the strain energy associated with these transformations. Displacive<br />
transformations can occur at temperatures where diffusion becomes impossible over<br />
the time scales involved. Widmanstätten ferrite, bainite <strong>and</strong> martensite, all belong<br />
5
to the class <strong>of</strong> displacive transformations.<br />
2.1.1 Rate controlling factors<br />
2.1 General Phase Transformations in Steel<br />
The rate at which the transformation interface moves depends on its intrinsic mobility<br />
(related to the transfer <strong>of</strong> atoms across the interface) <strong>and</strong> the ease <strong>of</strong> partitioning<br />
<strong>of</strong> solutes by diffusion ahead <strong>of</strong> the transformation front. These two processes are<br />
in series <strong>and</strong> the interface velocity as calculated from the mobility always equals<br />
that based on the diffusion <strong>of</strong> solute ahead <strong>of</strong> the interface. Both <strong>of</strong> these processes<br />
dissipate the free energy available for moving the interface. When most <strong>of</strong> this<br />
free energy is dissipated in the diffusion process, the interface motion is said to<br />
be controlled by diffusion. On the other h<strong>and</strong>, when the majority is consumed<br />
in transferring the atoms across the interface, the reaction is said to be interface<br />
controlled. The concentration pr<strong>of</strong>iles for both these modes are shown schematically<br />
in Fig. 2.1. The terms α <strong>and</strong> β represent the phases involved, where the former is<br />
growing from the latter. The average concentration <strong>of</strong> the solute far away from the<br />
interface is represented as ¯c <strong>and</strong> the term c αβ refers to the concentration <strong>of</strong> solute in<br />
α which is in equilibrium with β <strong>and</strong> c βα is similarly interpreted.<br />
Figure 2.1: Schematic concentration pr<strong>of</strong>iles associated with modes <strong>of</strong> growth.<br />
6
2.2 Theory <strong>of</strong> Pearlite Nucleation<br />
2.2.1 Classical nucleation theory<br />
2.2 Theory <strong>of</strong> Pearlite Nucleation<br />
One <strong>of</strong> the early contributions to classical nucleation theory was made by Volmer, <strong>and</strong><br />
Becker <strong>and</strong> Döring, which led to intense activity on the subject. The theory states<br />
that atoms are in a state <strong>of</strong> r<strong>and</strong>om thermal fluctuations <strong>and</strong> only those clusters<br />
which lead to a reduction in free energy may survive <strong>and</strong> grow further. When small<br />
particles <strong>of</strong> a new phase form, there is initially an increase in the free energy because<br />
a significant proportion <strong>of</strong> atoms are situated in the transition region between the<br />
phases, where they do not have the characteristic pattern <strong>of</strong> the new phase. These<br />
small particles are thus enclosed by an interface which raises the free energy <strong>of</strong> the<br />
system. The contribution from the interfaces decreases eventually as the surface<br />
area to volume ratio <strong>of</strong> the particle decreases. In a metastable system this leads to<br />
a critical size <strong>of</strong> fluctuation beyond which the particle can grow with a reduction<br />
in free energy. Considering homogenous nucleation <strong>of</strong> a small spherical particle <strong>of</strong><br />
radius r <strong>of</strong> a new phase α from the parent phase γ, the change in free energy is given<br />
by:<br />
∆G = 4<br />
3 πr3 ∆Gchem + 4<br />
3 πr3 Gstrain +4πr 2 σ αγ<br />
(2.1)<br />
where ∆Gchem = G α V −Gγ<br />
V , is the chemical free energy change <strong>and</strong> Gstrain is the strain<br />
energy per unit volume associated with creation <strong>of</strong> α. G α V<br />
<strong>and</strong> Gγ<br />
V<br />
represent the free<br />
energy per unit volume <strong>of</strong> ferrite <strong>and</strong> austenite respectively. σ αγ is the interfacial free<br />
energy per unit area hindering the creation <strong>of</strong> the new phase. If the interfacial energy<br />
is zero then there is no barrier for nucleation <strong>and</strong> transformation starts as soon as<br />
the equilibrium temperature is exceeded. The free energy change, as a function <strong>of</strong><br />
size <strong>of</strong> the spherical particle is shown in Fig. 2.2. Equation 2.1 can be differentiated<br />
with respect to radius, r <strong>and</strong> equating it to zero gives the maximum.<br />
δ(∆G)<br />
δr =4πr2 [∆Gchem + Gstrain]+8πrσ αγ<br />
7<br />
(2.2)
2.3 Methods to Determine the Rate <strong>of</strong> Nucleation<br />
where Z is the Zeldovich non-equilibrium factor which gives steady-state concentra-<br />
tion <strong>of</strong> critical nuclei as opposed to the equilibrium concentration, τ is the incubation<br />
time <strong>and</strong> t is the time for nucleation. The time independent part <strong>of</strong> the above equa-<br />
tion gives the steady state nucleation rate.<br />
Offerman et al. studied a Fe-0.71C-0.61Mn-0.26Cr-0.34Si wt% steel to measure<br />
the nucleation <strong>and</strong> growth rate <strong>of</strong> pearlite using in-situ three-dimensional neutron<br />
dipolarisation technique [21]. They studied the steel at three different temperatures<br />
namely 953 K, 948 K <strong>and</strong> 943 K by holding each <strong>of</strong> them for different lengths <strong>of</strong><br />
time. The nucleation rate was estimated based on the number <strong>of</strong> pearlite nuclei<br />
formed as a function <strong>of</strong> transformation time. It was observed that the number <strong>of</strong><br />
pearlite colonies increased quadratically with time. The value <strong>of</strong> Ψθ was calculated<br />
as 2.2 × 10 −3 J 3 m −6 for cementite nucleation during pearlite formation. From syn-<br />
chrotron measurements they determined Ψα as 5 × 10 −8 J 3 m −6 for the nucleation <strong>of</strong><br />
ferrite from austenite in a medium carbon steel [25]. The effect <strong>of</strong> interfacial energy<br />
on the activation energy <strong>of</strong> pearlite nucleation is about 5 orders <strong>of</strong> magnitude higher<br />
for cementite than for ferrite nucleation. It was suggested that the main difference<br />
between nucleation <strong>of</strong> pro-eutectoid ferrite <strong>and</strong> pearlitic cementite is that the former<br />
takes place on the high energy γ − γ grain boundaries, whereas the latter takes place<br />
on the low energy γ − α interfaces. The lower value <strong>of</strong> Ψα suggested that the nu-<br />
cleation <strong>of</strong> proeutectoid ferrite was relatively easy as compared to that <strong>of</strong> pearlitic<br />
cementite.<br />
2.3 Methods to Determine the Rate <strong>of</strong> Nucleation<br />
The rate <strong>of</strong> nucleation is generally defined as the number <strong>of</strong> nuclei forming per unit<br />
time per unit volume <strong>of</strong> the untransformed matrix, designated as JV <strong>and</strong> expressed<br />
as no. mm −3 s −1 . Mehl <strong>and</strong> co-workers have shown that the nucleation rate <strong>of</strong><br />
pearlite increases with time <strong>and</strong> decreases with temperature before passing through a<br />
maximum <strong>and</strong> is slowed down by alloying additions which increases the hardenability<br />
10
2.3 Methods to Determine the Rate <strong>of</strong> Nucleation<br />
<strong>of</strong> the steel [26]. In the case <strong>of</strong> pearlite, where nucleation occurs on grain boundaries,<br />
NV will be a function <strong>of</strong> the austenite grain size.<br />
2.3.1 Measurements based on stereology<br />
Stereological methods involve the estimation <strong>of</strong> the number <strong>of</strong> pearlite nodules per<br />
unit volume by measuring the particle size distribution [22]. The particle density,<br />
when divided by the unreacted grain boundary area per unit volume, gives the num-<br />
ber <strong>of</strong> particles per unit unreacted grain boundary area. Such a procedure is re-<br />
peatedly carried out for increasing times on specimens at a given temperature. The<br />
nucleation rate is thus obtained by taking the slope <strong>of</strong> plot <strong>of</strong> number <strong>of</strong> particles per<br />
unit unreacted grain boundary area as a function <strong>of</strong> reaction time. A further simpli-<br />
fication <strong>of</strong> this analysis is done by assuming that particles are spherical, r<strong>and</strong>omly<br />
distributed <strong>and</strong> are <strong>of</strong> the same size, which yields [22]:<br />
NV = NA/2rmax<br />
(2.8)<br />
where NV is the number <strong>of</strong> particles per unit volume, NA is the number <strong>of</strong> particles<br />
<strong>of</strong> unit area on the plane <strong>of</strong> polish <strong>and</strong> rmax is the radius <strong>of</strong> the largest particle on<br />
the plane <strong>of</strong> polish. Another approach separates the particles into discrete diameter<br />
ranges measured on the polishing plane followed by a calculation <strong>of</strong> the distribution<br />
<strong>of</strong> true particle diameters. The equation can be described as:<br />
Nj = Σ l i=1p i jn i<br />
(2.9)<br />
where l is the number <strong>of</strong> size ranges, Nj is the number <strong>of</strong> particles per unit volume <strong>of</strong><br />
true diameter j, p i j is the probability <strong>of</strong> finding a particle <strong>of</strong> apparent diameter range<br />
i on the plane <strong>of</strong> polish from a particle <strong>of</strong> true diameter range j, n i is the number<br />
<strong>of</strong> measured (apparent) diameters in the i th category. Summing up the number <strong>of</strong><br />
particles in all diameter ranges gives the particle number density NV:<br />
NV = ΣNj<br />
11<br />
(2.10)
2.4 Influence <strong>of</strong> Grain Boundary Sites on Nucleation<br />
The methods described above prove to be inaccurate when small particles cannot be<br />
resolved.<br />
2.3.2 Based on transformed volume fractions<br />
The simplest method for the calculation <strong>of</strong> nucleation rates using experimental data<br />
is based on the Johnson-Mehl approach. For specific assumptions outlined below it<br />
is expressed as:<br />
f(t) =1− exp(−πJV v 3 t 4 /3) (2.11)<br />
where f(t) is the fraction transformed at time t, JV is the nucleation rate per unit<br />
volume <strong>of</strong> the untransformed matrix <strong>and</strong> v is the growth rate. This method assumes<br />
that both the nucleation <strong>and</strong> growth rates are independent <strong>of</strong> time, the nuclei are<br />
r<strong>and</strong>omly distributed spheres <strong>and</strong> the rate <strong>of</strong> transformation is proportional to the<br />
fraction <strong>of</strong> untransformed matrix. The average nucleation rate can be calculated by<br />
measuring f(t) <strong>and</strong> v.<br />
However, Cahn <strong>and</strong> Hagel have pointed out that for the pearlite reaction, nucle-<br />
ation <strong>and</strong> growth rates are usually not constant, the pearlite nodules are not normally<br />
spherical, nucleation sites are not r<strong>and</strong>om (preferably at grain boundaries) <strong>and</strong> all<br />
the sites are usually consumed at relatively low values <strong>of</strong> fraction transformed [27].<br />
According to them, pearlite nucleation increases with time <strong>and</strong> in most steels it is<br />
fast enough to give site saturation at fairly high temperatures. While in the initial<br />
stages, pearlite reaction is sensitive to nucleation rate, JV, drastic changes in JV in<br />
the middle <strong>and</strong> later stages have little effect on the overall rate <strong>of</strong> transformation.<br />
2.4 Influence <strong>of</strong> Grain Boundary Sites on Nucle-<br />
ation<br />
Clemm <strong>and</strong> Fisher have derived the critical free energy for the formation <strong>of</strong> a nucleus<br />
at the two, three or four grain junctions, based on the knowledge <strong>of</strong> volume, surface<br />
12
2.4 Influence <strong>of</strong> Grain Boundary Sites on Nucleation<br />
area <strong>and</strong> the matrix grain boundary area where the nucleus initiates [23]. Using the<br />
theory described earlier, the critical energy required for the formation <strong>of</strong> a nucleus<br />
<strong>of</strong> a new phase B in a homogeneous matrix <strong>of</strong> phase A can be rewritten as:<br />
G ∗ = 16π(σAB ) 3<br />
3∆G 2 V<br />
(2.12)<br />
In a polycrystalline material, nucleation is more likely to take place at the grain<br />
boundaries or at junctions between several grains. This is because the energy required<br />
for the formation <strong>of</strong> a critical nucleus is provided partly by the grain boundary area<br />
which is destroyed by the formation <strong>of</strong> new nucleus, thereby reducing the activation<br />
barrier. Assuming that the grain boundary area <strong>of</strong> matrix A-A eliminated during<br />
the formation <strong>of</strong> a nucleus <strong>of</strong> B at a grain junction <strong>of</strong> A is AAA = ar 2 , where r is the<br />
radius <strong>of</strong> curvature <strong>of</strong> surface bounding the new phase, the new grain boundary area<br />
formed between A <strong>and</strong> B, beAAB = br 2 . Let the volume <strong>of</strong> the new phase formed be<br />
V = cr 3 . The coefficients a, b <strong>and</strong> c are functions <strong>of</strong> grain boundary energies A-A<br />
<strong>and</strong> A-B. The work done in forming the nucleus is:<br />
W = σABbr 2 − σAAar 2 + ∆GVcr 3<br />
The work done for the formation <strong>of</strong> critical nucleus corresponds to dW/dr =0<br />
G ∗ =4 (bσAB − aσAA) 3<br />
27c 2 ∆G 2 V<br />
(2.13)<br />
(2.14)<br />
Nucleation at grain junctions can be evaluated by determining the values <strong>of</strong> a,b <strong>and</strong><br />
c corresponding to 2, 3 or 4-grain junctions. The activation energies <strong>of</strong> nucleation <strong>of</strong><br />
ferrite in austenite at the 2-grain, 3-grain <strong>and</strong> 4-grain junctions are shown in Fig. 2.3.<br />
It is concluded that G ∗ is the least for a 4-grain junction which means it is the most<br />
favoured site for ferrite nucleation, followed by 3-grain <strong>and</strong> 2-grain junctions. When<br />
the nucleus forms at the 4-grain junction, the energy supplied by the elimination<br />
<strong>of</strong> the boundary at these junctions is higher than in case <strong>of</strong> 2 or 3-grain junctions.<br />
Thus the requirement for net energy <strong>of</strong> critical nucleus formation is reduced in case<br />
13
<strong>of</strong> 4-grain junctions.<br />
2.5 Active Nucleus for Pearlite Formation<br />
Figure 2.3: Energy for ferrite nucleus formation (adopted from Clemm <strong>and</strong> Fisher<br />
[23]). The calculations are based on σ γγ =0.85 J m −2 <strong>and</strong> σ γα =0.6Jm −2 .<br />
2.5 Active Nucleus for Pearlite Formation<br />
Mehl <strong>and</strong> Dubé suggested that the orientation relationship observed between the fer-<br />
rite in pearlite <strong>and</strong> the parent austenite is not that observed when the ferrite forms<br />
directly from austenite [28]. Hence the active nucleus must be cementite. Subse-<br />
quently Smith <strong>and</strong> Mehl reinforced this view by arguing that when the orientation<br />
<strong>of</strong> ferrite in bainite with respect to austenite was crystallographically identical to<br />
that <strong>of</strong> Widmanstätten ferrite, then ferrite was the active nucleus for bainite [29].<br />
Conversely, the orientation <strong>of</strong> ferrite in pearlite was not the same as that for Wid-<br />
14
2.5 Active Nucleus for Pearlite Formation<br />
manstätten ferrite, cementite must be the active nucleus for pearlite formation. The<br />
authors did not recognise the fact that pearlitic ferrite could be unrelated to the<br />
austenite grain in which it was growing.<br />
Smith suggested that the crystal <strong>of</strong> proeutectoid ferrite, formed at the boundary<br />
between the two austenite grains would have a definite orientation relationship to<br />
one <strong>of</strong> them, resulting in a partially coherent interface. As a consequence <strong>of</strong> this,<br />
it will form an incoherent interface with the adjacent austenite grain. At lower<br />
undercoolings, the ferrite with an incoherent interface will grow into the grain with<br />
which it has no orientation relationship. In a similar way, the ferrite component <strong>of</strong><br />
a pearlite colony formed at the austenite grain boundary should also be related to<br />
one <strong>of</strong> the austenite grains, irrespective <strong>of</strong> whether it is nucleated before or after the<br />
cementite. Consequently, the pearlite colony will be able to grow by the movement<br />
<strong>of</strong> an incoherent ferrite-austenite interface i.e. into the austenite grain to which<br />
the ferrite is unrelated. The pearlitic ferrite should then bear a specific orientation<br />
relationship to the neighbouring austenite grain. This hypothesis was thus able<br />
to refute the observations made by Mehl <strong>and</strong> Dubé regarding different orientation<br />
relationships for pearlitic <strong>and</strong> Widmanstätten ferrite with respect to the austenite<br />
grain [30]. Thus ferrite may also serve as an active nucleus for pearlite formation.<br />
Hillert suggested that the misinterpretation <strong>of</strong> X-ray results <strong>of</strong> Mehl et al. may<br />
be attributed to the fact that they had used a single crystal <strong>of</strong> austenite in their<br />
study <strong>of</strong> pearlite <strong>and</strong> observed that the pearlitic ferrite did not have an orientation<br />
relationship with the parent austenite [31]. Such a conclusion had no bearing on a<br />
polycrystalline specimen.<br />
Nicholson used the phase diagram to show that both ferrite <strong>and</strong> cementite can be<br />
active nuclei depending on composition <strong>and</strong> temperature, which affect the nucleation<br />
rates <strong>of</strong> these two phases [32]. Below the eutectoid temperature, the austenite is su-<br />
persaturated with both ferrite <strong>and</strong> cementite <strong>and</strong> for whichever phase it is greatest,<br />
that phase will nucleate first. These considerations are based entirely on the concen-<br />
tration <strong>and</strong> hence not strictly valid.<br />
15
2.6 Orientation Gradients in Pearlite<br />
However, Russell, using free energy diagrams, put forward the following theory<br />
[33]. Below the eutectoid temperature ferrite <strong>and</strong> cementite are the stable phases<br />
<strong>and</strong> the equilibrium concentrations are given by drawing a common tangent, AB<br />
to the pairs <strong>of</strong> free energy curves shown in Fig. 2.4. For an alloy <strong>of</strong> composition<br />
c1, the driving force for nucleation is given by drawing a tangent to the austenite<br />
curve at c1 <strong>and</strong> the intersection <strong>of</strong> these tangents with the iso-concentration lines <strong>of</strong><br />
ferrite <strong>and</strong> cementite at the equilibrium concentrations <strong>of</strong> these two phases, c α <strong>and</strong><br />
c θ . For austenite <strong>of</strong> composition c1, the chemical free energy change for nucleation <strong>of</strong><br />
cementite is ∆GVa which is negative <strong>and</strong> for ferrite it is ∆GVb which is positive. As<br />
a result, the nucleation <strong>of</strong> cementite is thermodynamically feasible, whereas that <strong>of</strong><br />
ferrite is not. When the composition <strong>of</strong> austenite is c2, the situation is reversed <strong>and</strong><br />
ferrite nucleation becomes feasible with the driving force as ∆GVd <strong>and</strong> the cementite<br />
nucleation is not possible (∆GVc > 0). In this case, ferrite will nucleate first <strong>and</strong> the<br />
cementite will not nucleate until the local composition <strong>of</strong> austenite near the ferrite<br />
is readjusted such that cementite nucleation becomes thermodynamically feasible.<br />
At composition c0, the free energy change for ferrite <strong>and</strong> cementite becomes equal<br />
(∆GV < 0) <strong>and</strong> hence there is an equal probability <strong>of</strong> ferrite <strong>and</strong> cementite nucle-<br />
ation. Based on this discussion, Russell concluded that ferrite would be the active<br />
nucleus in case <strong>of</strong> hypoeutectoid steels <strong>and</strong> cementite for hypereutectoid steels.<br />
2.6 Orientation Gradients in Pearlite<br />
The strength <strong>of</strong> a ferrite-pearlite steel is generally attributed to the interlamellar<br />
spacing <strong>of</strong> ferrite <strong>and</strong> cementite in the pearlite colonies <strong>and</strong> it follows a Hall-Petch<br />
type relationship [35]. Apart from the contribution <strong>of</strong> interlamellar spacing, the<br />
strength is <strong>of</strong>ten attributed to the prior austenite grain size, size <strong>of</strong> the pearlite colony,<br />
amount <strong>of</strong> elements in solid solution <strong>and</strong> dislocation density in ferrite, etc. Ray <strong>and</strong><br />
Mondal have shown that the strength <strong>of</strong> steel may not be dictated by a Hall-Petch<br />
type relationship <strong>and</strong> there is a considerable variation in the strength levels even with<br />
constant interlamellar spacing in pearlite colonies in case <strong>of</strong> hypoeutectoid steels [36].<br />
They attributed the strength variation to the hydrostatic stresses exerted by the<br />
16
2.6 Orientation Gradients in Pearlite<br />
Figure 2.4: Free energy composition diagram for pearlite nucleation (adapted from<br />
P. R. Engel [34]).<br />
17
2.6 Orientation Gradients in Pearlite<br />
presence <strong>of</strong> proeutectoid ferrite in the microstructure. It is a common observation<br />
that the lamellar structure <strong>of</strong> pearlite is not always homogeneous <strong>and</strong> consists <strong>of</strong><br />
various substructures even in the annealed condition.<br />
Bramfit <strong>and</strong> Marder have shown that these substructural faults may be due to<br />
higher dislocation densities <strong>and</strong> extended dislocation substructures in the pearlitic<br />
ferrite <strong>and</strong> were associated with the discontinuities in the growth <strong>of</strong> that pearlite<br />
colony [37]. They also cited other substructural features such as dislocations at<br />
the cementite-ferrite interface <strong>and</strong> discontinuities in cementite lamellae containing a<br />
high density <strong>of</strong> dislocations. The substructural faults may originate as a combination<br />
<strong>of</strong> factors such as stresses due to phase transformation, due to inherent difference<br />
in crystallographic structures <strong>of</strong> ferrite <strong>and</strong> cementite <strong>and</strong> stresses resulting from<br />
external factors such as cooling from the transformation temperature. Reviewing<br />
these observations, Bramfit <strong>and</strong> Marder suggested that the effect <strong>of</strong> these factors on<br />
the strength <strong>of</strong> pearlite has been grossly underestimated. The contribution <strong>of</strong> these<br />
influencing factors have only been restricted to explain the deviations in the strength<br />
<strong>of</strong> pearlite during statistical analyses.<br />
Takahashi et al. have dealt with the influence <strong>of</strong> substructure <strong>and</strong> the crystallo-<br />
graphic texture <strong>of</strong> pearlite in their review [38]. They used a high resolution electron<br />
backscattered diffraction technique for the analysis <strong>of</strong> pearlitic ferrite <strong>and</strong> found<br />
that large misorientation gradients were observed, in contrast to the proeutectoid<br />
ferrite surrounding the pearlite colony, where no such gradients were observed. They<br />
also observed the orientation relationship between the ferrite <strong>and</strong> cementite in the<br />
pearlitic colonies was closer to Pitsch-Petch. The pearlite colonies showed a large<br />
number <strong>of</strong> geometrically necessary dislocations <strong>and</strong> it was suggested that these were<br />
formed during the course <strong>of</strong> pearlite growth. They attributed the large scatter ob-<br />
served in the strength <strong>of</strong> pearlite to the density <strong>of</strong> these dislocations.<br />
18
2.8 Mechanisms <strong>of</strong> Pearlite Growth<br />
a function <strong>of</strong> shape <strong>of</strong> the second phase particles apart from the size reflecting the<br />
differences in the structure <strong>and</strong> energy <strong>of</strong> the phase boundary. It has been shown<br />
that for diffusion <strong>of</strong> Ni in steel for a structure containing globular cementite, the ac-<br />
tivation energy energy (163.8 kJ mol −1 ) is higher than for a lamellar cementite (134.4<br />
kJ mol −1 ) in a temperature range 500 ◦ Cto650 ◦ C[45]. This may be attributed to the<br />
larger defect density at the lamellar interface as compared to the globular interface.<br />
2.8 Mechanisms <strong>of</strong> Pearlite Growth<br />
There are two principal mechanisms cited in the literature to explain the kinetics<br />
<strong>of</strong> pearlite growth, one involves the volume diffusion <strong>of</strong> carbon ahead <strong>of</strong> the trans-<br />
formation front, while the other relies on interfacial diffusion as the rate-controlling<br />
step.<br />
2.8.1 Volume diffusion<br />
Zener-Hillert theory: During the growth <strong>of</strong> pearlite, carbon must be transported<br />
from the edges <strong>of</strong> the ferrite lamellae to neighbouring cementite lamellae [7]. Here<br />
the diffusion is assumed to occur through the parent austenite phase. If the interfaces<br />
<strong>of</strong> ferrite-austenite <strong>and</strong> cementite-austenite are assumed to be planar, the concen-<br />
tration difference which drives the diffusion would be (cγα e -cγθ e ), where cγα e <strong>and</strong> cγθ e<br />
are the concentrations in austenite which is in equilibrium with ferrite <strong>and</strong> cementite<br />
respectively. These terms can be obtained from the extrapolated phase boundaries<br />
<strong>of</strong> the Fe − Fe3C phase diagram. However, because <strong>of</strong> curvature, the (γ/α + γ) phase<br />
boundaries cannot simply be extrapolated linearly but should be extended based on<br />
thermodynamic considerations. It was suggested by Zener that the real concentration<br />
difference would be represented approximately by (1-Sc/S)(c γα<br />
e -c γθ<br />
e ) because <strong>of</strong> the<br />
α/θ interfaces. Sc is the critical spacing at which the pearlite growth rate becomes<br />
zero <strong>and</strong> S is the interlamellar spacing. The term (1 − Sc/S) in equation, accounts<br />
for the decrease in free energy available for diffusion <strong>and</strong> can be derived using Hillert’<br />
s theory [16]. Out <strong>of</strong> the total free energy available for pearlite transformation, a<br />
23
2.8 Mechanisms <strong>of</strong> Pearlite Growth<br />
respect to the fact that here the growth rate is fixed as imposed by the translation<br />
velocity <strong>and</strong> the transformation temperature is a free variable. This was first applied<br />
to Fe-C alloys by Bramfitt <strong>and</strong> Marder [49]. This technique was alternately used<br />
by Bolling <strong>and</strong> Richman [50] who examined the relationship <strong>of</strong> interlamellar spacing<br />
<strong>and</strong> velocity <strong>and</strong> obtained the relation vS n = constant, where n =2.3 ± 0.1. For a<br />
forced velocity growth 100 to 1 µms −1 , Verhoeven <strong>and</strong> Pearson [51] obtained an ex-<br />
ponent <strong>of</strong> S equal to 2.07. Over the range <strong>of</strong> forced velocities studied all the spacing<br />
<strong>and</strong> velocity data showed a good agreement <strong>and</strong> gave the relationship vS 2 =constant<br />
<strong>and</strong> hence provided a strong support for volume diffusion being the rate controlling<br />
process.<br />
In spite <strong>of</strong> these attempts to justify the volume diffusion <strong>of</strong> carbon as the rate-<br />
controlling mechanism in Fe-C steels, there still exist discrepancies with the exper-<br />
imentally observed pearlite growth rates. These discrepancies are sufficiently large<br />
to render the microstructural calculations associated with steel development to be<br />
doubtful.<br />
2.8.2 Interface diffusion<br />
The principal reason behind the attempt to introduce boundary diffusion is the<br />
inability <strong>of</strong> the volume diffusion to account for experimentally observed growth rates<br />
in Fe-C <strong>and</strong> other non-ferrous alloys, rates which are usually higher than expected.<br />
This led many researchers to believe that there must be an alternate mechanism<br />
for the transport <strong>of</strong> solute <strong>and</strong> the interface diffusion theory seemed to be the most<br />
plausible explanation [27, 52]. Sundquist assumed the interface diffusion <strong>of</strong> carbon to<br />
be a dominant mechanism driving the edgewise growth <strong>of</strong> pearlite [15]. The growth<br />
rate was calculated using the assumption <strong>of</strong> local equilibrium <strong>and</strong> included the effect<br />
<strong>of</strong> capillarity. Using the experimental data for pearlite growth velocity for Fe-C<br />
steels, the activation energy for interface diffusion was calculated as 191 kJ mol −1<br />
which was far too high. Although, it was attributed to the presence <strong>of</strong> impurity<br />
atoms present in the steel, the justification seems to be unrealistic.<br />
26
2.8 Mechanisms <strong>of</strong> Pearlite Growth<br />
calculated β0 <strong>and</strong> based on the experimental values <strong>of</strong> v <strong>and</strong> S. They argued what<br />
value <strong>of</strong> Di will make βi=β0 or what apparent diffusivity Dapp would be necessary<br />
to give the required segregation <strong>of</strong> solute elements.<br />
If the value <strong>of</strong> βi is equal to β0, this can be considered as an evidence that the<br />
growth rate <strong>of</strong> pearlite is controlled by the volume diffusion <strong>of</strong> solute through the<br />
austenite. If the observed value <strong>of</strong> βi is less than β0, then some process other than<br />
the diffusion in austenite is controlling the rate. If βi exceeds β0, this can point to<br />
the existence <strong>of</strong> a faster diffusion path.<br />
In the case <strong>of</strong> non ferrous pearlite, Cahn <strong>and</strong> Hagel showed that the apparent<br />
diffusivities Dapp are higher than the Di (or the experimental diffusivity) by orders<br />
<strong>of</strong> magnitude. Hence βi exceeds β0 <strong>and</strong> that was taken as strong indication that an<br />
alternate diffusion path or a diffusion short circuit exists. Regarding pearlite in steel,<br />
there was a reasonable agreement between Dapp <strong>and</strong> the D γ<br />
C<br />
in plain carbon steels<br />
for which the v, S <strong>and</strong> β0 are known <strong>and</strong> hence led to the conclusion that carbon<br />
diffusion in austenite controls the pearlite growth in these steels. However, the v<br />
<strong>and</strong> S that they used in their calculations were not measured for the same steel.<br />
Moreover, pearlite growth in plain carbon steels is as fast as permitted by carbon<br />
diffusion in austenite, but in high purity steels it grows almost 50 times faster. This<br />
could well be attributed to the spacings in high purity steels, but the measurements<br />
showed that the spacings were almost comparable to those in plain carbon steels.<br />
This further strengthens the fact that another mechanism is operative for carbon<br />
diffusion.<br />
Diffusion through ferrite: Nakajima et al. considered the effect <strong>of</strong> diffusion in<br />
ferrite along with that in austenite using a phase field approach [55]. They reported<br />
that since the diffusion in ferrite is much faster than in austenite <strong>and</strong> when this was<br />
coupled with the latter, the difference in calculated <strong>and</strong> the experimental growth rate<br />
<strong>of</strong> pearlite was narrowed down. It was argued that the higher velocity (compared<br />
to that in austenite alone) resulting from their model, apart from faster diffusivity<br />
in ferrite, was due to a large ratio <strong>of</strong> ferrite-cementite interfacial area as compared<br />
30
2.8 Mechanisms <strong>of</strong> Pearlite Growth<br />
to that in case <strong>of</strong> cementite-austenite interfaces. The phase field calculations show<br />
the thickening <strong>of</strong> cementite behind the transformation front when the diffusion oc-<br />
curs in ferrite. Cahn <strong>and</strong> Hagel considered the effect <strong>of</strong> diffusion in ferrite but did<br />
not observe any tapering <strong>of</strong> cementite at the transformation front [27]. Since the<br />
calculated velocities were still not able to explain the observed growth rates, they<br />
attributed the same to the influence <strong>of</strong> transformation strain or diffusion through<br />
the boundary. Steinbach <strong>and</strong> Apel [56] modelled the pearlite using the phase field<br />
calculations <strong>and</strong> studied the influence <strong>of</strong> transformation strains present due to the<br />
concentration gradients in austenite whilst considering the diffusion in ferrite. Ac-<br />
cording to their theory, the transformation strains inhibit the co-operative growth <strong>of</strong><br />
ferrite <strong>and</strong> cementite resulting in solitary growth <strong>of</strong> wedge-shaped cementite ahead<br />
<strong>of</strong> the ferrite which they termed as ‘staggered growth’. Again the effect <strong>of</strong> interface<br />
diffusion control was ignored apparently due to the lack <strong>of</strong> interface diffusivity data.<br />
But in the Fe-C alloys studied to date, wedge shaped cementite has never been ob-<br />
served experimentally. Although this theory could further bridge the gap between<br />
the calculated <strong>and</strong> the observed growth rate in Fe-C system compared with those <strong>of</strong><br />
Nakajima et al., this was fundamentally weak due to the fact that in a reconstruc-<br />
tive transformation, the transformation strains are mitigated during the course <strong>of</strong><br />
the reaction.<br />
Combined volume <strong>and</strong> phase boundary diffusion: Hashiguchi <strong>and</strong> Kirkaldy,<br />
for the first time made an elegant attempt to simultaneously deal with interface <strong>and</strong><br />
volume diffusion in Fe-C alloys [57]. They assumed a parallel mass flow through the<br />
volume <strong>of</strong> austenite <strong>and</strong> the advancing pearlite-austenite interface, with a mechanical<br />
equilibrium at the interface junctions <strong>and</strong> the effects <strong>of</strong> capillarity. The distribution<br />
coefficient describing the ratio <strong>of</strong> composition in austenite in contact with ferrite <strong>and</strong><br />
cementite <strong>and</strong> in the transformation front was assumed to be constant even though<br />
the interfacial energies σ γα <strong>and</strong> σ γθ are not expected to be the same. They used<br />
the growth <strong>and</strong> spacing data <strong>of</strong> Brown <strong>and</strong> Ridley [58] in their model in order to<br />
arrive at the activation energy for the boundary diffusion <strong>of</strong> carbon, which was in<br />
the range <strong>of</strong> 159-169 kJ mol −1 . This clearly did not make sense as the value obtained<br />
31
2.9 Pearlite in Multicomponent Steels<br />
was greater than activation energy for volume diffusion <strong>of</strong> both ferrite <strong>and</strong> austenite.<br />
The interfacial energy values σαθ obtained were also rather too large. The theory<br />
thus developed was too complex to be implemented, requiring approximations which<br />
rendered the details unimportant.<br />
2.9 Pearlite in Multicomponent Steels<br />
Most <strong>of</strong> the commercially produced steels contain either one or many alloying addi-<br />
tions. The presence <strong>of</strong> the substitutional elements <strong>and</strong> their interaction with carbon<br />
makes the calculation <strong>of</strong> diffusion controlled growth in such systems quite compli-<br />
cated. The growth <strong>of</strong> proeutectoid ferrite from austenite in Fe-C-X system, where X<br />
is the substitutional alloying element has been studied in considerable details owing<br />
to the relative simplicity <strong>of</strong> the influence <strong>of</strong> a ternary addition on the growth rate<br />
[59–62]. However in case <strong>of</strong> pearlite growth, the situation is more complex owing<br />
to the partitioning <strong>of</strong> the substitutional element between the two product phases<br />
namely ferrite <strong>and</strong> cementite. For a ternary system involving carbon <strong>and</strong> a substi-<br />
tutional element, different diffusion paths can exist. The pearlite growth rate can<br />
be controlled by diffusion <strong>of</strong> carbon or substitutional solute through the volume <strong>of</strong><br />
austenite or the pearlite-austenite interface, or simultaneous diffusion <strong>of</strong> both these<br />
species.<br />
2.9.1 Thermodynamics <strong>of</strong> ternary systems<br />
In a binary alloy system, the common tangent construction using a free energy-<br />
composition diagram can easily give the composition <strong>of</strong> the growing phase (or phases)<br />
in equilibrium with the parent phase. However in a ternary steel (Fe-C-X) containing<br />
a substitutional alloying element, X, the situation is more complex. The free energy<br />
curves for the parent <strong>and</strong> product phases become three dimensional surfaces <strong>and</strong> an<br />
infinite set <strong>of</strong> tangent planes can be constructed. In order to choose a unique set <strong>of</strong><br />
γ +α/α <strong>and</strong> γ +θ/θ tie-lines, the two fluxes <strong>of</strong> carbon <strong>and</strong> X must be simultaneously<br />
32
2.9 Pearlite in Multicomponent Steels<br />
<strong>of</strong> pearlite by increasing the activation energy for those atomic movements at the<br />
moving interface which are required because <strong>of</strong> the differences in crystal structure <strong>of</strong><br />
austenite <strong>and</strong> ferrite <strong>and</strong> cementite in contact with it. They observed partitioning<br />
<strong>of</strong> Mn to cementite based on the chemical analysis <strong>of</strong> the extracted carbides for a<br />
1.0Mn wt% eutectoid steel above 640 ◦ C. These data involved a contribution <strong>of</strong> Mn<br />
partitioning from ferrite to cementite behind the growth front (the steel was held<br />
at the transformation temperature for 24 h) <strong>and</strong> hence it was difficult to exactly<br />
determine the no-partitioning temperature.<br />
Razik et al. suggested that the electron probe micro-analyser was not an effective<br />
tool for partitioning studies owing to its poor resolution (2 µm) as it could not<br />
measure the composition <strong>of</strong> cementite lamella only, the thickness <strong>of</strong> which was far<br />
less than 2 µm. They used analytical electron microscopy to study the partitioning<br />
behaviour <strong>of</strong> manganese between cementite <strong>and</strong> ferrite during austenite to pearlite<br />
transformation in 1.08 <strong>and</strong> 1.8Mn wt% steel [17]. It was observed that the manganese<br />
partitions preferentially to cementite at the transformation interface above a certain<br />
temperature which was described as the no-partition temperature, which depends on<br />
the composition. Partitioning <strong>of</strong> Mn to cementite was not observed at temperatures<br />
below 683 ◦ C <strong>and</strong> 645 ◦ C for 1.08 <strong>and</strong> 1.8Mn wt% respectively. The values obtained<br />
were in good agreement with those determined from thermodynamic data for the<br />
two steels. It is worth noting that the compositions used in plotting the γ/γ + α <strong>and</strong><br />
γ/γ + θ phase boundaries for these two steels were based on a binary phase diagram.<br />
This was clearly an incorrect procedure since the effect <strong>of</strong> ternary addition, i.e. Mn<br />
should have been considered using isothermal sections <strong>of</strong> a ternary phase diagram<br />
for calculating the interfacial compositions by choosing a correct tie-line. Further<br />
they assumed that below this characteristic no-partition temperature, the growth <strong>of</strong><br />
pearlite is controlled by either the volume or interface diffusion <strong>of</strong> carbon <strong>and</strong> that<br />
the both the mechanisms are equally probable. The pearlite growth rate calculated<br />
using this assumption deviated from those observed experimentally by a factor <strong>of</strong><br />
1-3 for both these mechanisms.<br />
35
2.9 Pearlite in Multicomponent Steels<br />
A comparison <strong>of</strong> experimental <strong>and</strong> calculated growth rates by Sharma et al. for<br />
various Cr contents is shown in Fig. 2.6.<br />
Al-Salman et al. studied the partitioning behaviour in a Fe-1.0Mn-1.0Cr-0.8C<br />
wt% eutectoid steel <strong>and</strong> observed simultaneous segregation <strong>of</strong> Cr <strong>and</strong> Mn to the<br />
cementite at the transformation front down to 600 ◦ C, but they were unable to identify<br />
a no-partition temperature [66]. It was argued that the resolution <strong>of</strong> the analytical<br />
technique used by Razik et al. was insufficient causing the overlap <strong>of</strong> the beam on<br />
the adjacent ferrite lamella. Another reason might be the extrapolation technique<br />
used by these researchers might have led to an overestimation <strong>of</strong> the partitioning<br />
temperature. Ricks studied the partitioning behaviour <strong>of</strong> 13Mn wt.% eutectoid steel<br />
<strong>and</strong> a Fe-10Cr-0.2C wt.% steel <strong>and</strong> observed full partitioning <strong>of</strong> Mn <strong>and</strong> Cr to the<br />
cementite <strong>and</strong> suggested that the diffusion path <strong>of</strong> these solutes was the interface,<br />
since there was no gradient <strong>of</strong> these solutes observed in austenite [67].<br />
Tiwari <strong>and</strong> Sharma [68] calculated the pearlite growth rate in alloys containing<br />
a range <strong>of</strong> elements (Mn, Cr, Ni, Si) using a model developed by Sharma [69] <strong>and</strong><br />
Sharma et al. [70]. They considered the thermodynamic effect <strong>of</strong> the ternary solute<br />
in determining the phase boundaries <strong>of</strong> the austenite in equilibrium with ferrite <strong>and</strong><br />
cementite. The calculations were based on the fact that at low supersaturations, the<br />
pearlite growth rate is governed by the interface diffusion <strong>of</strong> the substitutional solute<br />
<strong>and</strong> at high supersaturations, carbon volume diffusion controls the growth rate. It<br />
was suggested that the partitioning-no partitioning temperature was a function <strong>of</strong> the<br />
alloy composition <strong>and</strong> it decreases with the increase in substitutional solute content.<br />
They also calculated the growth rates based on para-equilibrium conditions, but such<br />
a condition clearly cannot be justified given the reconstructive nature <strong>of</strong> the pearlite<br />
transformation.<br />
Hutchinson et al. measured the composition pr<strong>of</strong>ile <strong>of</strong> Mn across the austenite-<br />
pearlite interface as a function <strong>of</strong> time in steel containing manganese using the analyt-<br />
ical transmission electron microscopy [71]. The results were compared with those cal-<br />
37
(a)<br />
(b)<br />
(c)<br />
2.9 Pearlite in Multicomponent Steels<br />
38<br />
Figure 2.6: Pearlite growth rates calculated by Sharma et al. for (a) 0.4, (b) 0.9 <strong>and</strong><br />
(c) 1.8Cr wt%.
2.10 Divergent Pearlite<br />
culated using local equilibrium (LE) assumption. The alloy (Fe-3.51Mn-0.54C wt%)<br />
treated at 625 ◦ C for 2.5, 5 <strong>and</strong> 10 h in the two phase (α + θ) region revealed that<br />
the composition <strong>of</strong> Mn in both the ferrite <strong>and</strong> cementite remained constant during<br />
the steady state growth <strong>and</strong> can be well approximated by the LE condition.<br />
2.10 Divergent Pearlite<br />
In certain alloys, pearlite can form above the lower Ae1 temperature when the steel<br />
is isothermally held in the 3 phase region (austenite+ferrite+cementite) for a pro-<br />
longed length <strong>of</strong> time. This phenomenon was first observed in pearlite by Cahn <strong>and</strong><br />
Hagel in Fe-5.2Mn-0.6C wt% steel in the temperature range <strong>of</strong> 500-650 ◦ C wherein<br />
at a given reaction temperature, the growth rate decreased as a function <strong>of</strong> time <strong>and</strong><br />
the interlamellar spacing increased [72]. This results from the continuously changing<br />
carbon concentration in the austenite, until it reaches a composition in equilibrium<br />
with ferrite <strong>and</strong> cementite <strong>and</strong> the reaction stops at this point. Hillert explained the<br />
divergency <strong>of</strong> pearlite based on the thermodynamics <strong>of</strong> the ternary Fe-Mn-C phase<br />
diagram [73]. In an alloy steel containing Mn, it is reasonable to assume that the<br />
growth rate <strong>of</strong> pearlite is so slow that there is sufficient time for carbon to establish<br />
a uniform carbon activity along the pearlite-austenite interface. He suggested that<br />
the conditions at the interface can be examined by choosing a carbon activity cor-<br />
responding to the average alloy composition <strong>and</strong> by plotting an iso-activity line. In<br />
Fig. 2.7, the point <strong>of</strong> intersection <strong>of</strong> this iso-activity line with the γ + α <strong>and</strong> γ + θ<br />
phase boundaries (marked with an open circle) represent the composition <strong>of</strong> austen-<br />
ite at the ferrite <strong>and</strong> cementite interfaces. The end <strong>of</strong> these tie lines would give<br />
the corresponding composition <strong>of</strong> the growing ferrite <strong>and</strong> cementite (solid circles).<br />
Since the average alloy content cannot change, the growing pearlite must lie on the<br />
line joining the compositions <strong>of</strong> growing ferrite <strong>and</strong> cementite (represented as a solid<br />
diamond). The growing pearlite has a carbon content which is much higher than the<br />
alloy <strong>and</strong> hence it draws carbon from the parent austenite leaving a zone depleted<br />
with carbon. This leads to a reduction in the activity <strong>of</strong> carbon in austenite in the<br />
vicinity <strong>of</strong> the interface over a period <strong>of</strong> time. As the transformation progresses, the<br />
39
2.10 Divergent Pearlite<br />
conditions prevailing at the interface can be described by the carbon isoactivity line<br />
corresponding to lower carbon activities moving to the left (in the direction <strong>of</strong> arrow).<br />
This would mean that the ∆c γ<br />
Mn ,(2.7), which is the driving force for partitioning<br />
<strong>of</strong> Mn decreases continuously, thereby slowing the growth rate <strong>and</strong> leading to a con-<br />
comitant increase in the interlamellar spacing. As the carbon activity in austenite<br />
falls to a value where the isoactivity line approaches the one passing through the<br />
stable austenite corner (marked E), the growth rate will cease before the transfor-<br />
mation is complete. Hutchinson et al. analysed a Fe-0.55C-5.42Mn wt% steel <strong>and</strong><br />
observed a similar divergency in the pearlitic structure when held at 625 ◦ Cfor168<br />
<strong>and</strong> 384h [71]. Using analyical transmission electron microscopy technique, it was<br />
observed that during the course <strong>of</strong> formation <strong>of</strong> such pearlite, the Mn composition<br />
<strong>of</strong> ferrite <strong>and</strong> cementite increased continuously with time.<br />
40
2.10 Divergent Pearlite<br />
Figure 2.7: Schematic isothermal section <strong>of</strong> the Fe-C-X phase diagram showing the<br />
formation <strong>of</strong> divergent pearlite. The cross represents the average alloy composition<br />
in the 3-phase region.<br />
41
Chapter 3<br />
Pearlite Growth in Fe-C alloys<br />
3.1 Introduction<br />
Cementite is rich in carbon whereas ferrite accommodates very little when it is in<br />
equilibrium with either cementite or austenite. It is therefore necessary for carbon to<br />
be redistributed at the transformation front. This can happen either by diffusion in<br />
the austenite in a direction parallel to the transformation front, or by the migration<br />
<strong>of</strong> solute atoms within the α/γ <strong>and</strong> θ/γ interfaces. When the mobility <strong>of</strong> the interface<br />
is large, both <strong>of</strong> these mechanisms are said to be diffusion–controlled, i.e., most <strong>of</strong> the<br />
available free energy is dissipated in driving diffusion [74]. This chapter discusses<br />
the conventional pearlite growth theories in Fe-C alloys <strong>and</strong> a new theory is for-<br />
mulated for simultaneous diffusion through the austenite <strong>and</strong> the pearlite-austenite<br />
transformation front. It is pertinent to begin the discussion with a brief account <strong>of</strong><br />
the interlamellar spacing criteria.<br />
3.2 Interlamellar Spacing Criteria<br />
The equation for the velocity <strong>of</strong> pearlite for volume or boundary diffusion-controlled<br />
growth described in chapter 2 does not give a unique solution for the growth rate, but<br />
rather a range <strong>of</strong> velocities <strong>and</strong> spacings which would satisfy the equation. Hence in<br />
42
3.2 Interlamellar Spacing Criteria<br />
data, a curve <strong>of</strong> velocity versus spacing can be plotted. But it is important to<br />
underst<strong>and</strong> which point on this plot would correspond to the actual velocity <strong>and</strong><br />
spacing observed experimentally. Sundquist in his theory <strong>of</strong> optimal spacing has<br />
considered two mechanisms which can lead to the changes in interlamellar spacings<br />
[15].<br />
In the first mechanism, U, (which is the velocity <strong>of</strong> pearlite growth normalised by<br />
the boundary diffusivity <strong>of</strong> carbon <strong>and</strong> the thickness <strong>of</strong> the interface) as a function <strong>of</strong><br />
pearlite interlamellar spacing for a particular set <strong>of</strong> conditions is shown Fig. 3.1. It<br />
was suggested that the interface may be unstable with respect to some infinitesimal<br />
perturbation under certain conditions. For a situation where the spacing is very<br />
small, the driving free energy is less than that required to maintain ferrite-cementite<br />
interface <strong>and</strong> hence the velocity is negative. Consider a range <strong>of</strong> spacings where the<br />
∂U/∂S is positive, <strong>and</strong> those less than the spacing pertaining to maximum velocity.<br />
Jackson <strong>and</strong> Hunt [75] suggested that the interface with such spacings is unstable with<br />
respect to a small perturbation. As a result, those with smaller interlamellar spacings<br />
will have a growth velocity less than its immediate neighbour <strong>and</strong> hence the bigger<br />
lamella will begin to outgrow the smaller one leading to its elimination. This leads<br />
to a situation where any spacing with a velocity smaller than that corresponding to<br />
the maximum is inherently unstable <strong>and</strong> will change quickly to that <strong>of</strong> the maximum<br />
velocity. This was referred to as the lower catastrophic limit.<br />
Using an argument similar to the one above, it has been shown that any spacing<br />
with a negative ∂U/∂S will be stable with respect to a small perturbation <strong>and</strong><br />
the perturbations in spacing will die out leading to a perfectly uniform spacing<br />
throughout the growing pearlite colony. Thus, this treatment based on the stability<br />
<strong>of</strong> interface could theoretically predict the transition zone beyond which the spacings<br />
would be stable.<br />
In the second mechanism consider a case where the interlamellar spacing is large.<br />
From calculations by Sundquist, it is clear that the interface shapes are dependent<br />
largely on the interlamellar spacings. At smaller spacings, the interfaces are convex<br />
45
3.2 Interlamellar Spacing Criteria<br />
Figure 3.1: Velocity <strong>of</strong> pearlite as a function <strong>of</strong> interlamellar spacing, adopted from<br />
Sundquist [15]<br />
46
3.3 Pearlite Growth Based on Conventional Theories<br />
Figure 3.2: Comparison <strong>of</strong> pearlite growth rate calculated assuming volume diffusion<br />
in austenite <strong>and</strong> boundary diffusion (solid lines) with those determined by Brown<br />
<strong>and</strong> Ridley (points).<br />
49
3.3 Pearlite Growth Based on Conventional Theories<br />
the available experimental data (Fig. 3.2). It is observed that the calculated growth<br />
rate overestimates observations by a factor <strong>of</strong> 2 at low temperatures. However,<br />
there seems to be no sound justification for ignoring the flux through the volume<br />
<strong>of</strong> austenite. The assumption regarding the magnitude <strong>of</strong> the activation energy for<br />
boundary diffusion <strong>of</strong> carbon may also be crude.<br />
Apart from the theories discussed above, Pearson <strong>and</strong> Verhoeven [14] proposed that<br />
transformation strain enhances diffusion, but this neglects the fact that pearlite forms<br />
by reconstructive transformation in which case transformation strains should not be<br />
significant; furthermore, it has not been necessary to invoke such an argument in the<br />
case <strong>of</strong> other reconstructive transformations where the closure between experiment<br />
<strong>and</strong> theory is satisfactory [74].<br />
Most <strong>of</strong> the comparisons between experiment <strong>and</strong> theory have been based on as-<br />
sumptions <strong>of</strong> either volume or interface–diffusion control; in other words, mechanisms<br />
in isolation. Fluxes through both <strong>of</strong> these processes must in practice contribute to<br />
diffusion <strong>and</strong> the relative contributions from each <strong>of</strong> these mechanisms will vary with<br />
circumstances.<br />
3.3.1 Collector plate model<br />
Aaron <strong>and</strong> Aaronson devised a way to combine the effect <strong>of</strong> volume <strong>and</strong> boundary<br />
diffusion using a collector plate model [79]. They analysed the lengthening <strong>and</strong> thick-<br />
ening <strong>of</strong> θ precipitates in Al-4Cu wt% which nucleate on the grain boundaries <strong>and</strong><br />
preferentially grow along them as allotriomorphs. The experimentally determined<br />
lengthening <strong>and</strong> thickening rates were far too rapid to be described by the volume<br />
diffusion <strong>of</strong> Cu towards the growing allotriomorphs. The mechanism suggests that<br />
for lengthening <strong>of</strong> θ precipitates, Cu diffuses to the α/α grain boundaries by volume<br />
diffusion, followed by grain boundary diffusion to the tip <strong>of</strong> growing allotriomorph.<br />
The analysis led to the relation <strong>of</strong> the form R = k2t 1/4 where k2 is a constant. The<br />
thickening <strong>of</strong> precipitates is controlled by the rate <strong>of</strong> diffusion <strong>of</strong> Cu along the α/θ<br />
boundary through the broad faces <strong>of</strong> the allotriomorphs <strong>and</strong> the rate is given as<br />
50
3.3 Pearlite Growth Based on Conventional Theories<br />
R = k2t 1/2 . This mechanism assumes that the ratio <strong>of</strong> α/α grain boundary diffusiv-<br />
ity to that <strong>of</strong> volume diffusivity is almost infinitely higher <strong>and</strong> is restricted to low<br />
temperatures. Subsequently this model was refined by Goldman et al. to account<br />
for the growth mechanism <strong>of</strong> Al-4Cu wt% at higher temperature, T/Tsolidus ≈ 0.91<br />
where volume diffusion becomes significant [80].<br />
In the case <strong>of</strong> pearlite growth in steels, there is no long-range transport <strong>of</strong> solute<br />
since that <strong>of</strong> carbon is from the tips <strong>of</strong> adjacent ferrite lamellae. This model also<br />
assumes that volume <strong>and</strong> boundary diffusion occur in series, which may not be a<br />
valid argument for pearlite, where they are simultaneous. Hence it was assumed<br />
that the collector plate model may not be applicable to pearlite growth in steels,<br />
thus necessitating an alternative approach to consider combined fluxes.<br />
3.3.2 Combined volume <strong>and</strong> phase boundary diffusion<br />
Hashiguchi <strong>and</strong> Kirkaldy [57] made a first attempt by assuming parallel mass transfer<br />
in the volume ahead <strong>of</strong> the interface <strong>and</strong> through the interface, allowing for the<br />
Gibbs–Thomson effect at both the γ/θ <strong>and</strong> γ/α boundaries, <strong>and</strong> for mechanical<br />
equilibrium at the various interfacial junctions. The result was a rather complex<br />
theory which could not be implemented without making important approximations:<br />
• in spite <strong>of</strong> the requirement <strong>of</strong> mechanical equilibrium, the interfaces with<br />
austenite were approximated as being flat except in the close proximity <strong>of</strong><br />
the three–phase junctions;<br />
• the segregation coefficient describing the ratio <strong>of</strong> the composition in the austen-<br />
ite in contact with ferrite or cementite, <strong>and</strong> in the transformation front was<br />
assumed to be constant, even though the interfacial energies σ γα <strong>and</strong> σ γθ are<br />
not expected to be identical;<br />
• a simplification was made that σ γα ∝ σ αθ <strong>and</strong> σ γθ ∝ σ αθ .<br />
Whilst these approximations are entirely underst<strong>and</strong>able, some clearly are inconsis-<br />
tent with the detailed theory <strong>and</strong> the whole problem might be simplified by ab<strong>and</strong>on-<br />
51
3.4 Model Formulation: Mixed Diffusion-Controlled Growth<br />
ing the need for mechanical equilibrium. Indeed, it is not strictly necessary during<br />
growth when the rate <strong>of</strong> free energy dissipation is large, for equilibrium configurations<br />
to be respected as long as the process leads to a net reduction in free energy. This<br />
can be seen during two–dimensional grain growth simulations assuming orientation–<br />
independent boundary energies, where the triple junctions do not maintain 120 ◦<br />
angles during the process <strong>of</strong> growth, as might be required by mechanical equilibrium<br />
[81]. Another analogy is phase transformation where the chemical potential <strong>of</strong> a<br />
particular solute can increase with the passage <strong>of</strong> the interface as long as the overall<br />
free energy is reduced.<br />
The goal <strong>of</strong> the present work was to derive a simplified theory which still deals<br />
with diffusion simultaneously through the boundary <strong>and</strong> volume <strong>and</strong> to compare the<br />
data against experiments.<br />
3.4 Model Formulation: Mixed Diffusion-Controlled<br />
Growth<br />
3.4.1 Assumptions<br />
(i) To be consistent with diffusion–controlled growth, local equilibrium is assumed<br />
to exist at the interfaces so that the chemical potentials µ <strong>of</strong> all elements are<br />
uniform there:<br />
µ γ<br />
Fe = µα Fe<br />
<strong>and</strong> µ γ<br />
C = µα C<br />
It follows that the compositions where the different phases are in contact are<br />
given by tie–lines <strong>of</strong> the equilibrium Fe–C phase diagram, which were calculated<br />
using MTDATA [76] <strong>and</strong> the TCFE database, Fig. 3.3.<br />
(ii) Since the kinetic theory gives the growth rate as a function <strong>of</strong> interlamellar<br />
spacing rather than a unique velocity, it is assumed that the actual spacing<br />
adopted is that which leads to a maximum in the rate <strong>of</strong> entropy production<br />
[57] although the maximum growth rate criterion [6] is also considered for the<br />
sake <strong>of</strong> completeness.<br />
52
3.4 Model Formulation: Mixed Diffusion-Controlled Growth<br />
(iii) The model is created for conditions in which fluxes from diffusion within the<br />
austenite ahead <strong>of</strong> the transformation front, <strong>and</strong> that via transport through<br />
the transformation front both contribute to growth.<br />
Figure 3.3: The extrapolated phase boundaries for equilibrium between austenite<br />
<strong>and</strong> cementite, <strong>and</strong> austenite <strong>and</strong> ferrite, in the Fe–C system.<br />
3.4.2 Weighted average diffusion coefficient<br />
The diffusion coefficient D γ<br />
C <strong>of</strong> carbon in austenite is strongly dependent on concentration<br />
[82, 83]. A model which takes into account the thermodynamics <strong>of</strong> carbon–<br />
carbon interactions [42, 43] has been used in determining the diffusion coefficient,<br />
53
3.4 Model Formulation: Mixed Diffusion-Controlled Growth<br />
arate values corresponding to the α/γ <strong>and</strong> θ/γ interfaces. Fig. 3.4 illustrates the<br />
geometry <strong>of</strong> the pearlite colony.<br />
Figure 3.4: Geometry <strong>of</strong> pearlite colony. The dashed arrows indicate the volume <strong>and</strong><br />
boundary diffusion processes. The thickness <strong>of</strong> the boundary is written δ.<br />
The flux JV away from the ferrite (equal to that towards the cementite), through<br />
the volume <strong>of</strong> the austenite is given by:<br />
JV = − Aα<br />
Vm<br />
D dc<br />
dx<br />
= DbSα<br />
Vm<br />
(c γα − c γθ )<br />
S α /2<br />
(3.12)<br />
where Vm is the molar volume <strong>of</strong> austenite (7.1×10 −6 m 3 mol −1 ) <strong>and</strong> to a good<br />
approximation assumed to be the same for all the phases involved, <strong>and</strong> A α is the<br />
55
3.4 Model Formulation: Mixed Diffusion-Controlled Growth<br />
ature in Fig. 3.6; as might be expected, boundary diffusion dominates except at the<br />
highest <strong>of</strong> transformation temperatures.<br />
Figure 3.6: Relative contributions <strong>of</strong> volume <strong>and</strong> boundary diffusion fluxes during<br />
the formation <strong>of</strong> pearlite in Fe-0.8C wt% steel.<br />
3.4.4 Evaluation <strong>of</strong> spacing criteria<br />
In order to determine the growth rate <strong>of</strong> pearlite for the new mixed–diffusion theory,<br />
it is imperative to determine the relation between S <strong>and</strong> Sc. How these numbers are<br />
modified for the mixed volume <strong>and</strong> boundary–diffusion modes is discussed here.<br />
Maximum growth rate: The velocity can be plotted as a function <strong>of</strong> S/Sc over<br />
a range <strong>of</strong> temperatures. The concentration gradient is constant for a particular<br />
58
3.4 Model Formulation: Mixed Diffusion-Controlled Growth<br />
temperature <strong>and</strong> hence would not affect the relative position <strong>of</strong> the curve with respect<br />
to S/Sc. Approximate value <strong>of</strong> interlamellar spacing is assumed <strong>and</strong> the critical<br />
spacing is evaluated assuming σ αθ =0.7Jm −2 , since the S/Sc is independent <strong>of</strong> the<br />
interfacial energy:<br />
Sc =<br />
2 σαθ<br />
∆G<br />
(3.17)<br />
The term, ∆G is the total free energy available during the transformation <strong>and</strong> is<br />
calculated using MTDATA <strong>and</strong> TCFE database [76]. The interlamellar spacing is<br />
then gradually increased to generate a set <strong>of</strong> S/Sc data. From the plot <strong>of</strong> velocity<br />
versus spacing, the S/Sc at which the velocity is maximum is determined. Fig. 3.7<br />
shows the pearlite growth velocity versus spacing plots for a range <strong>of</strong> temperatures.<br />
The values <strong>of</strong> S/Sc vary from 1.36 to 1.53 over the range <strong>of</strong> temperatures studied.<br />
Maximum rate <strong>of</strong> entropy production: The rate <strong>of</strong> entropy production ˙ S based<br />
on the equation 3.7 has been calculated using an approach similar to the one discussed<br />
for the maximum growth rate. The maximum in ˙ S is obtained when S/Sc is between<br />
2.01 to 2.17 depending on the temperature <strong>of</strong> transformation, but independent <strong>of</strong><br />
the interfacial energy σ αθ . The variation <strong>of</strong> ˙ S as a function <strong>of</strong> spacing is shown in<br />
Fig. 3.8 for the range <strong>of</strong> temperatures under consideration.<br />
3.4.5 Interfacial energy<br />
The interfacial energy per unit area <strong>of</strong> the ferrite-cementite interfaces, (σ αθ ) plays<br />
a vital role during the pearlite transformation. In the absence <strong>of</strong> experimental data<br />
for interlamellar spacing, it becomes imperative to know the interfacial energy in<br />
order to predict the growth rate <strong>of</strong> pearlite. Zener [6] has shown that the pearlite<br />
growth is maximum when the interfacial energy <strong>of</strong> ferrite-cementite interfaces is half<br />
<strong>of</strong> the total free energy available for transformation assuming diffusion–controlled<br />
growth. Kramer et al. deduced the σ αθ using Zener’s free energy <strong>and</strong> spacing data<br />
to be 2.8 J m −2 . They calculated the energy <strong>of</strong> ferrite-cementite interfaces using a<br />
calorimetric method [77]. Interfacial enthalpy <strong>of</strong> pearlite-austenite was measured as<br />
59
3.4 Model Formulation: Mixed Diffusion-Controlled Growth<br />
(a) (b)<br />
(c) (d)<br />
(e)<br />
Figure 3.7: (a) Variation in the growth rate as a function <strong>of</strong> the normalised interlamellar<br />
spacing.<br />
60
3.4 Model Formulation: Mixed Diffusion-Controlled Growth<br />
(a) (b)<br />
(c) (d)<br />
(e) (f)<br />
Figure 3.8: (a) Variation in the entropy production rate as a function <strong>of</strong> the normalised<br />
interlamellar spacing. Comparison <strong>of</strong> maximum growth rate <strong>and</strong> entropy<br />
production rate at 900 K is shown in Fig. 3.8 (f).<br />
61
3.4 Model Formulation: Mixed Diffusion-Controlled Growth<br />
Table 3.2: Published values <strong>of</strong> the ferrite–cementite interfacial energy per unit area.<br />
Reference Temperature Method σ<br />
K Jm −2<br />
[87] 861 coarsening rate <strong>and</strong> data fitting 0.56<br />
[88] 903-963 coarsening rate <strong>and</strong> data fitting 0.248-0.417<br />
[77] 1000 interfacial enthalpy measurement 0.7±0.3<br />
[89] 973 dihedral angle 0.52 ±0.13<br />
[90] - atomistic simulation 0.615<br />
[91] - interfacial enthalpy measurement 0.5 ± 0.36<br />
a function <strong>of</strong> spacings <strong>and</strong> the entropy value for the interface was assumed as (6.6 ×<br />
10 −4 Jm −2 K −1 ) in order to compute the interfacial energy. The value <strong>of</strong> interfacial<br />
entropy for ferrite-cementite interfaces was assumed based on those measured for gold<br />
(0.5×10 −3 Jm −2 K −1 )[85] <strong>and</strong> silver 1×10 −3 Jm −2 K −1 [86] determined from surface<br />
tension measurements. The corresponding interfacial free energy was estimated to<br />
be 0.7 ± 0.3Jm −2 at 727 ◦ C.<br />
Das et al. [87] <strong>and</strong> Deb et al. [88] calculated the ferrite-cementite interfacial en-<br />
ergy for coarsening <strong>of</strong> cementite particles in ferrite matrix in steel. The σ αθ is ob-<br />
tained from the coarsening rate constant, which is determined by fitting experimental<br />
growth rate data. It is worth noting here that these data are for a different morphol-<br />
ogy (spherical) <strong>of</strong> ferrite-cementite interface which is lesser than in case <strong>of</strong> lamellar<br />
pearlite. Martin <strong>and</strong> Sellars calculated the interfacial energy for lenticular cementite<br />
precipitates on the ferrite grain boundaries based on dihedral angle measurements<br />
<strong>and</strong> reported a value <strong>of</strong> 0.52 ±0.13 Jm −2 . Ruda et al. computed the ferrite-cementite<br />
interfacial energy in Fe-C alloy using atomistic simulations <strong>and</strong> reported the same<br />
to be 0.615 J m −2 . Although there was no mention about the temperature at which<br />
this value was reported, it can be assumed to be the same at 0 K as is normally the<br />
case in all the first principle calculations. Independent, published measurements <strong>of</strong><br />
σ αθ are listed in Table 3.2.<br />
62
3.4 Model Formulation: Mixed Diffusion-Controlled Growth<br />
In the absence <strong>of</strong> any reliable data on the interfacial energy, it is possible to derive<br />
from the kinetic data on pearlite growth, the interfacial energy relating cementite<br />
<strong>and</strong> ferrite [57].<br />
σ αθ = 1<br />
2 Sc ∆G ≈ Sc ∆T ∆H<br />
2 Te<br />
(3.18)<br />
where the approximation on the right h<strong>and</strong> side is based on the assumption that<br />
the entropy <strong>of</strong> transformation in independent <strong>of</strong> temperature [25, 46, 78]. This ap-<br />
proximation has been avoided by calculating both the enthalpy <strong>and</strong> entropy changes<br />
(Table 3.3) using MTDATA [76], Fig. 3.9. Values <strong>of</strong> Sc can be calculated using mea-<br />
sured spacings from Brown [13] <strong>and</strong> the entropy production calculations illustrated<br />
in Fig. 3.8. The interfacial energy derived in this way is illustrated as a function<br />
<strong>of</strong> temperature in Fig. 3.10. The interfacial energy values calculated here vary from<br />
those <strong>of</strong> Hashiguchi <strong>and</strong> Kirkaldy [57], though the spacing <strong>and</strong> velocity data are in<br />
both cases from the same experimental measurements [58]. This difference may be<br />
attributed to two factors:<br />
(i) The σ calculated [57] is based on the assumption that the entropy change during<br />
the pearlite transformation is independent <strong>of</strong> temperature, whereas it is shown<br />
to be a function <strong>of</strong> temperature in the present work.<br />
(ii) The computation <strong>of</strong> S/Sc based on the maximum entropy production rate was<br />
the range 2.18–2.4 [57], whereas in the present work it has been shown graphi-<br />
cally that this ratio lies in the range <strong>of</strong> 2.03–2.17 for the temperatures studied.<br />
This is attributed to the different growth equations used in the two studies.<br />
Fig. 3.10 compares the values <strong>of</strong> interfacial energy derived from pearlite growth<br />
rate measurements with the independently measured values. The discrepancies are<br />
large for the lower transformation temperatures, relative to the data based on coars-<br />
ening reactions <strong>and</strong> dihedral angle measurements. These are both techniques which<br />
are kinetically slow; it is possible therefore that the measured values are influenced<br />
by the segregation <strong>of</strong> solutes to the interface, which would lead to a reduction in<br />
energy. In contrast, the cementite–ferrite interfaces in pearlite are created fresh as<br />
63
3.4 Model Formulation: Mixed Diffusion-Controlled Growth<br />
Figure 3.9: Free energy, enthalpy <strong>and</strong> entropy change as a function <strong>of</strong> temperature<br />
for a Fe-0.8C wt% steel.<br />
a consequence <strong>of</strong> transformation. Entropy requires that the extent <strong>of</strong> segregation<br />
should be reduced at high temperatures. One further difficulty is that the diffusivity<br />
DB is likely to increase with interfacial energy since a high value <strong>of</strong> the latter implies<br />
a less coherent interface. We are not able to account for this effect given the absence<br />
<strong>of</strong> relevant grain boundary diffusion data.<br />
The growth rate determined using the mixed–diffusion controlled growth <strong>of</strong> pearlite<br />
described here gives a reasonable match with those predicted experimentally. Al-<br />
though the growth rate is calculated based on fitting the experimental data, the<br />
value <strong>of</strong> activation energy obtained is realistic, since it lies between the activation<br />
energy for volume diffusion in both ferrite <strong>and</strong> austenite. This approach proves to be<br />
a useful one, especially due to the lack <strong>of</strong> boundary diffusion data <strong>of</strong> carbon <strong>and</strong> also<br />
the segregation coefficient <strong>of</strong> the solute at the γ/α <strong>and</strong> γ/θ phase boundary. The<br />
match with experimental data is better when compared with prior work, (Fig. 3.11)<br />
<strong>of</strong> Puls <strong>and</strong> Kirkaldy [47] who had assumed the flux only through the austenite alone.<br />
Their predicted growth rates were lower than those measured experimentally by a<br />
64
3.4 Model Formulation: Mixed Diffusion-Controlled Growth<br />
Figure 3.10: Comparison <strong>of</strong> calculated ferrite-cementite interfacial energy values <strong>and</strong><br />
those reported in previous work by Hashiguchi <strong>and</strong> Kirkaldy [57].<br />
Table 3.3: Calculated values <strong>of</strong> the ferrite–cementite interfacial energy per unit area<br />
based on MTDATA (TCFE database)<br />
Temperature G γ G α+θ ∆G S Sc σ αθ<br />
K J J Jm −3 m m Jm −2<br />
920 -6.56×10 7 -6.64×10 7 -5.61×10 7 7.8×10 −8 3.83×10 −8 1.07<br />
928 -6.66×10 7 -6.73×10 7 -4.98×10 7 8.3×10 −8 4.07×10 −8 1.01<br />
940 -6.81×10 7 -6.87×10 7 -4.07×10 7 9.7×10 −8 4.75×10 −8 0.97<br />
948 -6.91×10 7 -6.96×10 7 -3.48×10 7 1.19×10 −7 5.83×10 −8 1.01<br />
958 -7.04×10 7 -7.08×10 7 -2.76×10 7 1.54×10 −7 7.52×10 −8 1.04<br />
976 -7.26×10 7 -7.28×10 7 -1.59×10 7 2.61×10 −7 1.25×10 −7 0.99<br />
985 -7.39×10 7 -7.40×10 7 -9.30×10 6 3.84×10 −7 1.80×10 −7 0.84<br />
65
3.4 Model Formulation: Mixed Diffusion-Controlled Growth<br />
factor <strong>of</strong> 2-4. It was suggested that the effective volume diffusion coefficient (which<br />
is the weighted average diffusion coefficient) <strong>of</strong> carbon in austenite is independent<br />
<strong>of</strong> temperature <strong>and</strong> hence trying to extract the activation energy from Fe-C pearlite<br />
data would be fruitless. However, our calculation shows that the weighted average<br />
diffusion coefficient, D does vary quite substantially with temperature <strong>and</strong> the same<br />
has been shown in Table 3.1.<br />
The results were compared with those <strong>of</strong> Hashiguchi <strong>and</strong> Kirkaldy [57] who also<br />
assumed mass transport through the volume <strong>and</strong> pearlite-austenite phase boundary.<br />
It appears that they used the experimental data <strong>of</strong> Brown <strong>and</strong> Ridley [58] <strong>and</strong> Frye<br />
et al. [12] which were determined using a maximum nodule radius method, which<br />
has a limitation that it measures the maximum rather than an average growth rate.<br />
Hence it is difficult to apply it to rapidly transforming specimens <strong>and</strong> cannot be<br />
used once there is a significant impingement <strong>of</strong> the pearlite colonies. When the<br />
approximated model [57] was fitted to experimental data, rather large σ αθ interfacial<br />
energies were obtained, <strong>and</strong> the activation energy for the boundary diffusion <strong>of</strong> carbon<br />
was deduced to be in the range <strong>of</strong> 159920–169925 J mol −1 , which surprisingly was<br />
greater than for volume diffusion in both ferrite <strong>and</strong> austenite. It is noteworthy that<br />
Sundquist [15] reported an even larger activation energy for the boundary diffusion <strong>of</strong><br />
carbon, commenting that the expected value should be much smaller; he attributed<br />
the discrepancy to a possible role <strong>of</strong> substitutional solute impurities.<br />
Fig. 3.12 compares the experimental growth rates <strong>of</strong> pearlite obtained by various<br />
researchers for nearly eutectoid Fe-C alloys. However there is an important distinc-<br />
tion with respect to the methods used by them. Frye et al. [12], Hull [92] <strong>and</strong> Brown<br />
<strong>and</strong> Ridley [58] measured the growth rates <strong>of</strong> pearlite using the maximum size <strong>of</strong> the<br />
pearlite colony. However Brown <strong>and</strong> Ridley also measured the same using two other<br />
methods namely, the Cahn-Hagel method [27] <strong>and</strong> another based on the size distri-<br />
bution <strong>of</strong> pearlite nodules. The latter seems to be a more comprehensive method<br />
since it is based on the size distribution rather than on the size <strong>of</strong> the largest colony.<br />
In order to calculate the pearlite growth rate for Fe-C alloy in the absence <strong>of</strong><br />
interlamellar spacing data, one must have a knowledge <strong>of</strong> the interfacial energy per<br />
66
3.4 Model Formulation: Mixed Diffusion-Controlled Growth<br />
Figure 3.11: Temperature versus pearlite growth rate plot for Fe-0.8C wt% steel.<br />
Solid lines are calculated. The data from [58] based on particle size analysis are<br />
regarded as the most reliable for reasons discussed in the text.<br />
67
3.4 Model Formulation: Mixed Diffusion-Controlled Growth<br />
Figure 3.12: Comparison <strong>of</strong> experimental pearlite growth rate measured by various<br />
researchers [12, 58, 92].<br />
68
3.4 Model Formulation: Mixed Diffusion-Controlled Growth<br />
unit area between ferrite <strong>and</strong> cementite, σ αθ . Since this is shown to be a variable<br />
quantity with respect to temperature (Fig. 3.10), it is appropriate to calculate the<br />
growth rate for the minimum (0.84 J m −2 ), maximum (1.07 J m −2 ) <strong>and</strong> average value<br />
(0.99 J m −2 )<strong>of</strong>σ αθ <strong>and</strong> determine the sensitivity <strong>of</strong> growth rate to these changes.<br />
Fig. 3.13 shows the effect <strong>of</strong> σ αθ on the growth rate for Fe-0.8C wt% steel. The<br />
average value <strong>of</strong> σ αθ gives a good match with the experimental data <strong>of</strong> Brown <strong>and</strong><br />
Ridley based on the particle size method. The difference between the growth rates<br />
calculated using the maximum σ αθ do not vary significantly as compared to the<br />
average value, however it tends to give a better match with the experimental data<br />
at higher temperatures.<br />
Figure 3.13: Sensitivity <strong>of</strong> the growth rate calculations to the α/θ interfacial energy.<br />
The points represent the experimental data <strong>and</strong> the red dash-dot line represents the<br />
change in growth rate as a function <strong>of</strong> temperature dependant interfacial energy.<br />
69
3.5 Conclusions<br />
3.5 Conclusions<br />
A simplified theory has been proposed which combines the contributions from volume<br />
<strong>and</strong> boundary diffusivities, to represent the pearlite growth mechanism in Fe–C steels.<br />
The match with experimental data is better when compared with prior work, in<br />
spite <strong>of</strong> the fact that considerations <strong>of</strong> equilibrium at junctions between interfaces<br />
are ab<strong>and</strong>oned. As might be expected, the flux through the boundary between<br />
pearlite <strong>and</strong> austenite dominates the transport <strong>of</strong> carbon at all but the highest <strong>of</strong><br />
transformation temperatures. The theory for the first time leads to a realistic value<br />
for the activation energy for the grain boundary diffusion <strong>of</strong> carbon, less than that<br />
for volume diffusion in austenite <strong>and</strong> greater than for volume diffusion in ferrite.<br />
The maximum entropy <strong>and</strong> growth rate criteria have been derived in the context<br />
<strong>of</strong> this mixed-mode diffusion theory, with the result that S/Sc is not constant but<br />
becomes a function <strong>of</strong> the transformation temperature. The ferrite–cementite inter-<br />
facial energy has been deduced assuming that the pearlite interlamellar spacing is<br />
determined by the need to maximise the entropy production rate. The energy is lower<br />
than determined in previous work, but still much higher than reported in independent<br />
experiments, possibly because the interfaces created during pearlite transformation<br />
are fresh. It has been shown that in the absence <strong>of</strong> interlamellar spacing data, it is<br />
possible to calculate the critical <strong>and</strong> the nominal spacing based on the average energy<br />
<strong>of</strong> ferrite-cementite interfaces over a range <strong>of</strong> temperatures, although at higher tem-<br />
peratures, the maximum energy value would give a better prediction <strong>of</strong> the pearlite<br />
growth rate.<br />
In is argued that this simplified theory avoids many <strong>of</strong> the approximations re-<br />
quired to implement a more complex model in which the shape <strong>of</strong> the transformation<br />
front is determined by equilibrium at interfacial junctions.<br />
70
Chapter 4<br />
Influence <strong>of</strong> Diffusion in Ferrite on<br />
Pearlite Growth<br />
4.1 Introduction<br />
The theories discussed in the previous chapter for the mechanism <strong>of</strong> growth <strong>of</strong><br />
pearlite, deal with either the diffusion <strong>of</strong> the solute through the austenite or the<br />
pearlite–austenite phase boundary in isolation or simultaneously through both <strong>of</strong><br />
these. The mixed diffusion–controlled growth <strong>of</strong> pearlite has been shown to be a<br />
reliable theory to explain the experimentally measured growth rates [64]. Nakajima<br />
et al. [55] used a phase field model to treat the possibility that a flux in the ferrite,<br />
behind the pearlite–austenite transformation front, also contributes to the growth<br />
rate <strong>of</strong> pearlite. However they neglected the flux within the transformation front<br />
itself. This chapter describes the analytical treatment <strong>of</strong> growth <strong>of</strong> pearlite which<br />
considers the contribution <strong>of</strong> all three <strong>of</strong> the fluxes, that through the austenite, the<br />
transformation front <strong>and</strong> within the ferrite.<br />
71
4.2 Diffusion in Ferrite<br />
4.2 Diffusion in Ferrite<br />
The diffusivity <strong>of</strong> carbon in ferrite is about two orders <strong>of</strong> magnitude higher than that<br />
in the austenite <strong>and</strong> hence one may be tempted to consider it to be a dominant factor<br />
to explain the growth rates observed experimentally. Cahn <strong>and</strong> Hagel examined the<br />
diffusion in ferrite alongside that in austenite, but they showed that the flux through<br />
the ferrite would still be lower on account <strong>of</strong> the smaller concentration gradient in<br />
ferrite despite the higher diffusivity [27]. It was suggested that the evidence <strong>of</strong> carbon<br />
diffusion through the ferrite can be verified experimentally depending on whether or<br />
not the carbide lamellae taper behind the transformation front. But they did not<br />
observe such behaviour <strong>and</strong> hence rejected the idea.<br />
Nakajima et al. assumed that the flux through ferrite plays a key role in determin-<br />
ing the pearlite transformation along with that in the austenite [55]. They developed<br />
a multi-phase field model which accounted for simultaneous diffusion through the fer-<br />
rite <strong>and</strong> austenite. Since the diffusivity <strong>of</strong> carbon in ferrite is higher than that in<br />
austenite, it was argued that this would lead to a better agreement with the ex-<br />
perimental growth rates. The interfacial energy <strong>of</strong> all the interfaces involved was<br />
assumed to be 1.0 J m −2 , but the basis for selection was not clearly stated. The<br />
mobility <strong>of</strong> α/θ interface was assumed to be three orders <strong>of</strong> magnitude lower than<br />
the two other interfaces due to the instabilites arising out <strong>of</strong> the large composition<br />
differences involved; this is an artefact <strong>of</strong> the phase field model. The diffusion coef-<br />
ficients <strong>of</strong> carbon in austenite <strong>and</strong> ferrite were taken from the h<strong>and</strong>book [93]. The<br />
results <strong>of</strong> the phase field calculations show that the pearlite growth velocities for<br />
diffusion simultaneously through ferrite <strong>and</strong> austenite are higher than that through<br />
the austenite alone by about 4 times. It was suggested that the coupled diffusion<br />
through the ferrite <strong>and</strong> austenite gave a better agreement with the experimental data,<br />
although it did not fully explain them. Their model also showed a tapered pr<strong>of</strong>ile<br />
<strong>of</strong> cementite with gradual increase in the thickness behind the transformation front,<br />
Fig. 4.1, an outcome <strong>of</strong> the diffusion in ferrite. The figure also shows the difference<br />
in concentration pr<strong>of</strong>ile <strong>of</strong> carbon at the transformation front in both the cases. For<br />
72
4.3 Model Formulation<br />
the case <strong>of</strong> diffusion through austenite <strong>and</strong> ferrite, the concentration <strong>of</strong> carbon at the<br />
transformation interface is lower than in case <strong>of</strong> its diffusion in austenite, attributed<br />
to some <strong>of</strong> the carbon being lost via diffusion in ferrite.<br />
Figure 4.1: Comparison <strong>of</strong> carbon concentration pr<strong>of</strong>ile during pearlite growth for<br />
different diffusion paths. ∆T = 30 K <strong>and</strong> S =0.3 µm. Reproduced from Nakajima<br />
et al. [55] with permission from the journal.<br />
4.3 Model Formulation<br />
In order to account for the simultaneous diffusion in ferrite, austenite <strong>and</strong> the trans-<br />
formation front, an analytical treatment is presented here which combines the fluxes<br />
through all <strong>of</strong> these. For the growth velocity, v, the material balance at the trans-<br />
formation front is given by:<br />
vSα (¯c − c<br />
Vm<br />
αγ )= vSθ<br />
(c<br />
Vm<br />
θγ − ¯c) = vSαSθ (c<br />
SVm<br />
θγ − c αγ ) (4.1)<br />
73
4.3 Model Formulation<br />
where ¯c is the average concentration <strong>of</strong> carbon in austenite. The flux through the<br />
volume <strong>of</strong> austenite as described in the chapter 3 can be written as:<br />
JV = − Aα<br />
Vm<br />
D dc<br />
dx<br />
= DbSα<br />
Vm<br />
(c γα − c γθ )<br />
S α /2<br />
(4.2)<br />
where Vm is the molar volume <strong>of</strong> austenite (7.1×10 −6 m 3 mol −1 ) <strong>and</strong> to a good<br />
approximation assumed to be the same for all the phases involved. A α is the cross<br />
sectional area <strong>of</strong> the interface, which for a unit depth into the diagram (Fig. 4.2)<br />
is equal to S α , <strong>and</strong> the diffusion distance parallel to the interface, from the ferrite<br />
to the cementite is on average S α /2. Similar equations can be written for the flux<br />
through the boundary <strong>and</strong> the ferrite. Hence the total flux <strong>of</strong> solute arriving at the<br />
transformation front is a combination <strong>of</strong> all <strong>of</strong> these. Combining equation 4.1 along<br />
with other diffusion fluxes leads to:<br />
Figure 4.2: Geometry <strong>of</strong> pearlite colony. The arrows indicate the diffusion flux<br />
through austenite, ferrite <strong>and</strong> the phase boundary.<br />
74
vS α S θ<br />
S<br />
(c θγ − c αγ )=2D (c γα − c γθ )+ 12 DB δ(c γα − c γθ )<br />
S<br />
4.3 Model Formulation<br />
− 2 Dα(c αγ − c αθ )<br />
x<br />
(4.3)<br />
where the term on the extreme right represents the flux within the ferrite, towards the<br />
cementite, behind the transformation front. c αγ <strong>and</strong> c αθ represent the concentrations<br />
at the respective interfaces, which may not be necessarily given by equilibrium, since<br />
as will be discussed latter, the thickening <strong>of</strong> cementite is interface–controlled <strong>and</strong><br />
not controlled by diffusion. Dα is the diffusivity <strong>of</strong> carbon in ferrite. The average<br />
diffusion distance from the ferrite–austenite, to its interface with the cementite is<br />
written 0.5 xS α , where x is some factor, the calculation <strong>of</strong> which will be discussed<br />
at a latter stage. S α <strong>and</strong> S θ have been determined by applying Lever rule <strong>and</strong> the<br />
interlamellar spacings, S are calculated using regression equation obtained from the<br />
measured data <strong>of</strong> Brown <strong>and</strong> Ridley [13].<br />
The sign <strong>of</strong> this flux is different from the other two terms because it occurs in<br />
the product phase leading to a net reduction in the other two fluxes. As a result <strong>of</strong><br />
flux through the ferrite, the effective concentration <strong>of</strong> carbon at the transformation<br />
front is reduced <strong>and</strong> hence the thickness <strong>of</strong> cementite at or near the transformation<br />
front will be lower than that far away from it. In order to work out the modified<br />
thicknesses <strong>of</strong> cementite <strong>and</strong> hence the ferrite lamellae as a result <strong>of</strong> diffusion flux<br />
in ferrite, a new factor f (f = ∆c × D) is evaluated for ferrite as well as austenite.<br />
The ∆c <strong>and</strong> D represents the concentration difference <strong>and</strong> diffusivity in ferrite <strong>and</strong><br />
austenite. Since f α is greater than f γ , the thickness <strong>of</strong> cementite is reduced by a<br />
proportionate amount.<br />
For the diffusion–controlled growth <strong>of</strong> cementite, the rate at which carbon is<br />
incorporated in the growing cementite must equal the diffusion flux in ferrite:<br />
v θ D(c θα<br />
e − c αθ<br />
e )=Dα ∇C α<br />
(4.4)<br />
v θ D is the growth rate <strong>of</strong> cementite for diffusion–controlled transformation <strong>and</strong> ∇Cα is<br />
the concentration gradient in ferrite. Dα is determined based on a model by McLellan<br />
et al. [94] <strong>and</strong> calculated using the MAP subroutine [95]. Fig. 4.3 represents a<br />
75
4.3 Model Formulation<br />
schematic Fe-C phase diagram <strong>and</strong> depicts the various concentration terms under<br />
discussion.<br />
Figure 4.3: Schematic <strong>of</strong> Fe-C phase diagram.<br />
It is possible that the carbon flux in ferrite calculated in this manner may or may<br />
not be commensurate to what the growing cementite can absorb. In order to evaluate<br />
the thickening rate <strong>of</strong> cementite, we calculate the migration rate <strong>of</strong> ferrite-cementite<br />
interface using the interface–controlled theory. The amount <strong>of</strong> free energy dissipated<br />
at the interface is proportional to the velocity <strong>of</strong> the interface <strong>and</strong> is given by:<br />
∆G αθ<br />
I<br />
Vm<br />
= vθ I<br />
M αθ<br />
(4.5)<br />
where G αθ<br />
I is driving force for cementite growth <strong>and</strong> is calculated using the MTDATA<br />
76
4.3 Model Formulation<br />
<strong>and</strong> TCFE database. M αθ is the mobility <strong>of</strong> the ferrite-cementite interface, <strong>and</strong> is<br />
taken from the work <strong>of</strong> Nakajima et al. <strong>and</strong> although the mobility should change<br />
with temperature, in the present calculation, due to absence <strong>of</strong> an accurate data, it is<br />
taken as constant (5×10 −15 m 4 Js −1 ). The velocity <strong>of</strong> the ferrite-cementite interface<br />
is shown in Fig. 4.4 <strong>and</strong> it appears to be about three orders <strong>of</strong> magnitude lower<br />
than if it were to be calculated based on diffusion–controlled growth. This leads<br />
to the conclusion that the rate <strong>of</strong> thickening <strong>of</strong> cementite is an interface <strong>and</strong> not<br />
a diffusion–controlled process. Using the mobility equation 4.5, the actual gradient<br />
Figure 4.4: Comparison <strong>of</strong> thickening rates <strong>of</strong> cementite using interface <strong>and</strong> diffusion–<br />
controlled growth mechanisms.<br />
within the ferrite is given by a mass balance, that the flux must equal the rate at<br />
which the cementite absorbs carbon as it grows:<br />
Dα (c αγ − c αθ )<br />
0.5xS α<br />
77<br />
= v θ D(c θα<br />
e − c αθ<br />
e ) (4.6)
4.4 Conclusions<br />
ing the fluxes through ferrite, austenite <strong>and</strong> the phase boundary. Fig. 4.6 compares<br />
the growth rates <strong>of</strong> the three flux model against that involving only boundary <strong>and</strong><br />
volume diffusion in the austenite. The results indicate that inclusion <strong>of</strong> the flux<br />
through the ferrite would indeed lead to an increase in the growth rate, but the<br />
model (including the austenite <strong>and</strong> phase boundary) without the flux within the<br />
ferrite actually represents the experimental data rather well.<br />
Figure 4.5: Comparison <strong>of</strong> pearlite growth rates. The points represent the phase field<br />
calculations (Nakajima et al.) <strong>and</strong> the lines are calculated. Red line indicates the<br />
growth rate based on analytical model [55] <strong>and</strong> black line indicates those calculated<br />
in the present work.<br />
4.4 Conclusions<br />
The pearlite growth rates have been calculated in a Fe-0.8C wt% steel assuming the<br />
diffusion flux through the austenite, ferrite <strong>and</strong> the phase boundary. Inclusion <strong>of</strong><br />
flux through the ferrite does lead to an increase in the growth rate as compared to<br />
79
4.4 Conclusions<br />
Figure 4.6: Calculated growth rates <strong>of</strong> pearlite based on phase field calculations with<br />
those in the present work assuming the 2 (boundary <strong>and</strong> austenite) <strong>and</strong> 3 (austenite,<br />
boundary <strong>and</strong> ferrite) fluxes. The points represent the experimental data.<br />
80
4.4 Conclusions<br />
that through austenite alone, although the agreement with the experimental data is<br />
still not good. Rather the match between the model based on the diffusion through<br />
the austenite <strong>and</strong> the phase boundary is much better when compared with the mea-<br />
sured growth rates. The greatest uncertainty in the three–flux model arises in the<br />
mobility <strong>of</strong> the cementite–ferrite interface for which there are no experimental data.<br />
It was also pointed out earlier that evidence for the thickening <strong>of</strong> cementite behind<br />
the transformation front is weak. To summarise, it does not at the moment seem<br />
necessary or justified to include any flux within the ferrite to explain pearlite growth<br />
data.<br />
81
Chapter 5<br />
Pearlite Growth in Ternary alloys<br />
5.1 Introduction<br />
In the previous chapters, a method for calculating the growth rate <strong>of</strong> pearlite in<br />
a binary Fe–C system was established [64], without making a priori assumptions<br />
about whether the process should be controlled by the diffusion <strong>of</strong> carbon in the<br />
bulk <strong>of</strong> the parent phase, or short–circuited by diffusion in the transformation front,<br />
or whether diffusion through the ferrite behind the transformation front plays a<br />
role. The method permits all processes to occur simultaneously within an analytical<br />
framework with the extent <strong>of</strong> contribution from a particular mechanism depending<br />
naturally on circumstances such as the supercooling below the equilibrium temper-<br />
ature <strong>and</strong> the pertinent diffusion coefficients.<br />
The purpose <strong>of</strong> this chapter is to extend this treatment to ternary steels desig-<br />
nated Fe–C–X, where ‘X’ st<strong>and</strong>s for a substitutional solute such as manganese. The<br />
complication here is that the diffusivity <strong>of</strong> a substitutional solute is far smaller than<br />
that <strong>of</strong> interstitial carbon. It then becomes difficult to discover conditions in which<br />
all solutes can maintain local equilibrium at the transformation front. The problem<br />
was elegantly solved some time ago in the case <strong>of</strong> the growth <strong>of</strong> allotriomorphic ferrite<br />
from austenite [59–62]. In essence, there is an additional degree <strong>of</strong> freedom afforded<br />
by the presence <strong>of</strong> the second solute which permits equilibrium between two phases<br />
82
5.2 Partitioning <strong>of</strong> Substitutional Solutes<br />
to exist for a range <strong>of</strong> compositions, rather than being defined uniquely for a binary<br />
alloy. This means that it is possible to pick interface compositions which maintain<br />
local equilibrium <strong>and</strong> yet allow the fluxes <strong>of</strong> the fast <strong>and</strong> slow diffusing species to<br />
keep pace.<br />
The situation for pearlite is further complicated by the fact that two phases, fer-<br />
rite <strong>and</strong> cementite, grow in a coupled manner at a common front with the austenite.<br />
It is even possible that local equilibrium, although a comforting <strong>and</strong> well–defined<br />
concept, is not in fact maintained during growth. It is relevant therefore to begin<br />
with a short assessment <strong>of</strong> the experimental data that exist on the partitioning <strong>of</strong><br />
solutes as growth occurs.<br />
5.2 Partitioning <strong>of</strong> Substitutional Solutes<br />
Partitioning describes the redistribution <strong>of</strong> solute between the phases participating<br />
in the transformation process. Early studies in the context <strong>of</strong> pearlite in Fe–C–Mn<br />
<strong>and</strong> Fe–C–Cr indicated a so–called no–partition temperature below which the sub-<br />
stitutional solute does not redistribute <strong>and</strong> pearlite growth is limited by the diffusion<br />
<strong>of</strong> carbon [17, 18]. It was argued that above this temperature, it is the diffusion <strong>of</strong> X<br />
through the transformation interface that determined the growth rate. Fig. 5.1 shows<br />
the partitioning data obtained by Razik <strong>and</strong> co-workers for Mn <strong>and</strong> Cr containing<br />
steels which depicts a transition from partitioning to zero–partitioning <strong>of</strong> these ele-<br />
ments. Sharma et al. [70] calculated the pearlite growth rates for Cr containing steels<br />
using a similar argument, but they too could not justify the experimentally observed<br />
growth rates. However, neither <strong>of</strong> these scenarios was able to correctly estimate the<br />
growth rate at low temperatures. The equilibrium partition coefficients were cal-<br />
culated for steels containing Mn <strong>and</strong> Cr using MTDATA <strong>and</strong> TCFE database <strong>and</strong><br />
compared with those obtained by Razik et al. for steel containing Mn (Fig. 5.2). The<br />
coefficient for Cr was much larger than that for Mn owing to its higher tendency to<br />
segregate to cementite.<br />
Picklesimer [19] observed partitioning <strong>of</strong> Mn to cementite based on the chemi-<br />
cal analysis <strong>of</strong> the extracted carbides for a 1.0Mn wt% eutectoid steel above 640 ◦ C.<br />
83
(a)<br />
(b)<br />
5.2 Partitioning <strong>of</strong> Substitutional Solutes<br />
Figure 5.1: Partition coefficient <strong>of</strong> Mn <strong>and</strong> Cr in (a) Fe-C-Mn [17] <strong>and</strong> (b) Fe-C-<br />
1.29Cr wt% [18] steels as a function <strong>of</strong> reciprocal temperature.<br />
84
5.2 Partitioning <strong>of</strong> Substitutional Solutes<br />
Figure 5.2: Equilibrium partition coefficient calculated using MTDATA as a function<br />
<strong>of</strong> inverse <strong>of</strong> temperature.<br />
These data involved a contribution <strong>of</strong> Mn partitioning from ferrite to cementite be-<br />
hind the growth front (the steel was held at the transformation temperature for 24<br />
hours) <strong>and</strong> hence it was difficult to exactly determine the no-partitioning tempera-<br />
ture.<br />
Al-Salman et al. [66] found that both chromium <strong>and</strong> manganese partitioned into<br />
cementite at the growth front in a Fe–Cr–Mn–C alloy down to a transformation<br />
temperature <strong>of</strong> 600 ◦ C, but were unable to identify a no–partition temperature. Ex-<br />
periments conducted with better resolution on Fe–C–Cr revealed that chromium in<br />
fact continues to partition in this manner to temperatures as low as 550 ◦ C[96], with<br />
the extent <strong>of</strong> partitioning increasing with temperature; once again, a no–partitioning<br />
temperature could not be identified. It was demonstrated that the rate <strong>of</strong> growth<br />
at low temperatures could be explained equally well by carbon volume diffusion or<br />
interfacial diffusion <strong>of</strong> chromium; there is <strong>of</strong> course, no logical reason to assume that<br />
the flux <strong>of</strong> carbon should be confined to the volume without a contribution through<br />
the interface. Hutchinson et al. studied the partitioning behaviour <strong>of</strong> steels contain-<br />
ing 3.5Mn wt% <strong>and</strong> observed that it partitioned significantly during transformation<br />
85
5.3 Local Equilibrium in Ternary Systems<br />
case the sluggish diffusion <strong>of</strong> Mn is compensated for by selecting a tie–line which<br />
maximises its gradient, <strong>and</strong> in the latter case the tie–line is such that the gradient<br />
<strong>of</strong> carbon is minimised, thus allowing the two solutes to keep pace with the single<br />
moving interface.<br />
For simplicity, the scenarios for the growth <strong>of</strong> a single phase, ferrite, from austen-<br />
ite is illustrated <strong>and</strong> as will be seen later, even this simple presentation can clarify the<br />
mechanism <strong>of</strong> pearlite growth. The case where the gradient <strong>of</strong> carbon is diminished<br />
is illustrated in Fig. 5.3a, where the austenite is supercooled into the two–phase field<br />
near the α + γ/γ boundary. This necessitates the partitioning <strong>and</strong> hence long range<br />
diffusion <strong>of</strong> manganese, so the mode is designated as ‘partitioning local equilibrium’<br />
(P–LE). In contrast, a large supersaturation, whence the austenite is supercooled to<br />
a location in the two–phase field close to the α + γ/α boundary leads to the case<br />
where the Mn concentration in α is similar to that in the alloy, or the ‘negligible par-<br />
titioning local equilibrium’ (NP–LE) mode (Fig. 5.3b). Note that both cases involve<br />
local equilibrium at the interface <strong>and</strong> are exclusive; Fig. 5.3c shows the domains <strong>of</strong><br />
the two–phase field within which each <strong>of</strong> the mode operates. A simple examina-<br />
tion <strong>of</strong> the location <strong>of</strong> the alloy within the α + γ phase field therefore can establish<br />
whether or not Mn will partition during ferrite growth or whether growth will oc-<br />
cur with negligible partitioning <strong>of</strong> the substitutional solute. The important point to<br />
recognise is that if partitioning must occur during ferrite growth then it necessarily<br />
means that pearlite growth must also involve partitioning since the ferrite is one <strong>of</strong><br />
the components <strong>of</strong> pearlite.<br />
This discussion <strong>of</strong> the growth <strong>of</strong> ferrite is well–established [62, 97] but it can be<br />
applied immediately to reach conclusions about pearlite, where two phases grow from<br />
austenite. It is necessary then to consider both the α + γ <strong>and</strong> θ + γ phase fields, <strong>and</strong><br />
two separate tie–lines must be chosen to fix the compositions at the α/γ <strong>and</strong> θ/γ<br />
interfaces, as illustrated in Fig. 5.3d. The case illustrated is for NP–LE <strong>and</strong> it is only<br />
possible for the alloy marked ‘A’ to transform in this manner because the situation<br />
illustrated corresponds to a high–supersaturation. It has been observed that growth<br />
with NP–LE is thermodynamically not possible for any <strong>of</strong> the experimental data<br />
[17, 18] reported for the growth <strong>of</strong> pearlite.<br />
87
(a) (b)<br />
(c) (d)<br />
5.3 Local Equilibrium in Ternary Systems<br />
Figure 5.3: (a–c) Growth <strong>of</strong> ferrite with local equilibrium at the interface. The tie–<br />
lines are illustrated in red. When the alloy (indicated by dot) in its austenitic state is<br />
quenched into the α+γ phase field, the supersaturation is small if the alloy falls close<br />
to the α + γ/γ phase boundary. (a) P–LE mode involving the long–range diffusion<br />
<strong>of</strong> manganese. (b) NP–LE mode with negligible partitioning <strong>of</strong> Mn. (c) Division <strong>of</strong><br />
the two–phase α + γ phase field into NP–LE <strong>and</strong> P–LE domains. For more details<br />
see [74]. (d) Schematic ternary isothermal section for the NP–LE condition satisfied<br />
for both cementite <strong>and</strong> ferrite during the growth <strong>of</strong> pearlite, because the point ‘A’<br />
falls under the red line which separates the NP–LE <strong>and</strong> P–LE domains for ferrite.<br />
88
5.4 Grain Boundary Diffusion<br />
5.3.1 Partitioning local–equilibrium in Fe-C-Mn<br />
The partitioning local–equilibrium case corresponds to one in which the activity <strong>of</strong><br />
carbon in the austenite ahead <strong>of</strong> the interface is almost uniform, thus allowing the<br />
flux <strong>of</strong> the slow diffusing manganese to keep pace. The activity <strong>of</strong> carbon in austenite<br />
for the alloy composition was calculated using MTDATA. The point <strong>of</strong> intersection<br />
<strong>of</strong> carbon iso-activity line with the phase boundaries <strong>of</strong> γ/γ +θ <strong>and</strong> γ/γ +α gives the<br />
interfacial compositions <strong>of</strong> Mn in austenite in equilibrium with ferrite <strong>and</strong> cementite.<br />
The tie-line corresponding to these points should then give the quantities c αγ<br />
Mn , cγα<br />
Mn ,<br />
c θγ<br />
Mn <strong>and</strong> cγθ<br />
Mn .<br />
It is found that the iso-activity line passing through the point Fe-0.8C-1.0Mn wt %<br />
never intersects the γ/γ + θ phase boundary, as has been observed in previous work<br />
(Fig. 5.4) for Fe–C–Mn hypo–eutectoid steels [71]. The strict P–LE condition is<br />
therefore impossible to achieve. The best that can be done in order to set c γθ<br />
Mn whilst<br />
at the same time ensuring that c γθ<br />
Mn < cMn
5.4 Grain Boundary Diffusion<br />
Figure 5.4: Fe-C-Mn phase diagram at 625 ◦ C with the alloy ‘A ’lying in the two<br />
phase region. Adapted from Huchinson et al. [71]<br />
90
(a) (b)<br />
(c) (d)<br />
(e)<br />
5.4 Grain Boundary Diffusion<br />
Figure 5.5: The case for partitioning local equilibrium transformation <strong>of</strong> Fe–0.8C–<br />
1Mn wt%, noting that strict P–LE is not possible since the carbon iso–activity line<br />
does not intersect the γ + θ/γ phase boundary. The alloy is indicated by the red dot<br />
<strong>and</strong> the red line divides the α + γ phase fields into the P–LE <strong>and</strong> NP–LE domains.<br />
91
5.4 Grain Boundary Diffusion<br />
Table 5.1: Grain boundary diffusivities in Fe from literature. Tm is the melting<br />
temperature.<br />
System δ D0 QB Ref.<br />
m 3 s −1 kJ mole −1<br />
Fe in γ-iron 0.77 ×10 −13 159 [101]<br />
Fe in γ or α-iron 5.4 ×10 −14 155 [44]<br />
Fe in γ-iron 9.7 ×10 −15 75.4Tm / K [102]<br />
Fe in γ-iron 9.44 ×10 −15 83.0Tm / K [99]<br />
Fe in γ-iron 1.5 ×10 −14 74.5Tm / K [100]<br />
diffusivity <strong>of</strong> the substitutional solutes due to the lack <strong>of</strong> experimental data associ-<br />
ated with them. Fridberg et al. [44] suggested that the grain boundary diffusivity<br />
<strong>of</strong> substitutional solutes like Mn, Cr, Ni etc. can be reasonably approximated to<br />
the boundary self–diffusivity <strong>of</strong> iron as their atomic size is closer to Fe. Kaur et al.<br />
[98] have shown that the diffusivities in case <strong>of</strong> volume self–diffusion <strong>of</strong> metals with<br />
same crystal structure at the melting temperature are identical, irrespective <strong>of</strong> the<br />
melting temperature difference between these. Brown <strong>and</strong> Ashby [99] <strong>and</strong> Gjostein<br />
[100] showed that these correlations hold good in case <strong>of</strong> grain boundary self-diffusion<br />
also. They further evaluated that the grain boundary diffusion coefficient DB, for<br />
all the metals would approach a value <strong>of</strong> about 1-3×10 −9 m 2 s −1 at the melting<br />
temperature. James <strong>and</strong> Leak [101] experimentally determined the grain boundary<br />
diffusivity <strong>of</strong> Fe in γ-iron with a radioactive tracer <strong>and</strong> using sectioning <strong>and</strong> residual<br />
activity technique. Table 5.1 summarises the activation energies calculated based on<br />
the data <strong>of</strong> various researchers <strong>and</strong> they were in the range <strong>of</strong> 134-159 kJ mol −1 with<br />
the pre-exponential terms being <strong>of</strong> the order <strong>of</strong> 10 −14 − 10 −15 m 3 s −1 .<br />
92
5.5 Pearlite Growth Rate in Fe-C-Mn Steels<br />
5.5 Pearlite Growth Rate in Fe-C-Mn Steels<br />
5.5.1 Assumptions<br />
It is assumed that when the transfer <strong>of</strong> atoms across the growth front is not rate<br />
limiting; for a diffusion–controlled reaction, the compositions at the interfaces can be<br />
estimated from the existence <strong>of</strong> local equilibrium. In such a case, the compositions<br />
are given by tie–lines <strong>of</strong> the equilibrium ternary phase diagram so that the chemical<br />
potentials (µ) <strong>of</strong> the species are locally uniform:<br />
µ γ<br />
Fe = µα Fe<br />
µ γ<br />
Fe = µθ Fe<br />
<strong>and</strong> µ γ<br />
C = µα C<br />
<strong>and</strong> µ γ<br />
C = µθ C<br />
<strong>and</strong> µ γ<br />
Mn = µα Mn<br />
<strong>and</strong> µ γ<br />
Mn = µθ Mn<br />
Since the kinetic theory for pearlite gives the growth rate as a function <strong>of</strong> inter-<br />
lamellar spacing rather than a unique velocity, it is assumed that the actual spacing<br />
adopted is the one which leads to maximisation <strong>of</strong> the entropy production rate [60].<br />
The preceding discussion based on experimental observations indicates that substi-<br />
tutional solutes partition during the growth <strong>of</strong> pearlite even at the lowest <strong>of</strong> temper-<br />
atures studied. Furthermore, none <strong>of</strong> the data are consistent with growth involving<br />
local equilibrium with negligible partitioning. In addition, only an approximation<br />
to the P–LE mode can apply if local equilibrium is to be maintained, since the iso–<br />
activity line for carbon does not in general intersect the γ/γ +θ phase boundary; it is<br />
necessary, therefore, to assume that the tie-line connecting cementite <strong>and</strong> austenite<br />
passes through the alloy composition.<br />
The growth rate <strong>of</strong> pearlite is then calculated based on the above set <strong>of</strong> assump-<br />
tions bearing in mind that substitutional solutes must diffuse, <strong>and</strong> that the easiest<br />
diffusion path for such solutes is through the interface. The substitutional solute flux<br />
through the volume <strong>of</strong> austenite has been shown to be negligibly small in comparison.<br />
93
dramatically different.<br />
5.5 Pearlite Growth Rate in Fe-C-Mn Steels<br />
It is important to note that in all <strong>of</strong> the analysis <strong>of</strong> experimental data (v, S) that<br />
follows, the interfacial energy does not appear explicitly since equation 5.3 requires<br />
only the ratio Sc/S. Given measured values <strong>of</strong> S <strong>and</strong> the fact that S/Sc = 2 means<br />
that Sc is defined. However, in order to make predictions <strong>of</strong> the growth rate in the<br />
absence <strong>of</strong> experimental data, it clearly is necessary to know the interfacial energy.<br />
Figure 5.6: Arrhenius plot <strong>of</strong> sDB versus inverse <strong>of</strong> temperature in Fe-1.0Mn-0.8C<br />
wt% steel for interface diffusion controlled pearlite growth. Error bars indicate the<br />
st<strong>and</strong>ard error <strong>of</strong> mean.<br />
96
5.5 Pearlite Growth Rate in Fe-C-Mn Steels<br />
Figure 5.7: Free energy, enthalpy <strong>and</strong> entropy change as a function <strong>of</strong> temperature.<br />
97
5.5 Pearlite Growth Rate in Fe-C-Mn Steels<br />
Figure 5.8: Variation in the entropy production rate as a function <strong>of</strong> the interlamellar<br />
spacing.<br />
98
5.5 Pearlite Growth Rate in Fe-C-Mn Steels<br />
Figure 5.9: Ferrite-cementite interfacial energy compared with those from previous<br />
study for Fe-C steels [64].<br />
99
5.5.4 Calculation <strong>of</strong> growth rate<br />
5.5 Pearlite Growth Rate in Fe-C-Mn Steels<br />
The pearlite growth rate calculated assuming the partitioning local–equilibrium is<br />
shown in Fig. 5.10. There is a reasonably good match with the measured growth rate<br />
for 1.0Mn wt% steel [46]; that in itself is not surprising since the boundary diffu-<br />
sion coefficients <strong>and</strong> interfacial energies were derived using those data. The pearlite<br />
growth rate was also calculated for a steel containing 1.8Mn wt% <strong>and</strong> there seems<br />
to be a good fit with the experimental rates determined by [17] at low temperatures,<br />
although at higher temperatures the difference increases.<br />
Figure 5.10: Pearlite growth rate as a function <strong>of</strong> temperature for Fe-1.0Mn-0.8C<br />
wt% <strong>and</strong> Fe-1.8Mn-0.69C wt%. Solid lines are calculated.<br />
Assuming that partitioning local equilibrium governs the conditions at the trans-<br />
formation front, that the interfacial diffusivity derived here is generally applicable,<br />
100
5.5 Pearlite Growth Rate in Fe-C-Mn Steels<br />
<strong>and</strong> that the maximum entropy production principle applies, the significant uncer-<br />
tainty in making predictions <strong>of</strong> the growth rate lies in the value <strong>of</strong> interfacial energy<br />
that must be used to determine interlamellar spacings. The extent <strong>of</strong> uncertainty<br />
may be assessed by using the maximum <strong>and</strong> minimum values determined from the<br />
Fe–1Mn–0.8C wt% system where the range is 1.28–1.39 J m −2 with a mean value <strong>of</strong><br />
1.32 J m −2 . Fig. 5.11 illustrates the difference these limits make to the growth rate<br />
<strong>of</strong> pearlite. It is suggested that in the absence <strong>of</strong> reliable data, it may be appropriate<br />
to use the mean value reported here accompanied by an error bar which is based on<br />
the range <strong>of</strong> σ αθ .<br />
Figure 5.11: Sensitivity <strong>of</strong> the growth rate calculations to the α/θ interfacial energy.<br />
101
5.6 Pearlite Growth Rate in Fe-C-Cr System<br />
5.6 Pearlite Growth Rate in Fe-C-Cr System<br />
In order to extend the applicability <strong>of</strong> the theory discussed in this paper for steels<br />
containing Mn, the pearlite growth rate was calculated for Fe-0.82C-1.29Cr wt%<br />
based on the work <strong>of</strong> Razik et al. [18]. There is one complication when the data<br />
corresponding to 993 K <strong>and</strong> 1003 K are considered. Because the alloy has a carbon<br />
concentration which is hypereutectoid, the supercoolings at these particular trans-<br />
formation temperatures are not sufficient to permit ferrite to form until the carbon<br />
concentration <strong>of</strong> the austenite is reduced by the precipitation <strong>of</strong> cementite. Since<br />
both ferrite <strong>and</strong> cementite must be able to grow from austenite in order to form<br />
pearlite, it is assumed that this condition is satisfied when the austenite composition<br />
is reduced by the precipitation <strong>of</strong> cementite to the point where the α+γ/γ <strong>and</strong> θ+γ/γ<br />
phase boundaries intersect, as illustrated by the point ‘A’ in Fig. 6.6. The point ‘A’,<br />
which extrapolates to ‘B’ at the transformation temperature, is the composition <strong>of</strong><br />
austenite assumed to decompose into pearlite when the supercooling is insufficient<br />
for the hypereutectoid alloy to permit the simultaneous precipitation. The average<br />
composition <strong>of</strong> the alloy is marked ‘C’ <strong>and</strong> has a carbon concentration which falls<br />
to the right <strong>of</strong> the extrapolated γ + α/γ phase boundary, making it impossible to<br />
simultaneously precipitate ferrite <strong>and</strong> cementite.<br />
It was verified that none <strong>of</strong> the reported data are consistent with the negligible<br />
partitioning local equilibrium mode; all <strong>of</strong> the experiments involve transformation at<br />
low supersaturations so that the analysis again is based on partitioning local equi-<br />
librium. The boundary diffusivity <strong>of</strong> chromium, is, in the absence <strong>of</strong> data, assumed<br />
to be identical that <strong>of</strong> manganese; this is considered to be a good approximation<br />
[44]. The interfacial compositions are determined using MTDATA (TCFE database)<br />
[76] <strong>and</strong> the method described earlier for the steel containing Mn. The isothermal<br />
sections <strong>of</strong> Fe-C-Cr steel is shown in Fig. 5.13 along with the suitable tie-lines cho-<br />
sen. The interfacial compositions used for the calculation <strong>of</strong> pearlite growth rate are<br />
summarised in Table 5.3.<br />
The interfacial energy has been determined for the steel containing Cr <strong>and</strong> it lies<br />
in the range <strong>of</strong> 0.52-0.89 J m −2 for the temperature range <strong>of</strong> 1003-933 K (Fig. 5.14).<br />
102
5.6 Pearlite Growth Rate in Fe-C-Cr System<br />
Figure 5.12: Isopleth section <strong>of</strong> Fe-Cr-C steel with the extrapolated phase boundaries.<br />
The lower values <strong>of</strong> σ αθ obtained can be explained by the greater tendency <strong>of</strong> Cr to<br />
segregate.<br />
It is observed that the growth rate estimated assuming the partitioning local<br />
equilibrium theory match measured values rather well as shown in Fig. 5.15. Razik<br />
et al. [18] in assessing their experimental data also calculated growth rates but not<br />
for the exact composition <strong>of</strong> the material studied, rather for an Fe–0.7C–1Cr wt%<br />
steel. Their calculations assume that chromium does not partition at all below the<br />
dashed horizontal line, so that pearlite growth is controlled by carbon diffusion alone.<br />
It is evident that such an analysis either greatly overestimates the growth rate when<br />
carbon is taken to diffuse through the interface, <strong>and</strong> under–predicts when carbon<br />
is taken to diffuse through the volume <strong>of</strong> the austenite ahead <strong>of</strong> the transformation<br />
front.<br />
103
(a) (b)<br />
(c) (d)<br />
5.6 Pearlite Growth Rate in Fe-C-Cr System<br />
Figure 5.13: Isothermal section <strong>of</strong> ternary phase boundaries at various temperatures<br />
for Fe-C-Cr steel.<br />
104
5.6 Pearlite Growth Rate in Fe-C-Cr System<br />
Figure 5.14: Comparison <strong>of</strong> ferrite-cementite interfacial energy for Fe-C-Cr <strong>and</strong> Fe-<br />
C-Mn steels.<br />
105
5.6 Pearlite Growth Rate in Fe-C-Cr System<br />
Figure 5.15: Comparison <strong>of</strong> calculated <strong>and</strong> experimental pearlite growth rate as a<br />
function <strong>of</strong> temperature for Fe-0.82C-1.29Cr wt%. The original calculations from<br />
[18] are included for comparison; the two values <strong>of</strong> S/Sc =2, 3 for volume diffusion<br />
controlled growth correspond to the maximum growth rate <strong>and</strong> maximum entropy<br />
production criteria respectively. The dashed line represents their no–partition temperature.<br />
106
5.7 Conclusions<br />
Table 5.3: P-LE compositions <strong>of</strong> chromium at the interface. (The compositions are<br />
reported in wt%)<br />
Temperature c γα<br />
Cr<br />
c γθ<br />
Cr<br />
c θγ<br />
Cr<br />
c αγ<br />
Cr<br />
K<br />
933 7.57 0.62 12.27 2.15<br />
973 3.29 0.76 12.35 1.35<br />
984 2.06 0.80 12.37 0.89<br />
993 2.24 0.88 13.04 1.05<br />
1003 2.11 0.93 13.05 1.06<br />
For both the 1.8 Mn (Fig. 5.10) <strong>and</strong> 1.29 Cr (Fig. 5.15) alloys, the calculated<br />
growth rates at the highest <strong>of</strong> transformation temperatures is greater than those<br />
measured. It is possible in ternary steels for the transformation at high temperatures<br />
to occur where the three–phases γ + α + θ exist in equilibrium, which would require<br />
the volume diffusion <strong>of</strong> substitutional solutes as the composition <strong>of</strong> the austenite<br />
changes during the course <strong>of</strong> transformation. This would result in a reduction in<br />
growth rate <strong>and</strong> an increase in interlamellar spacing [72, 103]. However, this is<br />
not the explanation for the observed discrepancy since in all cases the reported<br />
transformations occur in a phase field where only α+θ are ultimately in equilibrium.<br />
The reasons for the discrepancy are therefore not clear.<br />
5.7 Conclusions<br />
It has been demonstrated that in circumstances where an analytical calculation <strong>of</strong><br />
the growth rate <strong>of</strong> pearlite in ternary steels is useful, all <strong>of</strong> the published data are<br />
inconsistent with transformation in which the solute does not partition between the<br />
phases during transformation. Furthermore, even when partitioning is considered,<br />
none <strong>of</strong> the experimental data fall into the category <strong>of</strong> ‘negligible–partitioning local<br />
equilibrium’. If local equilibrium is to be maintained then there is only one option<br />
possible, that in which the substitutional solute must diffuse over distances compa-<br />
107
5.7 Conclusions<br />
rable with the interlamellar scale <strong>of</strong> the pearlite structure. Since the diffusivity <strong>of</strong><br />
substitutional solutes is much lower than that <strong>of</strong> carbon, the flux through the inter-<br />
face is by far the dominant mechanism for redistribution <strong>of</strong> atoms such as manganese<br />
or chromium. It is possible that the results can be extrapolated to other such substi-<br />
tutional solutes if pragmatic assumptions regarding interfacial energy <strong>and</strong> diffusivity<br />
are justified.<br />
The method adopted here is capable <strong>of</strong> providing reasonable estimates <strong>of</strong> pearlite<br />
growth using an analytical equation due to Hillert, in combination with thermody-<br />
namic data <strong>and</strong> the assumption that the interlamellar spacing adopted is consistent<br />
with the maximum entropy production rate.<br />
A number <strong>of</strong> difficulties have also been identified, for example, the fact that with<br />
hypereutectoid alloys there are circumstances when the simultaneous precipitation<br />
<strong>of</strong> ferrite <strong>and</strong> cementite is not possible when transforming at low supersaturations,<br />
so that it becomes necessary to allow the precipitation <strong>of</strong> cementite alone prior to<br />
the onset <strong>of</strong> pearlite. The growth rate is dependent on the α/θ interfacial energy<br />
<strong>and</strong> it is currently necessary when making predictions to assume approximate values<br />
derived from specific alloy systems. The dependence <strong>of</strong> interfacial energy on the<br />
chemical compositions at the transformation front is a rich <strong>and</strong> difficult area for<br />
future research.<br />
108
Chapter 6<br />
Divorced Eutectoid<br />
Transformation in Steels<br />
6.1 Introduction<br />
The theory discussed so far has been aimed specifically at the growth <strong>of</strong> lamellar<br />
pearlite in binary <strong>and</strong> ternary steels. However under a certain set <strong>of</strong> conditions, the<br />
pearlite may form as a mixture <strong>of</strong> spheroidised cementite surrounded by ferrite, also<br />
termed “a divorced eutectoid”structure. The name recognises the fact that there is<br />
no co-operation during growth, between the cementite <strong>and</strong> ferrite, as in the case <strong>of</strong><br />
lamellar pearlite. Spheroidising annealing is a heat treatment which is used to achieve<br />
this structure, the primary objective being, the reduction in hardness to enable<br />
fabrication prior to the final hardening. The spheroidisation can be accomplished<br />
using two annealing treatments, namely, subcritical <strong>and</strong> intercritical with the latter<br />
used in the bearings industry for hypereutectoid steels. The subcritical treatment<br />
comprises heating in the region below the eutectoid temperature <strong>and</strong> holding for a<br />
prolonged duration in order to spheroidise the pearlitic structure, whereas in the case<br />
<strong>of</strong> intercritical annealing, the steel is heated in the region <strong>of</strong> austenite <strong>and</strong> cementite<br />
followed by slow cooling. The divorced eutectoid transformation (DET) relies on the<br />
presence <strong>of</strong> pre-existing fine cementite particles distributed in the austenite matrix<br />
109
6.2 Background<br />
[104–106]. There is initially a competition between lamellar <strong>and</strong> divorced structure,<br />
while the steel is being cooled from the intercritical temperature. The formation <strong>of</strong><br />
the divorced form is favoured when the spacing between the cementite particles is<br />
small (a function <strong>of</strong> low austenising temperature <strong>and</strong> time) <strong>and</strong> when the cooling<br />
rate is low.<br />
This work described in this chapter discusses the theory <strong>of</strong> the divorced eutectoid<br />
transformation (DET) during the spheroidising annealing <strong>of</strong> bearing steels with spe-<br />
cial emphasis on predicting the transition region between pearlite <strong>and</strong> its divorced<br />
form in a rigorous manner for a binary <strong>and</strong> a multicomponent steel containing Cr,<br />
accounting for multiple flux paths <strong>and</strong> multicomponent diffusion.<br />
6.2 Background<br />
A typical spheroidising annealing cycle (Fig. 6.1) for producing a divorced eutectoid<br />
structure for a bearings steel usually consists <strong>of</strong> heating in the intercritical range <strong>of</strong><br />
1070-1100 K, holding there for 1-2 h, cooling at the rate <strong>of</strong> 15-25 K h −1 to 1025-1020<br />
K, further slow cooling to about 950-965 K at cooling rates less than 10 K h −1 <strong>and</strong><br />
finally air cooling to room temperature. As a result, the austenite with fine cementite<br />
particles transforms into ferrite <strong>and</strong> spheroidised cementite by the divorced eutectoid<br />
transformation (DET).<br />
Honda <strong>and</strong> Saito [107] were the first to report the spheroidised structure. They<br />
heated various steels ranging from low to high carbon contents at temperatures above<br />
A1, held there for 20 minutes followed by slow cooling to room temperature. They<br />
observed the microstructure to vary from a lamellar to a completely spheroidised form<br />
as a function <strong>of</strong> the austenising temperature, but the latter was found to persist at<br />
higher austenising temperatures in case <strong>of</strong> the hypereutectoid steels.<br />
Oyama [104] gave a detailed account <strong>of</strong> events leading to the formation <strong>of</strong> the<br />
divorced eutectoid. The initial microstructure for the steel 1 consisted <strong>of</strong> a mix-<br />
1 Composition (wt%) C: 1.5, Mn: 0.5, Cr: 1.5, Si: 0.5<br />
110
6.2 Background<br />
Figure 6.1: Schematic heat treatment for producing a divorced eutectoid structure<br />
in hypereutectoid steels. A1 is the eutectoid temperature.<br />
ture <strong>of</strong> pearlite <strong>and</strong> proeutectoid cementite. When this steel is heated within the<br />
inter-critical region, austenite forms in the regions <strong>of</strong> ferrite with much <strong>of</strong> the carbon<br />
coming from the dissolution <strong>of</strong> pearlitic cementite <strong>and</strong> the proeutectoid cementite.<br />
On holding at this temperature for a sufficient length <strong>of</strong> time, the ferrite disappears<br />
completely although some <strong>of</strong> the cementite from the pearlite still remains because<br />
the proeutectoid cementite also serves as a source <strong>of</strong> carbon. At this instance the<br />
distribution <strong>of</strong> carbon in austenite is non-uniform <strong>and</strong> away from equilibrium. The<br />
structure is ideal for the generation <strong>of</strong> divorced eutectoid, since there are a large<br />
number <strong>of</strong> closely-spaced cementite particles which simply grow during cooling <strong>and</strong><br />
hence suppress the development <strong>of</strong> lamellar pearlite during cooling. When the soak-<br />
ing times are large enough, this might homogenise the distribution <strong>of</strong> carbon <strong>and</strong><br />
coarsen the proeutectoid cementite, resulting in an increase in interparticle spac-<br />
ing. The divorced eutectoid will not form in such circumstances, <strong>and</strong> thus will be<br />
substituted by lamellar pearlite.<br />
111
6.2 Background<br />
Verhoeven <strong>and</strong> Gibson [108] proposed a model for the divorced eutectoid formation<br />
wherein, the carbon partitioned as ferrite grows, is incorporated into the existing<br />
proeutectoid cementite as the ferrite-austenite boundary moves <strong>and</strong> the mechanism<br />
is illustrated in Fig. 6.2(a). During the course <strong>of</strong> transformation when the mixture <strong>of</strong><br />
austenite <strong>and</strong> cementite is cooled below the eutectoid temperature, fluxes are created<br />
towards the cementite particles in both the austenite <strong>and</strong> ferrite, Fig. 6.2(b). If the<br />
γ/α interface advances with a velocity v, then the amount <strong>of</strong> carbon partitioned<br />
must equal that absorbed by cementite if the conditions <strong>of</strong> equilibrium were to be<br />
maintained at the interface:<br />
(c γα − c αγ c<br />
) v = Dγ<br />
γα − cγθ λγ<br />
c<br />
+ Dα<br />
αγ − cαθ λα<br />
(6.1)<br />
where λγ <strong>and</strong> λα represent the spacing <strong>of</strong> cementite particles on either side away from<br />
the interface. Verhoeven [109] studied the heat treatment conditions promoting the<br />
DET formation for SAE 52100 1 steel. It was reported that the addition <strong>of</strong> Cr was<br />
the most effective way <strong>of</strong> reducing the final carbide particle size. This was attributed<br />
to the carbide formation/dissolution rate at the inter–critical holding temperature<br />
which is reduced by Cr addition.<br />
Luzginova et al. [111] studied divorced pearlite formation in a hypereutectoid steel<br />
as a function <strong>of</strong> chromium concentration (0.5, 1.5, 2.5 <strong>and</strong> 3.5 wt %). The DET<br />
reaction was found to occur at smaller undercoolings (∆T ) as compared with the<br />
lamellar structure. It was observed that chromium promoted the divorced form at<br />
low austenitising temperature <strong>and</strong> when the cooling rate was reduced. Based on the<br />
theory proposed by Verhoeven [108], the transition line separating the DET from the<br />
lamellar pearlite as a function <strong>of</strong> undercooling <strong>and</strong> cementite particle spacing was<br />
calculated. It is unfortunate that the calculations <strong>of</strong> lamellar pearlite growth were<br />
for a binary Fe-C steel, which rather invalidates the analysis <strong>of</strong> the chromium effect.<br />
1 Composition (wt%) C: 1.03, Mn: 0.3, Cr: 1.28, Si: 0.23, P: 0.019, S: 0.014<br />
112
6.2 Background<br />
Figure 6.2: Schematic <strong>of</strong> (a) interface movement during the formation <strong>of</strong> divorced<br />
eutectoid <strong>and</strong> (b) concentration pr<strong>of</strong>ile <strong>of</strong> carbon adjacent to the interface. c γα st<strong>and</strong>s<br />
for concentration in austenite that is in equilibrium with ferrite <strong>and</strong> the other terms<br />
are interpreted similarly. Reproduced from Bhadeshia [110].<br />
113
6.3 Divorced Eutectoid Transformation in Fe-C System<br />
Figure 6.3: Plot <strong>of</strong> growth rate <strong>of</strong> pearlite (dotted line) superimposed on that <strong>of</strong><br />
divorced eutectoid transformation (solid lines). The dots show the critical undercooling<br />
at a particular spacing above which the transition occurs from divorced to<br />
lamellar form.<br />
115
6.3 Divorced Eutectoid Transformation in Fe-C System<br />
for a Fe-C alloy, based on the simultaneous solution <strong>of</strong> the equations for divorced <strong>and</strong><br />
lamellar modes <strong>of</strong> growth (graphically shown as the point <strong>of</strong> intersection <strong>of</strong> velocity<br />
<strong>of</strong> lamellar pearlite with the DET for appropriate spacing in the figure 6.3). It is<br />
observed that using the mixed diffusion–controlled growth <strong>of</strong> pearlite the curve shifts<br />
upwards, thereby exp<strong>and</strong>ing the domain <strong>of</strong> existence <strong>of</strong> the divorced form.<br />
Figure 6.4: Transition line separating the divorced from the lamellar mode for a<br />
Fe-C alloy. The spacing refers to the distance between the carbide particles at the<br />
intercritical temperature <strong>and</strong> ∆T is the undercooling below the A1 temperature.<br />
116
6.4 Divorced Eutectoid Transformation in Bearing Steels<br />
Figure 6.5: Isothermal section <strong>of</strong> a ternary Fe-C-Cr-Mn-Si system at 995 K.<br />
119
6.4 Divorced Eutectoid Transformation in Bearing Steels<br />
Figure 6.6: Isopleth section <strong>of</strong> Fe-C-Cr-Mn-Si steel with the extrapolated phase<br />
boundaries.<br />
120
6.6 Experimental Evaluation<br />
The transition curve defined by plotting the calculated carbide particle spacings<br />
against the undercooling is shown in Fig. 6.7. It is observed that the curve shifts<br />
upwards as a result, which in effect would allow the divorced eutectoid structure to<br />
persist at much higher undercoolings for a given intercritical holding temperature as<br />
compared to those calculated by Luzginova et al.<br />
Figure 6.7: Comparison <strong>of</strong> calculated transition curve with the data <strong>of</strong> Luzginova<br />
et al. [111]. Points A <strong>and</strong> B correspond to the microstructure observed in Fig. 6.9(a)<br />
<strong>and</strong> Fig. 6.8(a) respectively.<br />
6.6 Experimental Evaluation<br />
The experimental data plotted by Luzginova et al. based on intercritical annealing<br />
treatment for the transition between DET <strong>and</strong> pearlite transformation may not be<br />
strictly valid since the calculated curve is based on isothermal transformation whereas<br />
123
6.6 Experimental Evaluation<br />
Table 6.3: Chemical composition <strong>of</strong> the steel used in the study. All the compositions<br />
are in wt %.<br />
C Mn Si Cr Ni<br />
0.98 0.30 0.25 1.50 0.18<br />
their structures were generated by continuous cooling transformation. In order to<br />
confirm the validity <strong>of</strong> the calculations, a series <strong>of</strong> experiments was designed using<br />
a thermo-mechanical simulator. Cylindrical 8×12 mm samples were heated to a<br />
certain temperature in the intercritical region, undercooled below the A1 line <strong>and</strong><br />
allowed to transform isothermally. The actual composition <strong>of</strong> the steel used in the<br />
study is stated in Table 6.3. The temperatures were chosen so as to allow a varying<br />
degree <strong>of</strong> dissolution <strong>of</strong> cementite in the intercritical region <strong>and</strong> to assess the effect<br />
<strong>of</strong> different undercoolings. The samples were observed under the scanning electron<br />
microscope. A divorced eutectoid structure is favoured for specimens intercritically<br />
austenitised at 1073 K <strong>and</strong> 1050 K <strong>and</strong> isothermally held at 983 K <strong>and</strong> 933 K<br />
respectively. The relatively low intercritical temperatures ensure the presence <strong>of</strong><br />
closely spaced fine cementite particles which on isothermal transformation just grow<br />
bigger on account <strong>of</strong> the net carbon transport as the ferrite-austenite transformation<br />
front progresses. The extent <strong>of</strong> formation <strong>of</strong> divorced (spheroidised) structure for the<br />
specimen transformed at 933 K is slightly lower as compared to that at 983 K, on<br />
account <strong>of</strong> higher undercooling, <strong>and</strong> is confirmed from the microstructure presented<br />
in Fig. 6.8(a <strong>and</strong> b).<br />
In order to analyse the effect <strong>of</strong> higher intercritical temperatures (1123 K <strong>and</strong><br />
1103 K) on austenite decomposition, another set <strong>of</strong> experiments was performed<br />
where the specimens were transformed isothermally at 958 K <strong>and</strong> 933 K respectively.<br />
The higher austenitising temperature results in partial dissolution or coarsening <strong>of</strong><br />
the pre-existing cementite particles, leading to increased spacings between them,<br />
<strong>and</strong> thus promoting the conditions for predominantly lamellar pearlitic structure,<br />
124
6.7 Conclusions<br />
Fig. 6.9(a <strong>and</strong> b). It is worth noting here that the higher spacing, λ, necessitates<br />
larger diffusion distances thereby making DET formation more difficult. The DET<br />
reaction dominates the lamellar pearlite at low undercoolings provided the austenis-<br />
ing conditions are same. One common feature observed though, is the bimodal<br />
distribution <strong>of</strong> carbide particles owing to the presence <strong>of</strong> pro-eutectoid cementite on<br />
the grain boundaries <strong>and</strong> also the carbides growing intragranularly. The dilatation<br />
curves are shown in Figs. 6.10(a <strong>and</strong> b) for specimens austenitised at 1073 K <strong>and</strong> 1123<br />
K respectively <strong>and</strong> both show the increase in strain as a result <strong>of</strong> expansion when<br />
the mixture <strong>of</strong> austenite <strong>and</strong> cementite transforms to either ferrite <strong>and</strong> spheroidised<br />
cementite or lamellar pearlite. In order to confirm the extent <strong>of</strong> spheroidisation in<br />
specimens treated at different temperatures, Vickers hardness measurements were<br />
done under a load <strong>of</strong> 10 kg <strong>and</strong> using a diamond pyramid indentor. The hardness<br />
data are presented in Table 6.4 <strong>and</strong> clearly show high values for the lamellar structure<br />
when compared to the divorced form.<br />
The observed microstructures based on the isothermal treatment discussed above<br />
can be superimposed on the transition curve delineating the DET from the lamellar<br />
pearlite structure. According to the calculations done by Luzginova et al., for the<br />
steel austenised at 1073 K <strong>and</strong> treated at 983 K, their predictions would suggest<br />
that the structure would lie in the lamellar pearlitic region. However the microstruc-<br />
ture <strong>of</strong> this steel Fig. 6.8(a), consists <strong>of</strong> spheroidised carbides. The new transition<br />
curve based on the current work rightly predicts the microstructure to be that <strong>of</strong><br />
divorced eutectoid. Similarly, the steel with a larger carbide spacing as a result <strong>of</strong><br />
austenitising at 1123 K <strong>and</strong> holding at 958 K falls above the transition line owing<br />
to the lamellar structure. The experimental observations suggests that the divorced<br />
eutectoid structure exists over a larger domain than predicted by Luzginova et al.<br />
thus confirming the calculated transition line in Fig. 6.7.<br />
6.7 Conclusions<br />
It has been possible to redefine the transition boundaries separating the divorced eu-<br />
tectoid from the lamellar structure in case <strong>of</strong> Fe-C <strong>and</strong> a multicomponent steel con-<br />
125
(a)<br />
(b)<br />
6.7 Conclusions<br />
Figure 6.8: Microstructure showing divorced eutectoid structure obtained by (a)<br />
austenising at 1073 K <strong>and</strong> holding at 983 K. (b) austenised at 1050 K <strong>and</strong> held at<br />
933 K.<br />
126
(a)<br />
(b)<br />
6.7 Conclusions<br />
Figure 6.9: Microstructure showing predominently a lamellar structure, (a)<br />
austenised at 1123 K <strong>and</strong> held at 958 K <strong>and</strong> (b) austenised at 1103 K <strong>and</strong> 933<br />
K.<br />
127
(a)<br />
(b)<br />
6.7 Conclusions<br />
Figure 6.10: Dilatation curves for (a) Fig. 6.8(a) <strong>and</strong> Fig. 6.9(a).<br />
128
6.7 Conclusions<br />
Table 6.4: Vickers hardness data (10 kg load) for various heat treatments<br />
Austenitising temperature Holding temperature Hardness<br />
K K HV<br />
1073 983 198<br />
1050 933 217<br />
1103 933 280<br />
1123 958 278<br />
taining Cr. The method adopted here for the calculation <strong>of</strong> growth rate <strong>of</strong> lamellar<br />
pearlite in a multicomponent steel is based on the analytical treatment due to Hillert<br />
<strong>and</strong> modified for the interfacial compositions assuming partitioning local equilibrium<br />
<strong>and</strong> the maximum rate <strong>of</strong> entropy production criterion. The difficulties encountered<br />
during transformation at lower undercoolings where the simultaneous precipitation<br />
<strong>of</strong> ferrite <strong>and</strong> cementite is not possible, have been overcome in case <strong>of</strong> chromium<br />
containing steel using a new approach outlined. The calculations suggest that the<br />
transition line shifts significantly upwards in case <strong>of</strong> both the steels when compared<br />
with the work <strong>of</strong> previous researchers, thereby exp<strong>and</strong>ing the domain <strong>of</strong> the sper-<br />
oidised (DET) structure as a function <strong>of</strong> carbide spacing <strong>and</strong> undercooling <strong>and</strong> the<br />
same has been validated through the experimental data. This in turn has a potential<br />
to develop a more energy efficient spheroidising annealing process for steels requiring<br />
good machinability. The calculations also show that the presence <strong>of</strong> Cr enhances<br />
the process <strong>of</strong> spheroidisation by increasing the domain <strong>of</strong> existence <strong>of</strong> a divorced<br />
eutectoid structure, when compared with plain carbon steels.<br />
129
Chapter 7<br />
Conclusions <strong>and</strong> Scope for Future<br />
Work<br />
General Conclusions<br />
The work presented in the thesis describes the theory <strong>of</strong> pearlite growth <strong>and</strong> the di-<br />
vorced eutectoid transformation in binary <strong>and</strong> ternary steels. A simplified model has<br />
been proposed which combines the flux contributions from diffusion in the volume <strong>of</strong><br />
austenite <strong>and</strong> the phase boundary to represent the mechanism <strong>of</strong> pearlite growth in<br />
Fe-C steels. It has been shown that the flux <strong>of</strong> carbon through the boundary between<br />
pearlite <strong>and</strong> austenite dominates at all but the highest <strong>of</strong> transformation tempera-<br />
tures. The maximum growth rate <strong>and</strong> entropy production criteria have been derived<br />
rigorously in the context <strong>of</strong> combined flux diffusion theory for the determination <strong>of</strong><br />
critical interlamellar spacing, <strong>and</strong> it has been shown for the first time that the ratio<br />
<strong>of</strong> the nominal to critical spacing (S/Sc) is not constant but a variable quantity with<br />
respect to temperature. The ferrite-cementite interfacial energy has been deduced<br />
based on the calculated free energy values <strong>and</strong> assuming the maximum rate <strong>of</strong> en-<br />
tropy production as the optimum criterion. The theory leads also to a realistic value<br />
<strong>of</strong> the activation energy for interfacial diffusion <strong>of</strong> carbon which is less than that for<br />
volume diffusion in austenite <strong>and</strong> greater than for volume diffusion in ferrite. As<br />
130
a consequence <strong>of</strong> this new theory, the match with the experimental data is better<br />
when compared with the previous work in spite <strong>of</strong> the fact that the considerations<br />
<strong>of</strong> equilibrium at junctions between interfaces are ab<strong>and</strong>oned.<br />
A third diffusion flux through the ferrite trailing behind the transformation front<br />
has also been incorporated in the mixed diffusion–controlled growth theory. The<br />
inclusion <strong>of</strong> flux through the ferrite indeed leads to an increase in the growth rate as<br />
compared to that in austenite alone. It has, however, been shown that combination<br />
<strong>of</strong> fluxes through austenite <strong>and</strong> the transformation front represent the experimental<br />
data rather well <strong>and</strong> given the lack <strong>of</strong> evidence <strong>of</strong> cementite thickening behind the<br />
transformation front, the third flux may be neglected in practice.<br />
A more complex theory <strong>of</strong> pearlite growth in ternary steels containing either Mn<br />
or Cr has been discussed <strong>and</strong> it has been demonstrated that all <strong>of</strong> the published data<br />
are inconsistent with transformation in which the substitutional solute does not par-<br />
tition between the product phases. Furthermore, none <strong>of</strong> the experimental data fall<br />
in the category <strong>of</strong> ‘negligible-partitioning local equilibrium’. It has been shown that<br />
these solutes must diffuse over distances comparable with the interlamellar spacing<br />
in pearlite. Although the diffusion coefficient <strong>of</strong> Mn or Cr is much smaller as com-<br />
pared with that <strong>of</strong> carbon, it has been demonstrated that the flux <strong>of</strong> these solutes<br />
along the interface is the rate controlling mechanism to allow for their redistribution<br />
between the product phases. A modified approach has been proposed to determine<br />
the interfacial compositions at the γ/γ +θ phase boundary, since the iso-activity line<br />
<strong>of</strong> carbon, in general does not intersect this boundary <strong>and</strong> it is therefore reasonable<br />
to assume that the tie-line connecting cementite <strong>and</strong> austenite passes through the<br />
alloy composition. The difficulty with respect to the simultaneous precipitation <strong>of</strong><br />
ferrite <strong>and</strong> cementite has been highlighted for the hypereutectoid alloys at low super-<br />
saturations <strong>and</strong> the means to overcome this has been suggested. The importance <strong>of</strong><br />
the α/θ interfacial energy as a function <strong>of</strong> composition in the accurate determination<br />
<strong>of</strong> interlamellar spacing <strong>and</strong> hence the growth has been emphasised.<br />
131
The theories developed for the binary <strong>and</strong> ternary steels would be academic in<br />
nature unless they could be applied to an industrial scenario. The case <strong>of</strong> the divorced<br />
eutectoid transformation during the spheroidising annealing <strong>of</strong> bearing steels has<br />
been analysed quantitatively. Using a rigorous treatment it has been shown that<br />
there exists a wider window (than previously thought) for processing <strong>of</strong> these steels<br />
that would lead to an energy efficient process.<br />
Scope for Future Work<br />
The theory for pearlite growth in ternary steels could be applied to a multicomponent<br />
steel assuming that the diffusivities <strong>of</strong> substitutional solutes (like Cr, Ni, Mn etc.) are<br />
similar. But some work needs to be done in order to arrive at an effective diffusion<br />
coefficient which would account for the partitioning <strong>of</strong> various solutes during the<br />
growth <strong>of</strong> pearlite.<br />
The theory for the pearlite growth rate discussed in this work assumes a constant<br />
interlamellar spacing <strong>and</strong> growth rate. However there are instances for eg. formation<br />
<strong>of</strong> divergent pearlite, where the spacing increases continuously leading to a decrease<br />
in growth rate as the transformation progresses. There is a potential for future work<br />
to account for this non-steady state behaviour in order to develop a unified theory.<br />
The case <strong>of</strong> pearlite dissolution has been discussed briefly (Appendix A) <strong>and</strong> it<br />
has been shown that the dissolution kinetics are much faster as compared to that <strong>of</strong><br />
pearlite formation owing to the higher temperatures involved in the former. It is still<br />
not clear whether it is the cementite in pearlite or the ferrite that dissolves first <strong>and</strong><br />
whether the kinetics is governed by the diffusion <strong>of</strong> substitutional solute through the<br />
interface or the carbon. Some more work needs to be done in order to establish the<br />
exact mechanism, but it has been demonstrated that once this clear, the necessary<br />
theory should be readily deduced from the pearlite growth modes.<br />
132
It has been thought that the theory for pearlite growth developed in this work<br />
can be integrated into the simultaneous transformation model that includes other<br />
phases <strong>and</strong> which would lead to the quantification <strong>of</strong> the microstructure for a range<br />
<strong>of</strong> steels.<br />
133
Appendix A<br />
Dissolution <strong>of</strong> Pearlite<br />
Reaustenisation <strong>of</strong> steels is a common treatment employed during the processing <strong>of</strong><br />
steels. This involves dissolution <strong>of</strong> the previously formed structure which may either<br />
be ferritic, pearlitic, bainitic or martensitic or a combination <strong>of</strong> these. It is expected<br />
that the pearlite dissolution kinetics should be much faster than growth owing to<br />
the higher temperatures involved in reaustenisation. Essentially the same equation<br />
employed for the growth <strong>of</strong> pearlite from austenite may be used for the dissolution,<br />
with appropriate adjustments <strong>of</strong> the local equilibrium conditions at the interfaces <strong>and</strong><br />
<strong>of</strong> the diffusivity. The rates at which the ferrite <strong>and</strong> cementite lamellae are consumed<br />
by the austenite are assumed to be the same. The distance over which the diffusion<br />
occurs is the interlamellar spacing, which is determined during the original growth<br />
<strong>of</strong> pearlite. The concentration pr<strong>of</strong>iles for the austenite formation from pearlite are<br />
shown in Fig. 1.1. When the austenite is growing into ferrite, the carbon in the<br />
austenite becomes diluted at the γ/α interface. At the same time the carbon rich<br />
cementite rejects the carbon into the austenite.<br />
In a Fe-4.77Mn-0.72C wt% steel it is observed that the dissolution rates are much<br />
faster as compared to the growth rate <strong>of</strong> pearlite, <strong>and</strong> the dissolution kinetics may<br />
either be governed by the C mixed-mode diffusion (through the volume <strong>of</strong> austenite<br />
<strong>and</strong> the austenite-pearlite interface) or the boundary diffusion <strong>of</strong> Mn, although the<br />
former mechanism seems to be much faster than the latter as shown in the Fig. 1.2.<br />
In order to experimentally validate the pearlite dissolution kinetics, the 5.0 Mn wt%<br />
steel was austenised at 1000 ◦ C, cooled to <strong>and</strong> isothermally held at 590 ◦ Cfor1h<br />
134
(a) (b)<br />
Dissolution <strong>of</strong> Pearlite<br />
Figure 1.1: Schematic concentration pr<strong>of</strong>ile for austenite growing into (a) ferrite <strong>and</strong><br />
(b) cementite.<br />
for complete transformation to pearlite. It was then reaustenitised at 800 ◦ Cfor30<br />
s <strong>and</strong> quenched to room temperature. The microstructure shows the presence <strong>of</strong><br />
platelets <strong>of</strong> martensite, meaning that the pearlite dissolution was over in less than<br />
30 s at 800 ◦ C leading to a completely austenitic structure which then transformed<br />
into martensite on quenching (Fig. 1.3).<br />
135
Dissolution <strong>of</strong> Pearlite<br />
Figure 1.2: Comparison <strong>of</strong> calculated growth <strong>and</strong> dissolution rates <strong>of</strong> pearlite in a<br />
Fe-4.77Mn-0.72C wt % steel.<br />
Figure 1.3: Microstructure showing martensite formed after quenching the<br />
reaustenised structure from 800 ◦ C (30 s hold) in a Fe-4.77Mn-0.72C wt% steel. Vickers<br />
hardness - 430 HV at 10 kg load.<br />
136
Appendix B<br />
Divergent Pearlite<br />
In case <strong>of</strong> a Fe-4.77Mn-0.72C wt% steel, held at 625 ◦ C for 90 min., the pearlite<br />
transformation is incomplete <strong>and</strong> the microstructure shows colonies <strong>of</strong> pearlite, with<br />
the lamellae growing in a divergent manner, wherein the interlamellar spacing in-<br />
creases with time resulting in decrease in growth rate, Fig. 1.1. The formation <strong>of</strong> a<br />
divergent structure is a consequence <strong>of</strong> the alloy composition falling in the 3-phase<br />
(α + θ + γ) region. The transformation in this region (Fig. 1.2) progresses wherein<br />
the the composition <strong>of</strong> austenite changes continuously in the region ahead <strong>of</strong> the<br />
growing pearlite thus necessitating volume diffusion <strong>of</strong> Mn <strong>and</strong> resulting in reduced<br />
growth rate.<br />
137
Divergent Pearlite<br />
Figure 1.1: Micrograph showing divergent pearlite formation in a Fe-4.77Mn-0.72C<br />
wt% steel.<br />
138
Figure 1.2: Isopleth section <strong>of</strong> Fe-C-Mn steel.<br />
139<br />
Divergent Pearlite
Appendix C<br />
Program for Pearlite Growth in Binary Steels<br />
1.1 Provenance <strong>of</strong> Source Code<br />
Ashwin S. P<strong>and</strong>it, Phase Transformations Group, <strong>Department</strong> <strong>of</strong> <strong>Materials</strong> <strong>Science</strong><br />
<strong>and</strong> <strong>Metallurgy</strong>, <strong>University</strong> <strong>of</strong> Cambridge, Cambridge, UK.<br />
1.2 Purpose<br />
The program calculates the isothermal growth rate <strong>of</strong> pearlite in Fe-C steels.<br />
1.3 Specification<br />
Self-contained program written in fortran.<br />
1.4 Description<br />
The program calculates the isothermal growth rate <strong>of</strong> pearlite in Fe-C steel. The<br />
growth rate is calculated using a mixed diffusion <strong>of</strong> carbon through the austenite as<br />
well as the pearlite-austenite interface, thereby eliminating any assumptions regard-<br />
ing the diffusion paths taken by the solute.<br />
140
1.5 References<br />
1.5 References<br />
1) R. H. Siller <strong>and</strong> R. B. McLellan, The application <strong>of</strong> first order mixing statistics<br />
to the variation <strong>of</strong> the diffusivity <strong>of</strong> carbon in austenite, Metallurgical Transactions,<br />
1970, 1, 985-988.<br />
2) W. W. Dunn <strong>and</strong> R. B. McLellan, The application <strong>of</strong> quasichemical solid solution<br />
model to carbon in austenite, Metallurgical Transactions, 1970, 1, 1263-126.<br />
3) H. K. D. H. Bhadeshia, Diffusion <strong>of</strong> carbon in austenite, Metal <strong>Science</strong>, 1981, 15,<br />
477-479.<br />
4) H. K. D. H. Bhadeshia, MAP programs, http://www.msm.cam.ac.uk/map/steel/functions/cg-<br />
b.html.<br />
5) R. Trivedi <strong>and</strong> G. M. Pound, Effect <strong>of</strong> concentration-dependent diffusion coeffi-<br />
cient on the migration <strong>of</strong> interphase boundaries, J. Appl. Phys., 1967, 38, 3569-3576.<br />
6) C. Zener, Kinetics <strong>of</strong> Decomposition <strong>of</strong> Austenite, Trans. AIME, 1946, 167, 550-<br />
595.<br />
7) M. Hillert, The role <strong>of</strong> interfaces in phase transformations, 1970, In mechanism<br />
<strong>of</strong> phase transformations in crystalline solids. Monograph <strong>and</strong> Report series, no. 33,<br />
231-247.<br />
8) D. Brown <strong>and</strong> N. Ridley, Kinetics <strong>of</strong> the pearlite reaction in high-purity nickel<br />
eutectoid steels, J. Iron Steel Inst., 1969, 207, 1232-1240.<br />
1.6 Parameters<br />
Input parameters<br />
argument in parentheses corresponds to the data type<br />
carbon / wt%, (real)<br />
Temperature / K, (real)<br />
141
1.6.1 Input files<br />
Input files :<br />
1.6 Parameters<br />
fa a c.txt composition <strong>of</strong> carbon (column-3), iron (column-2) in austenite which is<br />
in equilibrium with ferrite at the interface as a function <strong>of</strong> temperature (column-1)<br />
fa f c.txt composition <strong>of</strong> carbon (column-3), iron (column-2) in ferrite which is in<br />
equilibrium with austenite at the interface as a function <strong>of</strong> temperature (column-1)<br />
ca a c.txt composition <strong>of</strong> carbon (column-3), iron (column-2) in austenite which is<br />
in equilibrium with cementite at the interface as a function <strong>of</strong> temperature (column-<br />
1)<br />
ca c c.txt - composition <strong>of</strong> carbon (column-3), iron (column-2) in cementite which is<br />
in equilibrium with austenite at the interface as a function <strong>of</strong> temperature (column-<br />
1)<br />
All the compositions in the files above are in mass fraction <strong>and</strong> the temperature is in<br />
K. The interfacial compositions are calculated using MTDATA (TCFE database).<br />
1.6.2 Output parameters<br />
Interlamellar spacing, lamda2 / m, (real)<br />
Thickness <strong>of</strong> ferrite lamella, lamfe2 / m, (real)<br />
Thickness <strong>of</strong> cementite lamella, lamce2 / m, (real)<br />
Grain boundary diffusivity <strong>of</strong> carbon, dcgb4 / m 2 s −1 , (real)<br />
Weighted average diffusivity <strong>of</strong> carbon, davg/m 2 s −1 , (real)<br />
Pearlite growth rate, velo / m s −1 , (real)<br />
1.6.3 Output files<br />
output.txt - gives the Temperature (in degree centigrade) <strong>and</strong> the growth rate in m<br />
s −1<br />
142
1.7 Program Listing<br />
program pearlite<br />
1.7 Program Listing<br />
integer loop ,i ,j ,m,p,option , choice ,w,p1,p2,p3,p4,r ,s ,t<br />
real carbon ,c cem , c fer<br />
real coef ,coef1 ,coef2 ,coef3 ,coef4 ,coe ,coef5 ,coef7 , d coef<br />
real af ac ,a f mn , c f mn<br />
real tempf(1000), af fe(1000),af mn(1000) , af c(1000)<br />
real tempf1(1000),ac fe(1000),ac mn(1000) , ac c(1000)<br />
real tempf2(1000), fa fe(1000),fa mn(1000) , fa c(1000)<br />
real tempf3(1000),ca fe(1000),ca mn(1000) , ca c(1000)<br />
real df cf ,ddash1 ,ddash2 , del f,k,h,ddash,del e,v1,v2<br />
real v,v gb , stor , stor1 , st mn , st mn1 , st mn2 , st mn3<br />
real k gb , v3 , v4 ,v5 , st c,st c1<br />
real c f c,c fe(1000),c c(1000),acti c<br />
real del T,temp,teqm,teqm1,si fc ,slope ,z1,df av<br />
real del hm , del vm , velo , delta , factor , lamda , lamfer ,lamcem<br />
real Mn,Cr,Si , f fe(1000),f c(1000),D(1000)<br />
real eta ,molfra ,ans ,d avg , part c,vcgb,dcgb,d eff<br />
real temp 1(1000),a fe(1000),a c(1000),temp 2(1000)<br />
real temp 3(1000),a1 fe(1000),a1 c(1000),temp 4(1000)<br />
real var1 ,var2 ,var3 ,var4 ,res1 ,res2 ,act ,R1,CG,CG1<br />
real var1 m,var3 m<br />
del f=21230<br />
h=6.63E−34<br />
z1=12<br />
c cem=6.67<br />
c fer=0.025<br />
teqm=1000<br />
open ( unit = 22 , f i l e = ’ fa a c.txt’, status=’old’)<br />
143
1.7 Program Listing<br />
open ( unit = 42 , f i l e = ’ fa f c.txt’, status=’old’)<br />
open ( unit = 32 , f i l e = ’ ca a c.txt’, status=’old’)<br />
open ( unit = 72 , f i l e = ’ ca c c.txt’, status=’old’)<br />
open ( unit = 1 , f i l e = ’ output . txt ’ , access=’append ’)<br />
c ∗∗∗∗∗∗∗∗∗∗∗∗∗∗∗∗∗∗∗∗∗∗∗∗∗∗∗∗∗∗∗∗∗∗∗∗∗∗∗∗∗∗∗∗∗∗∗∗∗∗∗∗∗∗∗∗∗∗<br />
print ∗ ,’Enter the chemical composition:’<br />
print ∗ ,’Carbon’<br />
read ∗ ,carbon<br />
write (1 ,31)<br />
31 FORMAT(’−−−−−−−−−−−−−−−−−−−−−−−−−−−−−−−−−−−−−−−−−−’)<br />
write (1 ,34) , ’Temperature ’ , ’Growth rate ’<br />
34 FORMAT(X,A,7X,A)<br />
write (1 ,37) , ’(C) ’ , ’(m s−1)’<br />
37 FORMAT(4X,A,15X,A)<br />
write (1 ,38)<br />
38 FORMAT(’−−−−−−−−−−−−−−−−−−−−−−−−−−−−−−−−−−−−−−−−−−’)<br />
do 61 loop=1,9<br />
print ∗ , ’enter the temperature : ’<br />
read ∗ , temp<br />
If (temp .GE. teqm) then<br />
print ∗ , ’Please enter temp lesser than teqm: ’<br />
endif<br />
c ∗∗∗∗∗∗∗∗∗∗∗∗∗∗∗∗∗∗∗∗∗∗∗∗∗∗∗∗∗∗∗∗∗∗∗∗∗∗∗∗∗∗∗∗∗∗∗∗∗∗∗∗∗∗∗∗∗∗<br />
do 200 r=1,600<br />
read (22 ,∗ ,end=201) temp 1(r),a fe(r),a c(r)<br />
if (temp 1(r) .EQ. temp) then<br />
144
var1=a c(r)∗100<br />
1.7 Program Listing<br />
c a c(r) is multiplied by 100 to convert mass fraction<br />
& into mass<br />
endif<br />
200 enddo<br />
201 endfile 22<br />
rewind 22<br />
c ∗∗∗∗∗∗∗∗∗∗∗∗∗∗∗∗∗∗∗∗∗∗∗∗∗∗∗∗∗∗∗∗∗∗∗∗∗∗∗∗∗∗∗∗∗∗∗∗∗∗∗∗∗∗∗∗∗<br />
do 300 s=1,600<br />
read (42 ,∗ ,end=301) temp 2(s), f fe(s),f c(s)<br />
if (temp 2(s) .EQ. temp) then<br />
var2=f c(s)∗100<br />
c f c(p2) is multiplied by 100 to convert mass fraction<br />
& into mass<br />
endif<br />
300 enddo<br />
301 endfile 42<br />
rewind 42<br />
c ∗∗∗∗∗∗∗∗∗∗∗∗∗∗∗∗∗∗∗∗∗∗∗∗∗∗∗∗∗∗∗∗∗∗∗∗∗∗∗∗∗∗∗∗∗∗∗∗∗∗∗∗∗∗∗∗∗∗<br />
do 400 t=1,600<br />
read (32 ,∗ ,end=401) temp 3(t),a1 fe(t),a1 c(t)<br />
if (temp 3(t) .EQ. temp) then<br />
var3=a1 c(t)∗100<br />
c a1 c(p3) is multiplied by 100 to convert mass fraction<br />
& into mass<br />
endif<br />
145
400 enddo<br />
401 endfile 32<br />
rewind 32<br />
1.7 Program Listing<br />
c ∗∗∗∗∗∗∗∗∗∗∗∗∗∗∗∗∗∗∗∗∗∗∗∗∗∗∗∗∗∗∗∗∗∗∗∗∗∗∗∗∗∗∗∗∗∗∗∗∗∗∗∗∗∗∗∗∗<br />
do 500 p4=1,600<br />
read (72 ,∗ ,end=501) temp 4(p4),c fe(p4),c c(p4)<br />
if (temp 4(p4) .EQ. temp) then<br />
var4=c c(p4)∗100<br />
c c c(p4) is multiplied by 100 to convert mass fraction<br />
& into mass<br />
endif<br />
500 enddo<br />
501 endfile 72<br />
rewind 72<br />
c ∗∗∗∗∗∗∗∗∗∗∗∗∗∗∗∗∗∗∗∗∗∗∗∗∗∗∗∗∗∗∗∗∗∗∗∗∗∗∗∗∗∗∗∗∗∗∗∗∗∗∗∗∗∗∗∗∗<br />
c res1 <strong>and</strong> res2 calculates the diff . in interfacial<br />
c compositions in Fe−C alloy<br />
c ∗∗∗∗∗∗∗∗∗∗∗∗∗∗∗∗∗∗∗∗∗∗∗∗∗∗∗∗∗∗∗∗∗∗∗∗∗∗∗∗∗∗∗∗∗∗∗∗∗∗∗∗∗∗∗∗∗<br />
res1=var1−var3<br />
res2=var4−var2<br />
call mol frac c(var1,var3,var1 m,var3 m)<br />
c calculates the mol fraction <strong>of</strong> carbon in austenite<br />
c var1 is the carbon in austenite in wt%<br />
146
1.7 Program Listing<br />
call diff calc(var1 m,var3 m,carbon,res1,res2,temp,d avg)<br />
c calculates the pearlite growth rate using volume<br />
c diffusivity <strong>of</strong> C in austenite<br />
c call boundary diff c(d avg ,temp , part c,res1,res2,vcgb)<br />
c calculates the pearlite growth rate using boundary<br />
c diffusivity <strong>of</strong> C in austenite<br />
call mixed growth(temp , carbon , d avg , res1 , res2 , velo )<br />
print ∗ ,’the pearlite growth rate in m s−1 is : ’ , velo<br />
write (1 ,33) ,temp−273, velo<br />
33 format ( f6 .1 , e22 .3)<br />
61 enddo<br />
close(22)<br />
close(42)<br />
close(32)<br />
close(72)<br />
close (1)<br />
c close (113)<br />
stop<br />
end<br />
c ∗∗∗∗∗∗∗∗∗∗∗∗∗∗∗∗∗∗∗∗∗∗∗∗∗∗∗∗∗∗∗∗∗∗∗∗∗∗∗∗∗∗∗∗∗∗∗∗∗∗∗∗∗∗∗∗∗∗<br />
subroutine diff calc(var1 m,var3 m,carbon,res1,res2,<br />
& temp,d avg)<br />
real v1,v2,v,lamda,lamcem,lamfer ,phi<br />
147
eal d eff , delta<br />
delta=2.5e−10<br />
del vm=7.1E−6<br />
del e=8352<br />
k=1.38E−23<br />
call phi c(del e,k,temp,phi)<br />
1.7 Program Listing<br />
c calculates the value <strong>of</strong> sigma: site exclusion probability ,<br />
c used in calculation <strong>of</strong> eta<br />
call act c(var1 m,temp,del e,acti c)<br />
c calculates the activity <strong>of</strong> carbon in austenite using a<br />
c quasi chemical model:MAP<br />
call DCG(var1 m,del e,temp,R,slope)<br />
c calculates the differential <strong>of</strong> activity <strong>of</strong> carbon in<br />
& austenite<br />
call DIFF(temp,var1 m,var3 m,del e,acti c,slope,phi,davg)<br />
end<br />
c ∗∗∗∗∗∗∗∗∗∗∗∗∗∗∗∗∗∗∗∗∗∗∗∗∗∗∗∗∗∗∗∗∗∗∗∗∗∗∗∗∗∗∗∗∗∗∗∗∗∗∗∗∗∗∗∗∗∗∗∗<br />
subroutine mol frac c(var1,var3,var1 m,var3 m)<br />
real wt fe , fe mol , c mol , wt fe1 , fe mol1 , c mol1<br />
wt fe=100−var1<br />
fe mol=wt fe/55.8<br />
c mol=var1/12.01<br />
var1 m=c mol/( fe mol+c mol)<br />
wt fe1=100−var3<br />
fe mol1=wt fe1/55.8<br />
148
c mol1=var3/12.01<br />
var3 m=c mol1/(fe mol1+c mol1)<br />
return<br />
end<br />
1.7 Program Listing<br />
c ∗∗∗∗∗∗∗∗∗∗∗∗∗∗∗∗∗∗∗∗∗∗∗∗∗∗∗∗∗∗∗∗∗∗∗∗∗∗∗∗∗∗∗∗∗∗∗∗∗∗∗∗∗∗∗∗∗∗∗∗<br />
subroutine lamda crit spa(teqm,temp,spac)<br />
real spac ,del T,del hm ,teqm , del vm , del HV , del G,lamda2<br />
del HV=(−2E6∗temp)+2E9<br />
del T=teqm−temp<br />
del G=(8.09554e5∗temp) −8.03332e08<br />
lamda2=1e−6/((−0.1627∗temp)+162.74)<br />
spac=lamda2/(4.586e−35∗exp(temp/12.8523)+2.03714)<br />
si fc=−0.5∗ spac∗ del G<br />
return<br />
end<br />
c ∗∗∗∗∗∗∗∗∗∗∗∗∗∗∗∗∗∗∗∗∗∗∗∗∗∗∗∗∗∗∗∗∗∗∗∗∗∗∗∗∗∗∗∗∗∗∗∗∗∗∗∗∗∗∗∗∗∗∗∗<br />
subroutine lamella thk(carbon ,c cem , c fer ,lamda,lamcem)<br />
real wt frac fer , vol frac fer ,vol frac cem , r fer<br />
real lamda,lamcem<br />
wt frac fer=(c cem−carbon )/(c cem−c fer)<br />
vol frac fer=wt frac fer<br />
c densities <strong>of</strong> ferrite <strong>and</strong> austenite are nearly same<br />
vol frac cem=1− vol frac fer<br />
r fer=vol frac fer/vol frac cem<br />
lamcem=lamda/( r fer+1)<br />
return<br />
end<br />
c ∗∗∗∗∗∗∗∗∗∗∗∗∗∗∗∗∗∗∗∗∗∗∗∗∗∗∗∗∗∗∗∗∗∗∗∗∗∗∗∗∗∗∗∗∗∗∗∗∗∗∗∗∗∗∗∗∗∗∗∗∗∗<br />
subroutine phi c(del e,k2,temp,phi1)<br />
149
eal k2,phi1<br />
phi1=1−exp( (− del e)/(k2∗temp) )<br />
c print ∗ , ’the value <strong>of</strong> phi is : ’ , phi<br />
c print ∗ , ’the value <strong>of</strong> temp is : ’ ,temp<br />
return<br />
end<br />
1.7 Program Listing<br />
c ∗∗∗∗∗∗∗∗∗∗∗∗∗∗∗∗∗∗∗∗∗∗∗∗∗∗∗∗∗∗∗∗∗∗∗∗∗∗∗∗∗∗∗∗∗∗∗∗∗∗∗∗∗∗∗∗∗∗∗∗∗∗<br />
c SUBROUTINE GIVING THE DIFFERENTIAL OF NATURAL LOGARITHM<br />
c (ACTIVITY OF CARBON IN AUSTENITE):<br />
subroutine DCG(var1 m,del e,temp,R1,slope)<br />
real DG,DDG,var1 m,temp,slope,phi10<br />
R1=8.14<br />
phi10=1.0−EXP(− del e/(R1∗temp ))<br />
DG=SQRT( 1 . 0 −2.0∗(1.0+2.0∗ phi10)∗ var1 m+(1.0+8.0∗ phi10)<br />
& ∗var1 m ∗∗2)<br />
DDG=( 0 . 5 /DG) ∗( −2.0−4.0∗ phi10+2.0∗ var1 m+16.0∗ phi10∗var1 m)<br />
slope=−((10.0/(1.0−2.0∗ var1 m))+(5.0/var1 m))<br />
& +6.0∗((DDG+3.0)/(DG−1.0+3.0∗ var1 m)<br />
& −(DDG−3.0)/(DG+1.0−3.0∗ var1 m))<br />
return<br />
end<br />
c ∗∗∗∗∗∗∗∗∗∗∗∗∗∗∗∗∗∗∗∗∗∗∗∗∗∗∗∗∗∗∗∗∗∗∗∗∗∗∗∗∗∗∗∗∗∗∗∗∗∗∗∗∗∗∗∗∗∗∗∗∗∗∗<br />
c FUNCTION GIVING THE NATURAL LOGARITHM (ACTIVITY<br />
c OF CARBON IN AUSTENITE):<br />
subroutine act c(var1 m,temp,del e,CG)<br />
real var1 m,AJ,DG,EG,EG1,R,W,CG<br />
R=8.31<br />
AJ=1−EXP(− del e/(R∗temp ))<br />
IF(var1 m .LE. 1.0e−10) THEN<br />
150
CG=LOG( 1 . 0 e −10)<br />
ELSE<br />
1.7 Program Listing<br />
DG=SQRT( 1 . 0 −2.0∗(1.0+2.0∗AJ)∗ var1 m+(1.0+8.0∗AJ)∗<br />
& var1 m ∗∗2)<br />
EG=5∗LOG((1 −2∗ var1 m)/var1 m)+6∗ del e/(R∗temp)<br />
EG1= (38575 −13.48∗temp )/(R∗temp)<br />
CG=EG+EG1+6∗LOG( (DG−1+3∗var1 m)/(DG+1−3∗var1 m))<br />
ENDIF<br />
RETURN<br />
END<br />
c ∗∗∗∗∗∗∗∗∗∗∗∗∗∗∗∗∗∗∗∗∗∗∗∗∗∗∗∗∗∗∗∗∗∗∗∗∗∗∗∗∗∗∗∗∗∗∗∗∗∗∗∗∗∗∗∗∗∗∗∗∗∗<br />
c subroutine GIVING THE CARBON DIFFUSIVITY IN AUSTENITE:<br />
subroutine DIFF(temp,var1 m,var3 m,del e,acti c,slope<br />
& ,phi ,d avg)<br />
integer II ,II2 , II3<br />
real D(1000),CARB(1000)<br />
real X,THET,DASH,eta ,R2,Z2,HH,KK,eta1 ,eta2 ,eta3 ,eta4<br />
real ACTI,DACTI,SIGMA,XINCR,var1 m,var3 m,acti c,slope,<br />
& phi ,A5,ans ,d avg<br />
HH=6 . 6 2 6 2 e −34<br />
KK=1 . 3 8 0 6 2 e −23<br />
Z2=12<br />
A5=1.0<br />
R2=8.31<br />
DASH=(KK∗temp/HH)∗EXP( −(21230/temp))∗EXP( −31.84)<br />
XINCR=(var1 m−var3 m)/5<br />
DO 1 1 1 I I =1 ,5<br />
CARB( I I )= var3 m+(II −1)∗XINCR<br />
X=CARB( I I )<br />
THET=X/ ( A5−X)<br />
151
1.7 Program Listing<br />
c the var1 , var3 <strong>and</strong> X are to be expressed in mol fractions .<br />
ACTI=a c t i c<br />
ACTI=EXP(ACTI)<br />
DACTI=s l o p e<br />
DACTI=DACTI∗ACTI<br />
DACTI=DACTI∗A5/ ( (A5+THET)∗∗2)<br />
SIGMA=p h i<br />
eta=A5+(Z2∗(A5+THET))<br />
eta2=(A5−((A5+Z2/2)∗THET)+( Z2 / 2 ) ∗(A5+Z2/2)∗(A5−SIGMA)<br />
& ∗THET∗∗2)<br />
eta3=ACTI∗(eta/eta2)<br />
eta1 =(A5+THET)∗DACTI<br />
eta4=eta1+eta3<br />
D( I I )=DASH∗ eta4<br />
c print ∗ ,’the dif coef in cm2/s <strong>and</strong> theta is:’,D(II)<br />
c write (113 ,∗ ), D(II), THET<br />
111 continue<br />
call TRAPE(var1 m,var3 m,XINCR,II,D,ans)<br />
d avg=ans/(var1 m−var3 m)<br />
RETURN<br />
END<br />
c ∗∗∗∗∗∗∗∗∗∗∗∗∗∗∗∗∗∗∗∗∗∗∗∗∗∗∗∗∗∗∗∗∗∗∗∗∗∗∗∗∗∗∗∗∗∗∗∗∗∗∗∗∗∗∗∗∗∗∗∗∗<br />
subroutine TRAPE(var1 m,var3 m,XINCR,II,D,ans)<br />
real var1 m,var3 m,XINCR,XX,sum,D(1000),ans1,ans<br />
INTEGER Q, I I<br />
sum=0<br />
do 999 Q=1,II −1<br />
152
XX=var3 m+(XINCR∗Q)<br />
sum=sum+D(Q)<br />
999 continue<br />
ans=XINCR∗( (D(1)+D(5)/2) + sum )<br />
return<br />
end<br />
1.7 Program Listing<br />
c ∗∗∗∗∗∗∗∗∗∗∗∗∗∗∗∗∗∗∗∗∗∗∗∗∗∗∗∗∗∗∗∗∗∗∗∗∗∗∗∗∗∗∗∗∗∗∗∗∗∗∗∗∗∗∗∗∗∗∗∗∗<br />
subroutine mixed growth(temp , carbon , d avg , res1 , res2 , velo )<br />
real y5,spac2 ,dcgb3 ,dcgb4 ,dcgb5 ,velo1 ,velo2 ,velo ,<br />
real c cem2 , c fer2 , delta<br />
real molfra ,wt fe2 , fe mol2 , c mol2 , carbon ,<br />
real lamda2,lamce2 ,lamfe2 ,teqm,u<br />
c cem2=6.67<br />
c fer2=0.025<br />
teqm=1000<br />
delta=2.5e−10<br />
call lamda crit spa(teqm,temp,spac2)<br />
lamda2=1e−6/((−0.1627∗temp)+162.74)<br />
call lamella thk(carbon ,c cem2 , c fer2 ,lamda2,lamce2)<br />
lamfe2=lamda2−lamce2<br />
print ∗ , ’the S in m is : ’ ,lamda2<br />
print ∗ , ’the S fer <strong>and</strong> S cem in m are : ’ , lamfe2 , lamce2<br />
u=r e s 1 / r e s 2<br />
wt fe2=100−carbon<br />
fe mol2=wt fe2/55.8<br />
c mol2=carbon/12.01<br />
molfra=c mol2/(fe mol2+c mol2)<br />
y5=molfra/(1− molfra)<br />
dcgb4 = 8.5133e−5∗exp(−96851/(8.312∗ temp ))<br />
print ∗ , ’The D gb <strong>of</strong> carbon in m2 s−1 is : ’ ,dcgb4<br />
153
1.7 Program Listing<br />
print ∗ , ’The D wei avg <strong>of</strong> carbon in m2 s−1 is : ’ ,<br />
& d avg∗1e−4<br />
velo1=((2∗ d avg∗0.0001)+(12∗ dcgb4∗ delta/lamda2))∗ lamda2<br />
velo2=(1−(spac2/lamda2))∗ (res1/res2)/(lamfe2∗ lamce2)<br />
velo=velo1∗ velo2<br />
return<br />
end<br />
c ∗∗∗∗∗∗∗∗∗∗∗∗∗∗∗∗∗∗∗∗∗∗∗∗∗∗∗∗∗∗∗∗∗∗∗∗∗∗∗∗∗∗∗∗∗∗∗∗∗∗∗∗∗∗∗∗∗∗∗∗∗<br />
154
Appendix D<br />
Program for Pearlite Growth in Ternary Steels<br />
1.1 Provenance <strong>of</strong> Source Code<br />
Ashwin S. P<strong>and</strong>it, Phase Transformations Group, <strong>Department</strong> <strong>of</strong> <strong>Materials</strong> <strong>Science</strong><br />
<strong>and</strong> <strong>Metallurgy</strong>, <strong>University</strong> <strong>of</strong> Cambridge, Cambridge, UK.<br />
1.2 Purpose<br />
The program calculates the isothermal growth rate <strong>of</strong> pearlite in Fe-C-X steels.<br />
1.3 Specification<br />
Self-contained program written in fortran.<br />
1.4 Description<br />
The program calculates the isothermal growth rate <strong>of</strong> pearlite in Fe-C-X steel. The<br />
growth rate is calculated based on the user inputs for interfacial compositions based<br />
on the tie-line selection from an isothermal section <strong>of</strong> a ternary phase diagram. The<br />
growth rate in ternary steels is controlled either by partitioning <strong>of</strong> substitutional<br />
solute (X) through the phase boundary (P-LE) or by carbon diffusion through the<br />
155
1.5 References<br />
austenite <strong>and</strong> the transformation interface involving negligible partitioning <strong>of</strong> X,<br />
(NP-LE).<br />
1.5 References<br />
1) R. H. Siller <strong>and</strong> R. B. McLellan, The application <strong>of</strong> first order mixing statistics<br />
to the variation <strong>of</strong> the diffusivity <strong>of</strong> carbon in austenite, Metallurgical Transactions,<br />
1970, 1, 985-988.<br />
2) W. W. Dunn <strong>and</strong> R. B. McLellan, The application <strong>of</strong> quasichemical solid solution<br />
model to carbon in austenite, Metallurgical Transactions, 1970, 1, 1263-126.<br />
3) H. K. D. H. Bhadeshia, Diffusion <strong>of</strong> carbon in austenite, Metal <strong>Science</strong>, 1981, 15,<br />
477-479.<br />
4) H. K. D. H. Bhadeshia, MAP programs, http://www.msm.cam.ac.uk/map/steel/functions/cg-<br />
b.html.<br />
5) R. Trivedi <strong>and</strong> G. M. Pound, Effect <strong>of</strong> concentration-dependent diffusion coeffi-<br />
cient on the migration <strong>of</strong> interphase boundaries, J. Appl. Phys., 1967, 38, 3569-3576.<br />
6) C. Zener, Kinetics <strong>of</strong> Decomposition <strong>of</strong> Austenite, Trans. AIME, 1946, 167, 550-<br />
595.<br />
7) M. Hillert, The role <strong>of</strong> interfaces in phase transformations, 1970, In mechanism<br />
<strong>of</strong> phase transformations in crystalline solids. Monograph <strong>and</strong> Report series, no. 33,<br />
231-247.<br />
8) N. A. Razik <strong>and</strong> G. W. Lorimer <strong>and</strong> N. Ridley, An investigation <strong>of</strong> manganese<br />
partitioning during the austenite-pearlite transformation using analytical electron<br />
microscopy, Acta Metallurgica, 1974, 22, 1249-1258.<br />
156
1.6 Parameters<br />
1.6.1 Input parameters<br />
argument in parentheses corresponds to the data type<br />
Carbon / wt%, (real)<br />
Manganese / wt% (real)<br />
Chromium / wt% (real)<br />
1) P-LE or 2) NP-LE<br />
Eutectoid temperature / K, (real)<br />
Transformation temperature / K, (real)<br />
1.6 Parameters<br />
P-LE: Interfacial compositions <strong>of</strong> X at α/γ + α <strong>and</strong> θ/γ + θ phase boundaries based<br />
on the isothermal section <strong>of</strong> a ternary phase diagram<br />
NP-LE: Interfacial compositions <strong>of</strong> C at α/γ +α <strong>and</strong> θ/γ +θ phase boundaries based<br />
on the isothermal section <strong>of</strong> a ternary phase diagram<br />
1.6.2 Output parameters<br />
Thickness <strong>of</strong> ferrite lamella, lamfe3 / m, (real)<br />
Thickness <strong>of</strong> cementite lamella, lamce3 / m, (real)<br />
P-LE: Pearlite growth rate, v pl / m s −1 , (real)<br />
NP-LE: Pearlite growth rate, v npl / m s −1 , (real)<br />
1.7 Program Listing<br />
program pearlite<br />
integer loop ,i ,j ,m,p,option , choice ,w,p1,p2,p3,p4,r ,s ,t<br />
real carbon ,c cem , c fer<br />
real coef ,coef1 ,coef2 ,coef3 ,coef4 ,coe ,coef5 ,coef7 , d coef<br />
157
eal af ac ,a f mn , c f mn<br />
1.7 Program Listing<br />
real tempf(1000), af fe(1000),af mn(1000) , af c(1000)<br />
real tempf1(1000),ac fe(1000),ac mn(1000) , ac c(1000)<br />
real tempf2(1000), fa fe(1000),fa mn(1000) , fa c(1000)<br />
real tempf3(1000),ca fe(1000),ca mn(1000) , ca c(1000)<br />
real df cf ,ddash1 ,ddash2 , del f,k,h,ddash,del e,v1,v2<br />
real v,v gb , stor , stor1 , st mn , st mn1 , st mn2 , st mn3 , k gb<br />
real v3,v4,v5, st c,st c1<br />
real c f c,c fe(1000),c c(1000),acti c<br />
real del T,temp,teqm,teqm1,si fc ,slope ,z1,df av<br />
real del hm , del vm , velo , delta , factor , lamda , lamfer<br />
real Mn,Cr,Si , f fe(1000),f c(1000),D(1000),lamcem<br />
real eta ,molfra ,ans ,ans2 ,part c,vcgb,dcgb,d eff<br />
real temp 1(1000),a fe(1000),a c(1000),temp 2(1000)<br />
real temp 3(1000),a1 fe(1000),a1 c(1000),temp 4(1000)<br />
real var1 ,var2 ,var3 ,var4 ,res1 ,res2 ,act ,R1,CG,CG1<br />
real c af , c ac , c fa , c ca , v pl , v npl , spcr ,var3 m,var1 m<br />
real d b<br />
c variables for storing interfacial compositions <strong>and</strong><br />
c velocity in ternary steels<br />
del f=21230<br />
h=6.63E−34<br />
z1=12<br />
c cem=6.67<br />
c fer=0.025<br />
open ( unit = 1 , f i l e = ’ output . txt ’ , access=’append ’)<br />
c ∗∗∗∗∗∗∗∗∗∗∗∗∗∗∗∗∗∗∗∗∗∗∗∗∗∗∗∗∗∗∗∗∗∗∗∗∗∗∗∗∗∗∗∗∗∗∗∗∗∗∗∗∗∗∗∗∗∗<br />
print ∗ ,’Enter the chemical composition:’<br />
158
print ∗ ,’Carbon’<br />
read ∗ ,carbon<br />
print ∗ ,’Manganese’<br />
read ∗ ,Mn<br />
print ∗ ,’Chromium’<br />
read ∗ ,Cr<br />
1.7 Program Listing<br />
c User input for the mechanism <strong>of</strong> pearlite growth<br />
print ∗ ,’Enter : 1 P−LE or 2 NP−LE : ’<br />
read ∗ , choice<br />
print ∗ ,’enter the eutectoid temperature in K’<br />
read ∗ , teqm<br />
do 61 loop=1,2<br />
print ∗ , ’enter the temperature : ’<br />
read ∗ , temp<br />
If (temp .GE. teqm) then<br />
print ∗ , ’Please enter temp greater than teqm: ’<br />
endif<br />
If (choice .EQ. 1) then<br />
d b=2.81e−3∗exp(−164434/(8.31∗ temp ))<br />
temp=temp−273<br />
lamda=10∗∗( −2.2358+(0.09863∗1.8)− log10((693−temp )/693))<br />
& ∗(1e−6)<br />
call lamella thk(carbon ,c cem , c fer ,lamda,lamcem)<br />
lamfer=lamda−lamcem<br />
159
1.7 Program Listing<br />
call PLE(temp,lamda,lamfer ,lamcem,d b,v pl)<br />
print ∗ ,’the velocity <strong>of</strong> pearlite assuming P−LE i s :<br />
&m2 s−1’,v pl<br />
elseif (choice .EQ. 2) then<br />
print ∗ ,’carbon in aus. in equilibrium with ferrite ’<br />
read ∗ ,var1<br />
print ∗ ,’carbon in aus. in equilibrium with cementite ’<br />
read ∗ ,var3<br />
c res1 calculates the diff . in interfacial compositions<br />
c in Fe−C alloy<br />
c ∗∗∗∗∗∗∗∗∗∗∗∗∗∗∗∗∗∗∗∗∗∗∗∗∗∗∗∗∗∗∗∗∗∗∗∗∗∗∗∗∗∗∗∗∗∗∗∗∗∗∗∗∗∗<br />
res1=var1−var3<br />
res2=6.67−0.025<br />
call mol frac c(var1,var3,var1 m,var3 m)<br />
c calculates the mol fraction <strong>of</strong> carbon in austenite<br />
c var1 is the carbon in austenite in wt%<br />
call lamda crit spa(teqm,temp,spac)<br />
lamda=spac∗3<br />
call lamella thk(carbon ,c cem , c fer ,lamda,lamcem)<br />
lamfer=lamda−lamcem<br />
call vol diff(var1 m,var3 m,carbon,res1,res2,temp,ans2)<br />
c calculates the pearlite growth rate using volume<br />
c diffusivity <strong>of</strong> C in austenite<br />
call mixed growth(temp , carbon , ans2 , res1 , res2 , velo )<br />
print ∗ ,’the velocity <strong>of</strong> pearlite in NP−LE mode i s :<br />
&m2 s−1’,velo<br />
160
write (1 ,∗ ),temp−273, velo<br />
else<br />
stop<br />
endif<br />
61 enddo<br />
close (1)<br />
stop<br />
end<br />
1.7 Program Listing<br />
c ∗∗∗∗∗∗∗∗∗∗∗∗∗∗∗∗∗∗∗∗∗∗∗∗∗∗∗∗∗∗∗∗∗∗∗∗∗∗∗∗∗∗∗∗∗∗∗∗∗∗∗∗∗∗∗∗∗∗∗∗∗<br />
subroutine vol diff(var1 m,var3 m,carbon,res1,res2,temp,ans2)<br />
real v1,v2,v,lamda,lamcem,lamfer ,phi<br />
real d eff , delta<br />
delta=2.5e−10<br />
teqm=1000<br />
del vm=7.1E−6<br />
c cem=6.67<br />
c fer=0.025<br />
del e=8352<br />
k=1.38E−23<br />
call lamda crit spa(teqm,temp,spac)<br />
lamda=spac∗3<br />
call lamella thk(carbon ,c cem , c fer ,lamda,lamcem)<br />
c calculates the thickness <strong>of</strong> ferrite <strong>and</strong> cementite lamella<br />
lamfer=lamda−lamcem<br />
call phi c(del e,k,temp,phi)<br />
c calculates the value <strong>of</strong> sigma: site exclusion<br />
c probability , used in calculation <strong>of</strong> eta<br />
161
call act c(var1 m,temp,del e,acti c)<br />
1.7 Program Listing<br />
c calculates the activity <strong>of</strong> carbon in austenite<br />
c using a quasi chemical model:MAP<br />
c print ∗ ,’the activity is:’,acti c<br />
call DCG(var1 m,del e,temp,R,slope)<br />
c calculates the differential <strong>of</strong> activity <strong>of</strong> carbon<br />
c in austenite<br />
c print ∗ , ’the slope is : ’ , slope<br />
call DIFF(temp,var1 m,var3 m,del e,acti c,slope,phi,ans2)<br />
print ∗ , ’the weighted avg. diff coef in cm2/s is : ’ ,ans2<br />
return<br />
end<br />
c ∗∗∗∗∗∗∗∗∗∗∗∗∗∗∗∗∗∗∗∗∗∗∗∗∗∗∗∗∗∗∗∗∗∗∗∗∗∗∗∗∗∗∗∗∗∗∗∗∗∗∗∗∗∗∗∗∗∗∗∗∗∗<br />
subroutine mol frac c(var1,var3,var1 m,var3 m)<br />
real wt fe , fe mol , c mol , wt fe1 , fe mol1 , c mol1<br />
wt fe=100−var1<br />
fe mol=wt fe/55.8<br />
c mol=var1/12.01<br />
var1 m=c mol/( fe mol+c mol)<br />
wt fe1=100−var3<br />
fe mol1=wt fe1/55.8<br />
c mol1=var3/12.01<br />
var3 m=c mol1/(fe mol1+c mol1)<br />
return<br />
end<br />
c ∗∗∗∗∗∗∗∗∗∗∗∗∗∗∗∗∗∗∗∗∗∗∗∗∗∗∗∗∗∗∗∗∗∗∗∗∗∗∗∗∗∗∗∗∗∗∗∗∗∗∗∗∗∗∗∗∗∗∗∗∗<br />
162
1.7 Program Listing<br />
subroutine lamda crit spa(teqm,temp,spac)<br />
real spac ,del T,del hm ,teqm , del vm<br />
si fc=0.60<br />
del hm=4300<br />
del vm=7.1E−6<br />
del T=teqm−temp<br />
c print ∗ ,’the new teqm is:’,teqm<br />
spac=2 ∗ si fc ∗ teqm ∗ del vm / (del T ∗del hm)<br />
return<br />
end<br />
c ∗∗∗∗∗∗∗∗∗∗∗∗∗∗∗∗∗∗∗∗∗∗∗∗∗∗∗∗∗∗∗∗∗∗∗∗∗∗∗∗∗∗∗∗∗∗∗∗∗∗∗∗∗∗∗∗∗∗∗∗∗∗<br />
subroutine lamella thk(carbon ,c cem , c fer ,lamda,lamcem)<br />
real wt frac fer , vol frac fer , vol frac cem<br />
real r fer ,lamda,lamcem,carbon<br />
wt frac fer=(c cem−carbon )/(c cem−c fer)<br />
vol frac fer=wt frac fer<br />
c densities <strong>of</strong> ferrite <strong>and</strong> austenite are nearly same<br />
vol frac cem=1− vol frac fer<br />
r fer=vol frac fer/vol frac cem<br />
lamcem=lamda/( r fer+1)<br />
print ∗ ,’lamcem in sub is:’,lamcem<br />
return<br />
end<br />
c ∗∗∗∗∗∗∗∗∗∗∗∗∗∗∗∗∗∗∗∗∗∗∗∗∗∗∗∗∗∗∗∗∗∗∗∗∗∗∗∗∗∗∗∗∗∗∗∗∗∗∗∗∗∗∗∗∗∗∗∗∗<br />
subroutine phi c(del e,k2,temp,phi1)<br />
real k2,phi1<br />
phi1=1−exp( (− del e)/(k2∗temp) )<br />
c print ∗ , ’the value <strong>of</strong> phi is : ’ , phi<br />
c print ∗ , ’the value <strong>of</strong> temp is : ’ ,temp<br />
163
eturn<br />
end<br />
1.7 Program Listing<br />
c FUNCTION GIVING THE DIFFERENTIAL OF NATURAL<br />
c LOGARITHM (ACTIVITY OF CARBON IN AUSTENITE):<br />
subroutine DCG(var1 m,del e,temp,R1,slope)<br />
real DG,DDG,var1 m,temp,slope,phi10<br />
R1=8.14<br />
phi10=1.0−EXP(− del e/(R1∗temp ))<br />
DG=SQRT( 1 . 0 −2.0∗(1.0+2.0∗ phi10)∗ var1 m+<br />
& (1.0+8.0∗ phi10)∗ var1 m ∗∗2)<br />
DDG=( 0 . 5 /DG) ∗( −2.0−4.0∗ phi10+2.0∗ var1 m+16.0∗<br />
& phi10∗var1 m)<br />
slope=−((10.0/(1.0−2.0∗ var1 m))+(5.0/var1 m))+<br />
& 6.0∗ ((DDG+3.0)/(DG−1.0+3.0∗ var1 m<br />
& )−(DDG−3.0)/(DG+1.0−3.0∗ var1 m))<br />
return<br />
end<br />
c ∗∗∗∗∗∗∗∗∗∗∗∗∗∗∗∗∗∗∗∗∗∗∗∗∗∗∗∗∗∗∗∗∗∗∗∗∗∗∗∗∗∗∗∗∗∗∗∗∗∗∗∗∗∗∗∗∗∗∗∗∗∗∗∗∗∗<br />
c FUNCTION GIVING THE NATURAL LOGARITHM<br />
c (ACTIVITY OF CARBON IN AUSTENITE):<br />
subroutine act c(var1 m,temp,del e,CG)<br />
real var1 m,AJ,DG,EG,EG1,R,W,CG<br />
R=8.31<br />
AJ=1−EXP(− del e/(R∗temp ))<br />
IF(var1 m .LE. 1.0e−10) THEN<br />
CG=LOG( 1 . 0 e −10)<br />
ELSE<br />
164
DG=SQRT( 1 . 0 −2.0∗(1.0+2.0∗AJ)∗ var1 m+<br />
& (1.0+8.0∗AJ)∗ var1 m ∗∗2)<br />
1.7 Program Listing<br />
EG=5∗LOG((1 −2∗ var1 m)/var1 m)+6∗ del e/(R∗temp)<br />
EG1= (38575 −13.48∗temp )/(R∗temp)<br />
CG=EG+EG1+6∗LOG( (DG−1+3∗var1 m)/(DG+1−3∗var1 m))<br />
ENDIF<br />
RETURN<br />
END<br />
c ∗∗∗∗∗∗∗∗∗∗∗∗∗∗∗∗∗∗∗∗∗∗∗∗∗∗∗∗∗∗∗∗∗∗∗∗∗∗∗∗∗∗∗∗∗∗∗∗∗∗∗∗∗∗∗∗∗∗∗∗∗∗<br />
c subroutine GIVING THE CARBON DIFFUSIVITY IN AUSTENITE:<br />
subroutine DIFF(temp,var1 m,var3 m,del e,acti c,slope,<br />
& phi ,ans2)<br />
integer II ,II2 , II3<br />
real D(1000),CARB(1000)<br />
real X,THET,DASH,eta ,R2,Z2,HH,KK,eta1 ,eta2<br />
real eta3 ,eta4 ,ans ,ans2<br />
real ACTI,DACTI,SIGMA,XINCR,var1 m,var3 m<br />
real acti c,slope,phi,A5<br />
HH=6 . 6 2 6 2 e −34<br />
KK=1 . 3 8 0 6 2 e −23<br />
Z2=12<br />
A5=1.0<br />
R2=8.31<br />
DASH=(KK∗temp/HH)∗EXP( −(21230/temp))∗EXP( −31.84)<br />
XINCR=(var1 m−var3 m)/5<br />
DO 1 1 1 I I =1 ,5<br />
CARB( I I )= var3 m+(II −1)∗XINCR<br />
X=CARB( I I )<br />
165
THET=X/ ( A5−X)<br />
1.7 Program Listing<br />
c the var1 , var3 <strong>and</strong> X are to be expressed in mol fractions .<br />
ACTI=a c t i c<br />
ACTI=EXP(ACTI)<br />
DACTI=s l o p e<br />
DACTI=DACTI∗ACTI<br />
DACTI=DACTI∗A5/ ( (A5+THET)∗∗2)<br />
SIGMA=p h i<br />
eta=A5+(Z2∗(A5+THET))<br />
eta2=(A5−((A5+Z2/2)∗THET)+( Z2 / 2 ) ∗(A5+Z2/2)∗(A5−SIGMA)∗<br />
&THET∗∗2)<br />
eta3=ACTI∗(eta/eta2)<br />
eta1 =(A5+THET)∗DACTI<br />
eta4=eta1+eta3<br />
D( I I )=DASH∗ eta4<br />
write (113 ,∗ ), D(II), THET<br />
111 continue<br />
call TRAPE(var1 m,var3 m,XINCR,II,D,ans)<br />
ans2=ans/(var1 m−var3 m)<br />
RETURN<br />
END<br />
c ∗∗∗∗∗∗∗∗∗∗∗∗∗∗∗∗∗∗∗∗∗∗∗∗∗∗∗∗∗∗∗∗∗∗∗∗∗∗∗∗∗∗∗∗∗∗∗∗∗∗∗∗∗∗∗∗∗∗∗∗<br />
subroutine TRAPE(var1 m,var3 m,XINCR,II,D,ans)<br />
real var1 m,var3 m,XINCR,XX,sum,D(1000),ans1,ans<br />
INTEGER Q, I I<br />
sum=0<br />
do 999 Q=1,II −1<br />
XX=var3 m+(XINCR∗Q)<br />
166
sum=sum+D(Q)<br />
999 continue<br />
ans=XINCR∗( (D(1)+D(5)/2) + sum )<br />
return<br />
end<br />
1.7 Program Listing<br />
c ∗∗∗∗∗∗∗∗∗∗∗∗∗∗∗∗∗∗∗∗∗∗∗∗∗∗∗∗∗∗∗∗∗∗∗∗∗∗∗∗∗∗∗∗∗∗∗∗∗∗∗∗∗∗∗∗∗∗∗∗∗<br />
subroutine mixed growth(temp , carbon , ans2 , res1 , res2 , velo )<br />
real y5,spac2 ,dcgb3 ,dcgb4 ,dcgb5 ,velo1 ,velo2 , velo<br />
real c cem2 , c fer2 , delta<br />
real molfra ,wt fe2 , fe mol2 , c mol2 , carbon , lamda2<br />
real lamce2 ,lamfe2 ,teqm<br />
c cem2=6.67<br />
c fer2=0.025<br />
teqm=1000<br />
delta=2.5e−10<br />
print ∗ , ’the teqm is : ’ ,teqm<br />
call lamda crit spa(teqm,temp,spac2)<br />
lamda2=spac2∗3<br />
c max. entropy production criterion<br />
call lamella thk(carbon ,c cem2 , c fer2 ,lamda2,lamce2)<br />
lamfe2=lamda2−lamce2<br />
print ∗ ,’the value <strong>of</strong> lamce2,lamda2 is:’,lamfe2,<br />
& lamce2 ,lamda2<br />
wt fe2=100−carbon<br />
fe mol2=wt fe2/55.8<br />
c mol2=carbon/12.01<br />
molfra=c mol2/(fe mol2+c mol2)<br />
y5=molfra/(1− molfra)<br />
167
dcgb4 = 2.961e−6∗exp(−72865/(8.31∗ temp ))<br />
print ∗ , ’dcgb 4 is : ’ ,dcgb4 ,ans2<br />
1.7 Program Listing<br />
velo1=((2∗ ans2∗0.0001)+(12∗ dcgb4∗ delta/lamda2))∗ lamda2<br />
velo2=(1−(spac2/lamda2))∗ (res1/res2)/(lamfe2∗ lamce2)<br />
velo=velo1∗ velo2<br />
return<br />
end<br />
c ∗∗∗∗∗∗∗∗∗∗∗∗∗∗∗∗∗∗∗∗∗∗∗∗∗∗∗∗∗∗∗∗∗∗∗∗∗∗∗∗∗∗∗∗∗∗∗∗∗∗∗∗∗∗∗∗∗∗∗∗<br />
subroutine PLE(temp,lamda3 , lamfer3 ,lamcem3,d b,v pl)<br />
real v pl1 , c af , c ac , c fa , c ca ,lamda3 , lamfer3<br />
real lamcem3, v pl<br />
real spcr ,d b<br />
delta=2.5e−10<br />
print ∗ ,’composition <strong>of</strong> X in aus. in equilibrium<br />
& with ferrite : ’<br />
read ∗ , c af<br />
print ∗ ,’composition <strong>of</strong> X in aus. in equilibrium<br />
& with cementite : ’<br />
read ∗ , c ac<br />
print ∗ ,’composition <strong>of</strong> X in ferrite in equilibrium<br />
& with aus: ’<br />
read ∗ , c fa<br />
print ∗ ,’composition <strong>of</strong> X in cementite in equilibrium<br />
& with aus: ’<br />
read ∗ , c ca<br />
spcr=lamda3/2<br />
print ∗ ,’lamda lamfer3 in ple are:’,lamda3,lamfer3<br />
v pl1=12∗d b∗ delta∗(( c af−c ac )/(c ca−c fa ))<br />
v pl=v pl1∗(1/(lamfer3∗lamcem3))∗(1−(spcr/lamda3))<br />
print ∗ ,’v is:’,v pl<br />
return<br />
168
end<br />
169<br />
1.7 Program Listing
Bibliography<br />
[1] H. C. Sorby. On the application <strong>of</strong> very high powers to the study <strong>of</strong> microscopic<br />
structure <strong>of</strong> steel. J. Iron Steel Inst., 1:140–147, 1886. 1<br />
[2] M. Hillert. The formation <strong>of</strong> pearlite. In H. I. Aaronson V. F. Zackay, editor,<br />
Decomposition <strong>of</strong> Austenite by Diffusional Processes, pages 197–237, New York,<br />
1962. Interscience. 1<br />
[3] M. V. Kral, M. A. Mangan, <strong>and</strong> G. Spanos <strong>and</strong>. Three-dimensional analysis<br />
<strong>of</strong> microstructures. <strong>Materials</strong> Characterisation, 45:17–23, 2000.<br />
[4] M. D. Graef, M. V. Kral, <strong>and</strong> M. Hillert. A modern 3-D view <strong>of</strong> an old pearlite<br />
colony. J. Metals, 58:25–28, 2006. 1<br />
[5] R. E. Smallman <strong>and</strong> R. J. Bishop. Modern Physical <strong>Metallurgy</strong> <strong>and</strong> <strong>Materials</strong><br />
Engineering. Butterworth–Heinemann, 6th edition, 1999. 2<br />
[6] C. Zener. Kinetics <strong>of</strong> decomposition <strong>of</strong> austenite. Trans. AIME, 167:550–595,<br />
1946. 3, 25, 47, 52, 56, 59<br />
[7] M. Hillert. The role <strong>of</strong> interfacial energy during solid state phase transforma-<br />
tions. Jernkont Ann., 141:757–89, 1957. 3, 23, 28, 94, 117<br />
[8] M. Hillert. The mechanism <strong>of</strong> phase transformation in crystalline solids. pages<br />
231–247, London, 1969. Institute <strong>of</strong> Metals. 3, 56<br />
[9] N. Ridley. A review <strong>of</strong> the data on the interlamellar spacing <strong>of</strong> pearlite. Met-<br />
allurgical Transactions A, 15A:1019–1036, 1984.<br />
170
BIBLIOGRAPHY<br />
[10] J. W. Christian. Theory <strong>of</strong> transformations in metals <strong>and</strong> alloys. Part I.<br />
Pergamon Press, Oxford, U. K., 3rd edition, 2003.<br />
[11] J. W. Christian. The theory <strong>of</strong> trasformations in metals <strong>and</strong> alloys. Part II.<br />
Pergamon Press, Oxford, U. K., 3rd edition, 2003. 3, 47<br />
[12] J. H. Frye, Jr., E. E. Stansbury, <strong>and</strong> D. L. McElroy. Absolute rate theory<br />
applied to rate <strong>of</strong> growth <strong>of</strong> pearlite. Trans. AIME, 197:219–224, 1953. 3, 47,<br />
66, 68<br />
[13] D. Brown <strong>and</strong> N. Ridley. Kinetics <strong>of</strong> the pearlite reaction in high-purity nickel<br />
eutectoid steels. J. Iron Steel Inst., 207:1232–1240, 1969. 48, 56, 63, 75, 78<br />
[14] D. D. Pearson <strong>and</strong> J. D. Verhoeven. Forced velocity pearlite in high purity Fe–<br />
C alloys: part 1. experimental. Metallurgical Transactions A, 15:1037–1045,<br />
1984. 3, 47, 50<br />
[15] B. E. Sundquist. The edgewise growth <strong>of</strong> pearlite. Acta Metallurgica, 16:1413–<br />
1427, 1968. 3, 26, 45, 46, 47, 66<br />
[16] M. Hillert. On theories <strong>of</strong> growth during discontinuous precipitation. Metal-<br />
lurgical Transactions, 3:2729–2741, 1972. 3, 23, 24, 27, 47, 48<br />
[17] N. A. Razik, G. W. Lorimer, <strong>and</strong> N. Ridley. An investigation <strong>of</strong> manganese<br />
partitioning during the austenite-pearlite transformation using analytical elec-<br />
tron microscopy. Acta Metallurgica, 22:1249–1258, 1974. 4, 35, 83, 84, 87, 94,<br />
100<br />
[18] N. A. Razik, G. W. Lorimer, <strong>and</strong> N. Ridley. Chromium partitioning during the<br />
austenite-pearlite transformation. Metallurgical Transactions A, 7A:209–214,<br />
1976. 36, 83, 84, 87, 102, 103, 106, 118<br />
[19] M. L. Picklesimer, D. L. McElroy, Jr. T. M. Kegley, E. E. Stansbury, <strong>and</strong> J. H.<br />
Frye. Effect <strong>of</strong> manganese on the austenite-pearlite transformation. Transac-<br />
tions <strong>of</strong> the Metallurgical Society <strong>of</strong> AIME, 218:473–480, June 1960. 4, 83<br />
171
BIBLIOGRAPHY<br />
[20] J. W. Cahn. On the kinetics <strong>of</strong> the pearlite reaction. Trans. A. I. M. E.,<br />
209:140–144, 1957. 9<br />
[21] S. E. Offerman, L. J. G. W. van Wilderen, N. H. van Dijk, J. Sietsma, M. Th.<br />
Rekveldt, <strong>and</strong> S. van der Zwaag. In-situ study <strong>of</strong> pearlite nucleation <strong>and</strong><br />
growth during isothermal austenite decomposition in nearly eutectoid steel.<br />
Acta Materialia, 51:3927–3938, 2003. 9, 10, 57<br />
[22] W. F. Lange III, M. Enomoto, <strong>and</strong> H. I. Aaronson. Precipitate nucleation ki-<br />
netics at grain boundaries. International <strong>Materials</strong> Reviews, 34:125–147, 1989.<br />
9, 11<br />
[23] P. C. Clemm <strong>and</strong> J. C. Fisher. The influence <strong>of</strong> grain boundaries on the<br />
nucleation <strong>of</strong> secondary phases. Acta Metallurgica, 3:70–73, 1955. 9, 13, 14<br />
[24] H. I. Aaronson <strong>and</strong> J. K. Lee. Lectures on the theory <strong>of</strong> phase transformations.<br />
pages 165–229, 1999. 9<br />
[25] S. E. Offerman, N. H. van Dijk, J. Sietsma, S. Grigull, E. M. Lauridsen, L. Mar-<br />
gulies, H. F. Poulsen, M. Th. Rekveldt, <strong>and</strong> S. van der Zwaag. Grain nucleation<br />
<strong>and</strong> growth during phase transformations. <strong>Science</strong>, 298:1003–1005, 2002. 10,<br />
63<br />
[26] R. F. Mehl <strong>and</strong> W. D. Hagel. The austenite:pearlite reaction. In B. Chalmers<br />
<strong>and</strong> R. King, editors, Progress in Metal Physics, volume 6, pages 74–134, New<br />
York, 1956. Pergamon Press. 11<br />
[27] J. W. Cahn <strong>and</strong> W. C. Hagel. Theory <strong>of</strong> pearlite reaction. In V. F. Zackay <strong>and</strong><br />
H. I. Aaronson, editors, Decomposition <strong>of</strong> Austenite by Diffusional Processes,<br />
pages 131–192, New York, 1962. Intersciences. 12, 26, 29, 31, 66, 72<br />
[28] R. F. Mehl <strong>and</strong> A. Dubé. The eutectoid reaction. In J. E. Mayer R. Smolu-<br />
chowski <strong>and</strong> W. A. Weyl, editors, In Phase Transformation in Solids, pages<br />
545–582, 1951. 14<br />
172
BIBLIOGRAPHY<br />
[29] G. V. Smith <strong>and</strong> R. F. Mehl. Lattice relationships in decomposition <strong>of</strong> austenite<br />
to pearlite, bainite <strong>and</strong> martensite. Trans. A.I.M.E., 150:211–226, 1942. 14<br />
[30] C. S. Smith. Microstructure. Trans. A. S. M., 45:533–575, 1953. 15, 114<br />
[31] M. Hillert. Application <strong>of</strong> Gibbs energy-composition diagrams. Lectures on the<br />
Theory <strong>of</strong> Phase Transformations, pages 1–33, 1999. 15<br />
[32] M. E. Nicholson. On the nucleation <strong>of</strong> pearlite. Journal <strong>of</strong> Metals, 6:1071–1074,<br />
1954. 15<br />
[33] K. C. Russell. private communication. August 1973. 16<br />
[34] P. R. Engel. The effect <strong>of</strong> interrupted quenching on the pearlite transformation.<br />
PhD thesis, M.I.T, September 1973. 17<br />
[35] F. B. Pickering T. Gladman, I. D. Mcivor. Some aspects <strong>of</strong> the structure-<br />
property relationships in high-carbon ferrite-pearlite steels. J. Iron Steel Inst.,<br />
210:916–930, 1972. 16<br />
[36] K. K. Ray <strong>and</strong> D. Mondal. The effect <strong>of</strong> interlamellar spacing on strength<br />
<strong>of</strong> pearlite in annealed eutectoid <strong>and</strong> hypoeutectoid plain carbon steels. Acta<br />
Metallurgica et Materialia, 39:2201–2208, 1991. 16<br />
[37] B. L. Bramfit <strong>and</strong> A. R. Marder. A transmission electron microscopy study on<br />
the substructure <strong>of</strong> high purity pearlite. Metallography, 6:483–495, 1973. 18<br />
[38] T. Takahashi, D. Ponge, <strong>and</strong> D. Raabe. Investigation <strong>of</strong> orientation gradients<br />
in pearlite in hypoeutectoid steel by use <strong>of</strong> orientation imaging microscopy.<br />
Steel Research International, 78(1):38–44, 2007. 18<br />
[39] S. Z. Bokshtein. Diffusion <strong>and</strong> Structure <strong>of</strong> Metals. Metallurgiya Publishers,<br />
Moscow, 1973. 19, 22, 95<br />
[40] J. Agren. A revised expression for the difusivity <strong>of</strong> carbon in binary Fe-C<br />
austenite. Scripta Metallurgica, 20:1507–1510, 1986. 20, 48<br />
173
BIBLIOGRAPHY<br />
[41] R. Trivedi <strong>and</strong> G. M. Pound. Effect <strong>of</strong> concentration-dependent diffusion coeffi-<br />
cient on the migration <strong>of</strong> interphase boundaries. J. Appl. Phys., 38:3569–3576,<br />
1967. 20, 54<br />
[42] R. H. Siller <strong>and</strong> R. B. McLellan. The application <strong>of</strong> first order mixing statis-<br />
tics to the variation <strong>of</strong> the diffusivity <strong>of</strong> carbon in austenite. Metallurgical<br />
Transactions, 1:985–988, 1970. 20, 53<br />
[43] H. K. D. H. Bhadeshia. Diffusion <strong>of</strong> carbon in austenite. Metal <strong>Science</strong>, 15:477–<br />
479, 1981. 21, 53<br />
[44] J. Fridberg, L. E. Torndahl, <strong>and</strong> M. Hillert. Diffusion in iron. Jernkont Ann.,<br />
153:263–276, 1969. 22, 36, 92, 102, 122<br />
[45] S. Z. Bokshtein, S. T. Kishkin, <strong>and</strong> L. M. Moroz. Investigation <strong>of</strong> the structure<br />
<strong>of</strong> metals using radioiostopes. Technical report, Moscow, 1955. 22, 23<br />
[46] N. Ridley. The pearlite transformation. In A. R. Marder <strong>and</strong> J. I. Goldstein,<br />
editors, Phase transformations in ferrous alloys, pages 201–236, Warrendale,<br />
PA, 1984. TMS-AIME. 25, 63, 94, 95, 100<br />
[47] M.P. Puls <strong>and</strong> J.S. Kirkaldy. The pearlite reaction. Metallurgical Transactions,<br />
3(11):2777–2796, 1972. 25, 64<br />
[48] D. Cheetham <strong>and</strong> N. Ridley. Isovelocity <strong>and</strong> isothermal pearlite growth in a<br />
eutectoid steel. J. Iron Steel Inst., 211:648–652, 1973. 25<br />
[49] B. L. Bramfitt <strong>and</strong> A. R. Marder. Effect <strong>of</strong> cooling rate <strong>and</strong> alloying on the<br />
transformation <strong>of</strong> austenite. Metallurgical Transactions, 4:2291–2301, 1973. 26<br />
[50] G. F. Bolling <strong>and</strong> R. H. Richman. Forced velocity pearlite. Metallurgical <strong>and</strong><br />
<strong>Materials</strong> Transactions B, 1(8):2095–2104, 1970. 26<br />
[51] J. D. Verhoeven <strong>and</strong> D. D. Pearson. Forced velocity pearlite in high purity<br />
Fe-C alloys. Metallurgical Transactions, 15A:1047–54, 1984. 26, 114, 118<br />
174
BIBLIOGRAPHY<br />
[52] J. W. Cahn. The kinetics <strong>of</strong> cellular segregation reactions. Acta Metallurgica,<br />
7:18–28, 1959. 26<br />
[53] D. Turnbull. Theory <strong>of</strong> cellular precipitation. Acta Metallurgica, 3:55–63, 1955.<br />
27, 47<br />
[54] W. Seith <strong>and</strong> J. G. Laird. Z. Metallkunde, 24:193, 1932. 27<br />
[55] K. Nakajima, M. Apel, <strong>and</strong> I. Steinbach. The role <strong>of</strong> carbon diffusion in ferrite<br />
on the kinetics <strong>of</strong> cooperative growth <strong>of</strong> pearlite: A multi-phase field study.<br />
Acta Materialia, 54:3665–3672, 2006. 30, 71, 72, 73, 79<br />
[56] I. Steinbach <strong>and</strong> M. Apel. The influence <strong>of</strong> lattice strain on pearlite formation<br />
in Fe–C. Acta Materialia, 55:4817–4822, 2007. 31<br />
[57] K. Hashiguchi <strong>and</strong> J. S. Kirkaldy. Pearlite growth by combined volume <strong>and</strong><br />
phase boundary diffusion. Sc<strong>and</strong>inavian Journal <strong>of</strong> <strong>Metallurgy</strong>, 13:240–248,<br />
1984. 31, 51, 52, 57, 63, 65, 66<br />
[58] D. Brown <strong>and</strong> N. Ridley. Rates <strong>of</strong> nucleation <strong>and</strong> growth <strong>and</strong> interlamellar<br />
spacings <strong>of</strong> pearlite in a low-alloy eutectoid steel. J. Iron Steel Inst., 204:811–<br />
816, 1966. 31, 47, 63, 66, 67, 68<br />
[59] M. Hillert. Swedish institute <strong>of</strong> metals research. Internal report, 1953. 32, 82<br />
[60] J. S. Kirkaldy <strong>and</strong> R. C. Sharma. Stability principles for lamellar eutectoid(ic)<br />
reactions. Acta Metallurgica, 28:1009–1021, 1980. 93, 94<br />
[61] G. R. Purdy, D. H. Weichert, <strong>and</strong> J. S. Kirkaldy. The growth <strong>of</strong> proeutec-<br />
toid ferrite in ternary iron-carbon-manganese austenites. Trans. TMS-AIME,<br />
230:1025–1034, 1964. 33<br />
[62] D. E. Coates. Diffusional growth limitation <strong>and</strong> hardenability. Metallurgical<br />
Transactions, 4:2313–2325, 1973. 32, 82, 86, 87<br />
175
BIBLIOGRAPHY<br />
[63] J. S. Kirkaldy. Diffusion in multicomponent metallic systems: I. phenomeno-<br />
logical theory for substitutional solid solution alloys. Canadian Journal <strong>of</strong><br />
Physics, 36:899–906, 1958. 33<br />
[64] A. S. P<strong>and</strong>it <strong>and</strong> H. K. D. H. Bhadeshia. Mixed diffusion-controlled growth<br />
<strong>of</strong> pearlite in binary steel. Proceedings <strong>of</strong> Royal Society A, 467:508–521, 2011.<br />
33, 54, 71, 82, 94, 95, 99, 114<br />
[65] R. C. Sharma <strong>and</strong> G. R. Purdy. Nucleation limitation <strong>and</strong> hardenability. Met-<br />
allurgical Transactions, 4:2303–2311, 1973. 33<br />
[66] S. A. Al-Salman, G. W. Lorimer, <strong>and</strong> N. Ridley. Pearlite growth kinetics<br />
<strong>and</strong> partitioning in a Cr-Mn eutectoid steel. Metallurgical Transactions A,<br />
10A:1703–1709, 1979. 37, 85<br />
[67] R. A. Ricks. Redistribution <strong>of</strong> substitutional alloying elements during forma-<br />
tion <strong>of</strong> pearlite. In Quantitative Microanalysis with High Spatial Resolution,<br />
pages 85–89, March 1981. 37<br />
[68] S. K. Tiwari <strong>and</strong> R. C. Sharma. The effect <strong>of</strong> alloying elements on pearlite<br />
growth. Metallurgical Transactions A, 16A:597–603, 1985. 37<br />
[69] R. C. Sharma. PhD thesis, McMaster <strong>University</strong>, Hamilton, On, Canada, 1976.<br />
37<br />
[70] R. C. Sharma, G. C. Purdy, <strong>and</strong> J. S. Kirkaldy. Kinetics <strong>of</strong> the pearlite reaction<br />
in Fe-C-Cr. Metallurgical Transactions, 10A:1129–1139, 1979. 37, 83<br />
[71] C. R. Hutchinson, R. E. Hackenberg, <strong>and</strong> G. J. Shiflet. The growth <strong>of</strong> par-<br />
titioned pearlite in Fe-C-Mn steels. Acta Materialia, 52:3565–3585, 2004. 37,<br />
40, 86, 89, 90<br />
[72] J. W. Cahn <strong>and</strong> W. G. Hagel. Divergent pearlite in a manganese eutectoid<br />
steel. Acta Materialia, 11:561–574, 1963. 39, 107<br />
176
BIBLIOGRAPHY<br />
[73] M. Hillert. An analysis <strong>of</strong> the effect <strong>of</strong> alloying elements on the pearlite reaction.<br />
In H. I. Aaronson, D. Laughlin, R. Sekerka, <strong>and</strong> C. Waymen, editors, Solid-<br />
Solid Phase Transformations, pages 789–806, Warrendale, Pennsylvania 15086,<br />
August 1981. The Metallurgical Society <strong>of</strong> AIME. 39<br />
[74] H. K. D. H. Bhadeshia. Diffusional formation <strong>of</strong> ferrite in iron <strong>and</strong> its alloys.<br />
Progress in <strong>Materials</strong> <strong>Science</strong>, 29:321–386, 1985. 42, 50, 88<br />
[75] K. A. Jackson <strong>and</strong> J. D. Hunt. Trans. Amer. Inst. Min. (Metall.) Engrs.,<br />
236:1129–1139, 1966. 45<br />
[76] S<strong>of</strong>tware. MTDATA. National Physical Laboratory (NPL), Teddington, UK,<br />
2006. 48, 52, 54, 59, 63, 94, 95, 102, 122<br />
[77] J. J. Kramer, G. M. Pound, <strong>and</strong> R. F. Mehl. The free energy <strong>of</strong> formation <strong>and</strong><br />
the interfacial enthalpy in pearlite. Acta Metallurgica, 6:763–771, 1958. 48, 59,<br />
62<br />
[78] C. Capdevila, F. G. Caballero, <strong>and</strong> C. Garcia de Andres. Kinetics model <strong>of</strong><br />
isothermal pearlite formation in a 0.4C-1.6Mn steel. Acta Materialia, 50:4629–<br />
4641, 2002. 48, 63, 94<br />
[79] H. B. Aaron <strong>and</strong> H. I. Aaronson. Growth <strong>of</strong> grain boundary precipitates in<br />
Al-4%Cu by interfacial diffusion. Acta Metallurgica, 16:789–798, 1968. 50<br />
[80] J. Goldman, H. I. Aaronson, <strong>and</strong> H. B. Aaron. Growth mechanisms <strong>of</strong> grain<br />
boundary allotriomorphs in Al-4%Cu at high homologous temperatures: In-<br />
terfacial vs direct volume diffusion. Metallurgical Transactions, 1:1805–1810,<br />
1970. 51<br />
[81] Y. Suwa <strong>and</strong> Y. Saito. Two-dimensional grain growth with isotropic grain<br />
boundary energy, 1997. 52<br />
[82] L. S. Darken. Diffusion <strong>of</strong> carbon in austenite with a discontinuity <strong>of</strong> compo-<br />
sition. Trans. AIME, 180:430–438, 1949. 53<br />
177
BIBLIOGRAPHY<br />
[83] C. Wells, W. Batz, <strong>and</strong> R. F. Mehl. Diffusion coefficient <strong>of</strong> carbon in austenite.<br />
Trans. AIME, 188:553–560, 1950. 53<br />
[84] R. W. K. Honeycombe <strong>and</strong> H. K. D. H. Bhadeshia. Steels: microstructure <strong>and</strong><br />
properties. Butterworth–Heinemann, London, U. K., 2nd edition, 1995. 57<br />
[85] F. H. Buttner, H. Udin, <strong>and</strong> J. Wulff. Trans. Amer. Inst. Min. (Metall.) Engrs.,<br />
191:1209, 1951. 62<br />
[86] E. R. Funk, H. Udin, <strong>and</strong> J. Wulff. Trans. Amer. Inst. Min. (Metall.) Engrs.,<br />
191(1206), 1951. 62<br />
[87] S. K. Das, A. Biswas, <strong>and</strong> R. N. Ghosh. Volume fraction dependent particle<br />
coarsening in plain carbon steel. Acta Metallurgica et Materialia, 41(3):777–<br />
781, 1993. 62<br />
[88] P. Deb <strong>and</strong> M. C. Chaturvedi. Coarsening behaviour <strong>of</strong> cementite particles in<br />
a ferrite matrix in 10b30 steel. Metallography, 15:341–354, 1982. 62<br />
[89] A. G. Martin <strong>and</strong> C. M. Sellars. Measurement <strong>of</strong> interfacial energy from ex-<br />
traction replicas <strong>of</strong> particles on grain boundaries. Metallography, 3:259–273,<br />
1970. 62<br />
[90] M. Ruda, D. Farkas, <strong>and</strong> G. Garcia. Atomistic simulations in the Fe-C system.<br />
Computational <strong>Materials</strong> <strong>Science</strong>, 45:550–560, 2009. 62<br />
[91] H. O. K. Kirchner, B. G. Mellor, <strong>and</strong> G. A. Chadwick. A calorimetric determi-<br />
nation <strong>of</strong> the interfacial enthalpy <strong>of</strong> cu-in <strong>and</strong> cu-al lamellar eutectoids. Acta<br />
Metallurgica, 26:1023–1031, 1978. 62<br />
[92] F. C. Hull, R. C. Colton, <strong>and</strong> R. F. Mehl. Rate <strong>of</strong> nucleation <strong>and</strong> rate <strong>of</strong> growth<br />
<strong>of</strong> pearlite. Trans. AIME, 150:185–207, 1942. 66, 68<br />
[93] Robert C. Weast, editor. CRC h<strong>and</strong>book <strong>of</strong> chemistry <strong>and</strong> physics. CRC Press,<br />
Inc, Boca Raton, FL, 69 edition, 1988. 72<br />
178
BIBLIOGRAPHY<br />
[94] R. B. McLellan, M. L. Rudee, <strong>and</strong> T. Ishibachi. The thermodynamics <strong>of</strong> dilute<br />
interstitial solid solutions with dual–site occupancy <strong>and</strong> its application to the<br />
diffusion <strong>of</strong> carbon in alpha–iron. Trans. A.I.M.E., 233:1939–1943, 1965. 75<br />
[95] H. K. D. H. Bhadeshia. Map programs. 75<br />
[96] J. Chance <strong>and</strong> N. Ridley. Chromium partitioning during isothermal trans-<br />
formation <strong>of</strong> a eutectoid steel. Metallurgical Transactions A, 12A:1205–1213,<br />
1981. 85<br />
[97] D. E. Coates. Diffusion controlled precipitate growth in ternary systems I.<br />
Metallurgical Transactions, 3:1203–1212, 1972. 86, 87<br />
[98] I. Kaur, Y. Mishin, <strong>and</strong> W. Gust. Fundamentals <strong>of</strong> Grain <strong>and</strong> Interphase<br />
Boundary Diffusion. John Wiley Sons LTD, 3rd edition. 92<br />
[99] A. M. Brown <strong>and</strong> M. F. Ashby. Correlations for diffusion constants. Acta<br />
Metallurgica, 28:1085–1101, 1980. 92<br />
[100] N. A. Gjostein. Short circuit diffusion. In Diffusion, pages 241–274, Metals<br />
Park, OH, 1973. American Society for Metals. 92<br />
[101] D. W. James <strong>and</strong> G. M. Leak. Grain boundary diffusion <strong>of</strong> iron, cobalt <strong>and</strong><br />
nickel in alpha-iron <strong>and</strong> <strong>of</strong> iron in gamma-iron. Philosophical Magazine, 12:491–<br />
503, 1965. 92<br />
[102] W. Gust, S. Mayer, A. Bogel, <strong>and</strong> B. Predel. Generalised representation <strong>of</strong><br />
grain boundary self-diffusion data. Journal De Physique, 46:537–544, 1985. 92<br />
[103] J. Fridberg <strong>and</strong> M. Hillert. Ortho–pearlite in silicon steels. Acta Metallurgica,<br />
18:1253–1260, 1970. 107<br />
[104] T. Oyama, O. D. Sherby, J. Wadsworth, <strong>and</strong> B. Walser. Application <strong>of</strong><br />
the divorced eutectoid transformation to the development <strong>of</strong> fine-grained,<br />
spheroidized structures in ultrahigh carbon steels. Scripta Metallurgica,<br />
18:799–804, 1984. 110<br />
179
BIBLIOGRAPHY<br />
[105] C. K. Syn, D. R. Lesuer, <strong>and</strong> O. D. Sherby. Influence <strong>of</strong> microstructure on<br />
tensile properties <strong>of</strong> spheroidised ultrahigh-carbon (1.8% C) steel. Metallurgical<br />
<strong>and</strong> <strong>Materials</strong> Transactions A, 25A:1481–1493, 1994.<br />
[106] E. M. Taleff, C. K. Syn, D. R. Lesuer, <strong>and</strong> O. D. Sherby. Pearlite in ultrahigh<br />
carbon steels: Heat treatments <strong>and</strong> mechanical properties. Metallurgical <strong>and</strong><br />
<strong>Materials</strong> Transactions A, 27A:111–118, 1996. 110<br />
[107] K. Honda <strong>and</strong> S. Saito. J. Iron Steel Inst., 102:261–269, 1920. 110<br />
[108] J. D. Verhoeven <strong>and</strong> E. D. Gibson. The divorced eutectoid transformation in<br />
steel. Metallurgical <strong>and</strong> <strong>Materials</strong> Transactions A, 29A:1181–1189, 1998. 112<br />
[109] J. D. Verhoeven. The role <strong>of</strong> the divorced eutectoid transformation in the<br />
spheroidization <strong>of</strong> 52100 steel. Metallurgical <strong>and</strong> <strong>Materials</strong> Transactions A,<br />
31A:2431–2438, 2000. 112<br />
[110] H. K. D. H. Bhadeshia. Steels for Bearings, chapter 7, page 40. SKF, 2011.<br />
113<br />
[111] N. V. Luzginova, L. Zhao, <strong>and</strong> J. Sietsma. The cementite spheroidization<br />
process in high-carbon steels with different chromium contents. Metallurgical<br />
<strong>and</strong> <strong>Materials</strong> Transactions A, 39A:513–521, 2008. 112, 117, 121, 123<br />
[112] A. P<strong>and</strong>it <strong>and</strong> H. K. D. H. Bhadeshia. Diffusion–controlled growth <strong>of</strong> pearlite<br />
in ternary steels. to be published in Proceedings <strong>of</strong> Royal Society A, 2011. 114<br />
[113] D. Venugopalan <strong>and</strong> J. S. Kirkaldy. New relations for predicting the mechanical<br />
prperties <strong>of</strong> quenched <strong>and</strong> tempered low alloy steels. In D. V. Doane <strong>and</strong> J. S.<br />
Kirkaldy, editors, Hardenability Concepts with Applications to Steels, pages<br />
249–268, Warrendale, PA, October 1977. The Metallurgical Society <strong>of</strong> AIME.<br />
121<br />
[114] Steel unversity website. 122<br />
180