Stáhnout toto číslo ve formátu PDF - Fakulta podnikatelská - Vysoké ...
Stáhnout toto číslo ve formátu PDF - Fakulta podnikatelská - Vysoké ...
Stáhnout toto číslo ve formátu PDF - Fakulta podnikatelská - Vysoké ...

Create successful ePaper yourself
Turn your PDF publications into a flip-book with our unique Google optimized e-Paper software.
TRENDY EKONOMIKY A MANAGEMENTU / TRENDS ECONOMICS AND MANAGEMENT<br />
August and September comparing to other<br />
months reaches highest le<strong>ve</strong>ls too.<br />
Standard deviation, %<br />
16,00%<br />
14,00%<br />
12,00%<br />
10,00%<br />
8,00%<br />
6,00%<br />
4,00%<br />
2,00%<br />
0,00%<br />
4,54%<br />
2,16%<br />
2,21%<br />
A<strong>ve</strong>rage monthly OMXV index changes<br />
0,57%<br />
-0,38%<br />
-0,28%<br />
-0,70%<br />
1 2 3 4 5 6 7 8 9 10 11 12<br />
Months<br />
1,64%<br />
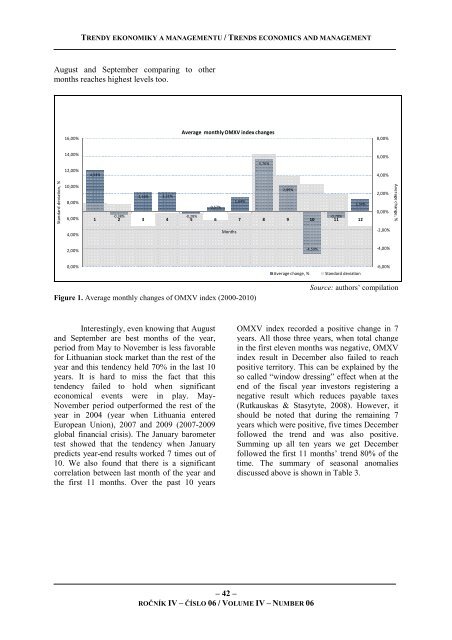
Figure 1. A<strong>ve</strong>rage monthly changes of OMXV index (2000-2010)<br />
Interestingly, e<strong>ve</strong>n knowing that August<br />
and September are best months of the year,<br />
period from May to No<strong>ve</strong>mber is less favorable<br />
for Lithuanian stock market than the rest of the<br />
year and this tendency held 70% in the last 10<br />
years. It is hard to miss the fact that this<br />
tendency failed to hold when significant<br />
economical e<strong>ve</strong>nts were in play. May-<br />
No<strong>ve</strong>mber period outperformed the rest of the<br />
year in 2004 (year when Lithuania entered<br />
European Union), 2007 and 2009 (2007-2009<br />
global financial crisis). The January barometer<br />
test showed that the tendency when January<br />
predicts year-end results worked 7 times out of<br />
10. We also found that there is a significant<br />
correlation between last month of the year and<br />
the first 11 months. O<strong>ve</strong>r the past 10 years<br />
5,76%<br />
2,89%<br />
-4,59%<br />
– 42 –<br />
ROČNÍK IV – ČÍSLO 06 / VOLUME IV – NUMBER 06<br />
1,34%<br />
A<strong>ve</strong>rage change, % Standard deviation<br />
8,00%<br />
6,00%<br />
4,00%<br />
2,00%<br />
0,00%<br />
-2,00%<br />
-4,00%<br />
-6,00%<br />
A<strong>ve</strong>rage change, %<br />
Source: authors’ compilation<br />
OMXV index recorded a positi<strong>ve</strong> change in 7<br />
years. All those three years, when total change<br />
in the first ele<strong>ve</strong>n months was negati<strong>ve</strong>, OMXV<br />
index result in December also failed to reach<br />
positi<strong>ve</strong> territory. This can be explained by the<br />
so called “window dressing” effect when at the<br />
end of the fiscal year in<strong>ve</strong>stors registering a<br />
negati<strong>ve</strong> result which reduces payable taxes<br />
(Rutkauskas & Stasytyte, 2008). Howe<strong>ve</strong>r, it<br />
should be noted that during the remaining 7<br />
years which were positi<strong>ve</strong>, fi<strong>ve</strong> times December<br />
followed the trend and was also positi<strong>ve</strong>.<br />
Summing up all ten years we get December<br />
followed the first 11 months’ trend 80% of the<br />
time. The summary of seasonal anomalies<br />
discussed abo<strong>ve</strong> is shown in Table 3.