Stáhnout toto číslo ve formátu PDF - Fakulta podnikatelská - Vysoké ...
Stáhnout toto číslo ve formátu PDF - Fakulta podnikatelská - Vysoké ...
Stáhnout toto číslo ve formátu PDF - Fakulta podnikatelská - Vysoké ...

You also want an ePaper? Increase the reach of your titles
YUMPU automatically turns print PDFs into web optimized ePapers that Google loves.
TRENDY EKONOMIKY A MANAGEMENTU / TRENDS ECONOMICS AND MANAGEMENT<br />
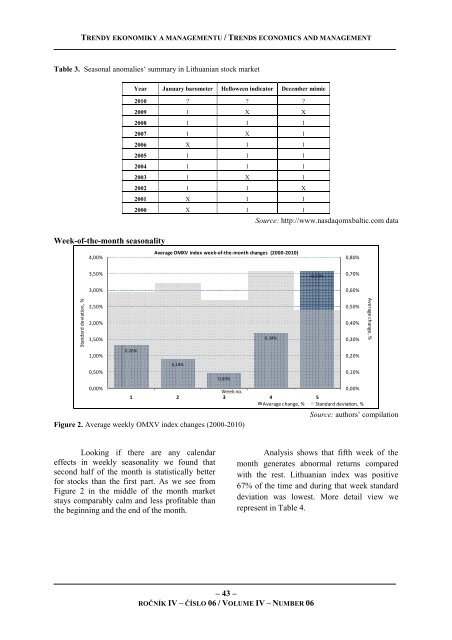
Table 3. Seasonal anomalies‘ summary in Lithuanian stock market<br />
Week-of-the-month seasonality<br />
Standard deviation, %<br />
4,00%<br />
3,50%<br />
3,00%<br />
2,50%<br />
2,00%<br />
1,50%<br />
1,00%<br />
0,50%<br />
0,00%<br />
0,26%<br />
Year January barometer Helloween indicator December mimic<br />
2010 ? ? ?<br />
2009 1 X X<br />
2008 1 1 1<br />
2007 1 X 1<br />
2006 X 1 1<br />
2005 1 1 1<br />
2004 1 1 1<br />
2003 1 X 1<br />
2002 1 1 X<br />
2001 X 1 1<br />
2000 X 1 1<br />
A<strong>ve</strong>rage OMXV index week-of-the-month changes (2000-2010)<br />
0,18%<br />
0,09%<br />
– 43 –<br />
ROČNÍK IV – ČÍSLO 06 / VOLUME IV – NUMBER 06<br />
Source: http://www.nasdaqomxbaltic.com data<br />
0,34%<br />
0,72%<br />
0,80%<br />
0,70%<br />
0,60%<br />
0,50%<br />
0,40%<br />
0,30%<br />
0,20%<br />
0,10%<br />
Week no.<br />
0,00%<br />
1 2 3 4 5<br />
A<strong>ve</strong>rage change, % Standard deviation, %<br />
Figure 2. A<strong>ve</strong>rage weekly OMXV index changes (2000-2010)<br />
Looking if there are any calendar<br />
effects in weekly seasonality we found that<br />
second half of the month is statistically better<br />
for stocks than the first part. As we see from<br />
Figure 2 in the middle of the month market<br />
stays comparably calm and less profitable than<br />
the beginning and the end of the month.<br />
A<strong>ve</strong>rage change, %<br />
Source: authors’ compilation<br />
Analysis shows that fifth week of the<br />
month generates abnormal returns compared<br />
with the rest. Lithuanian index was positi<strong>ve</strong><br />
67% of the time and during that week standard<br />
deviation was lowest. More detail view we<br />
represent in Table 4.