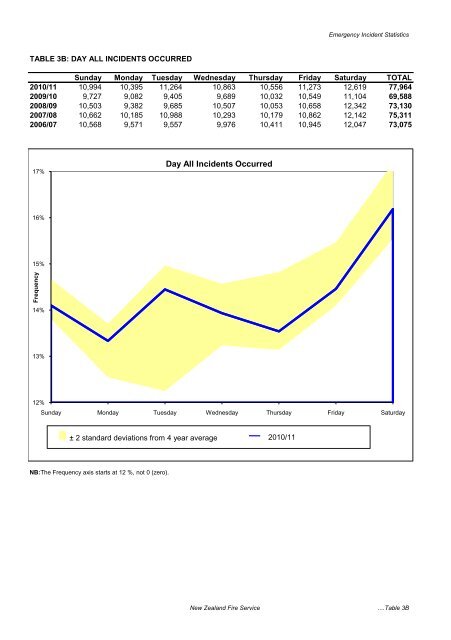
TABLE 3B: DAY ALL INCIDENTS OCCURRED <strong>Emergency</strong> <strong>Incident</strong> <strong>Statistics</strong> Sunday Monday Tuesday Wednesday Thursday Friday Saturday TOTAL <strong>2010</strong>/11 10,994 10,395 11,264 10,863 10,556 11,273 12,619 77,964 2009/10 9,727 9,082 9,405 9,689 10,032 10,549 11,104 69,588 2008/09 10,503 9,382 9,685 10,507 10,053 10,658 12,342 73,130 2007/08 10,662 10,185 10,988 10,293 10,179 10,862 12,142 75,311 2006/07 10,568 9,571 9,557 9,976 10,411 10,945 12,047 73,075 Frequency 17% 16% 15% 14% 13% 12% Sunday Monday Tuesday Wednesday Thursday Friday Saturday NB:The Frequency axis starts at 12 %, not 0 (zero). Day All <strong>Incident</strong>s Occurred ± 2 standard deviations from 4 year average <strong>2010</strong>/11 <strong>New</strong> <strong>Zealand</strong> <strong>Fire</strong> <strong>Service</strong> ....Table 3B
TABLE 4: DETAILS OF FIRE INCIDENTS <strong>Emergency</strong> <strong>Incident</strong> <strong>Statistics</strong> <strong>2010</strong>/11 2009/10 2008/09 2007/08 2006/07 <strong>Fire</strong>s Relating to Structures Structure fire with damage 2,650 2,073 2,915 2,888 2,837 Structure fire with no damage 2,590 1,772 2,660 2,596 2,645 Derelict building fire 53 71 89 72 58 Chimney fire 552 542 690 653 667 Structure fire - not classified above - - 7 20 55 Structure fire - incident report not yet completed 42 286 3 8 7 Total 5,887 4,744 6,364 6,237 6,269 Mobile Property <strong>Fire</strong>s Car, Van, Truck, Boat, Plane, Train fire 1,913 1,617 2,430 2,784 3,140 Caravan, Camper van, Mobile home fire (in transit) 20 18 20 24 22 Caravan, Camper van, Mobile home fire (not in transit) 21 23 39 33 25 Mobile shop/office fire (in transit) - 1 - 1 - Mobile shop/office fire (not in transit) - - 3 1 2 Derelict mobile property fire 29 51 55 82 102 Mobile property fire - not classified above 202 174 227 248 193 Mobile property fire - incident report not yet completed 22 117 6 10 3 Total 2,207 2,001 2,780 3,183 3,487 Vegetation <strong>Fire</strong>s Single tree fire 519 449 599 685 694 Hedge, Shelterbelt fire 421 424 482 583 532 Vegetation <strong>Fire</strong> (less than 20 sq. m) 2,586 2,648 2,892 3,508 3,030 Vegetation <strong>Fire</strong> (specify Area of Vegetation burnt) 1,004 1,083 956 1,436 1,173 Vegetation fire - not classified above - - - 31 114 Vegetation fire - incident report not yet completed 58 159 20 29 16 Total 4,588 4,763 4,949 6,272 5,559 Chemicals, Flammable Liquids and Gas <strong>Fire</strong>s (Hazardous <strong>Fire</strong>s) Chemical fire 8 12 10 3 9 Flammable liquid, Gas fire 118 79 114 124 96 Chemical, Flammable liquid fire - not classified above - - 6 8 11 Chemical, Flammable liquid fire - incident report not yet completed 10 57 1 1 - Total 136 148 131 136 116 Miscellaneous <strong>Fire</strong>s Outside rubbish fire 4,142 3,312 4,254 4,824 5,236 Rubbish bin, Skip fire 1,365 1,154 1,702 1,830 1,939 Bonfire 860 649 729 849 813 Hangi, Umu fire, Cultural cooking fire 323 230 289 298 260 Barbecue fire: Wood, Charcoal 118 78 90 111 117 Barbecue fire: Gas 46 38 56 58 59 Gas cooking, Gas camping stove fire 22 23 23 36 59 Camp fire 113 117 126 136 120 Incendiary device 36 20 42 51 92 Outside fire: Fence, Sign, Mail box, Playground equipment 526 411 560 579 682 Suicide by <strong>Fire</strong> (Fatality) - - - - - Miscellaneous fire - not classified above 421 388 543 504 651 Miscellaneous fire - incident report not yet completed 62 511 27 26 14 Total 8,034 6,931 8,441 9,302 10,042 GRAND TOTAL 20,852 18,587 22,665 25,130 25,473 <strong>New</strong> <strong>Zealand</strong> <strong>Fire</strong> <strong>Service</strong> ....Table 4