

Emergency Incident Statistics 2010-2011 - New Zealand Fire Service
Emergency Incident Statistics 2010-2011 - New Zealand Fire Service
Emergency Incident Statistics 2010-2011 - New Zealand Fire Service

Create successful ePaper yourself
Turn your PDF publications into a flip-book with our unique Google optimized e-Paper software.
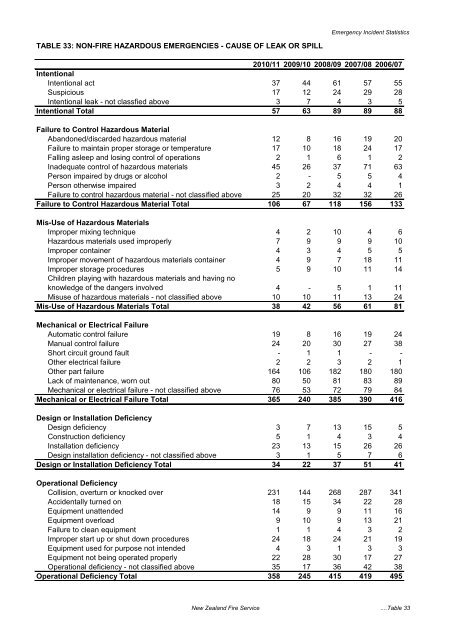
TABLE 33: NON-FIRE HAZARDOUS EMERGENCIES - CAUSE OF LEAK OR SPILL<br />
<strong>Emergency</strong> <strong>Incident</strong> <strong>Statistics</strong><br />
<strong>2010</strong>/11 2009/10 2008/09 2007/08 2006/07<br />
Intentional<br />
Intentional act 37 44 61 57 55<br />
Suspicious 17 12 24 29 28<br />
Intentional leak - not classfied above 3 7 4 3 5<br />
Intentional Total 57 63 89 89 88<br />
Failure to Control Hazardous Material<br />
Abandoned/discarded hazardous material 12 8 16 19 20<br />
Failure to maintain proper storage or temperature 17 10 18 24 17<br />
Falling asleep and losing control of operations 2 1 6 1 2<br />
Inadequate control of hazardous materials 45 26 37 71 63<br />
Person impaired by drugs or alcohol 2 - 5 5 4<br />
Person otherwise impaired 3 2 4 4 1<br />
Failure to control hazardous material - not classified above 25 20 32 32 26<br />
Failure to Control Hazardous Material Total 106 67 118 156 133<br />
Mis-Use of Hazardous Materials<br />
Improper mixing technique 4 2 10 4 6<br />
Hazardous materials used improperly 7 9 9 9 10<br />
Improper container 4 3 4 5 5<br />
Improper movement of hazardous materials container 4 9 7 18 11<br />
Improper storage procedures 5 9 10 11 14<br />
Children playing with hazardous materials and having no<br />
knowledge of the dangers involved 4 - 5 1 11<br />
Misuse of hazardous materials - not classified above 10 10 11 13 24<br />
Mis-Use of Hazardous Materials Total 38 42 56 61 81<br />
Mechanical or Electrical Failure<br />
Automatic control failure 19 8 16 19 24<br />
Manual control failure 24 20 30 27 38<br />
Short circuit ground fault - 1 1 - -<br />
Other electrical failure 2 2 3 2 1<br />
Other part failure 164 106 182 180 180<br />
Lack of maintenance, worn out 80 50 81 83 89<br />
Mechanical or electrical failure - not classified above 76 53 72 79 84<br />
Mechanical or Electrical Failure Total 365 240 385 390 416<br />
Design or Installation Deficiency<br />
Design deficiency 3 7 13 15 5<br />
Construction deficiency 5 1 4 3 4<br />
Installation deficiency 23 13 15 26 26<br />
Design installation deficiency - not classified above 3 1 5 7 6<br />
Design or Installation Deficiency Total 34 22 37 51 41<br />
Operational Deficiency<br />
Collision, overturn or knocked over 231 144 268 287 341<br />
Accidentally turned on 18 15 34 22 28<br />
Equipment unattended 14 9 9 11 16<br />
Equipment overload 9 10 9 13 21<br />
Failure to clean equipment 1 1 4 3 2<br />
Improper start up or shut down procedures 24 18 24 21 19<br />
Equipment used for purpose not intended 4 3 1 3 3<br />
Equipment not being operated properly 22 28 30 17 27<br />
Operational deficiency - not classified above 35 17 36 42 38<br />
Operational Deficiency Total 358 245 415 419 495<br />
<strong>New</strong> <strong>Zealand</strong> <strong>Fire</strong> <strong>Service</strong> ....Table 33


