

Emergency Incident Statistics 2010-2011 - New Zealand Fire Service
Emergency Incident Statistics 2010-2011 - New Zealand Fire Service
Emergency Incident Statistics 2010-2011 - New Zealand Fire Service

You also want an ePaper? Increase the reach of your titles
YUMPU automatically turns print PDFs into web optimized ePapers that Google loves.
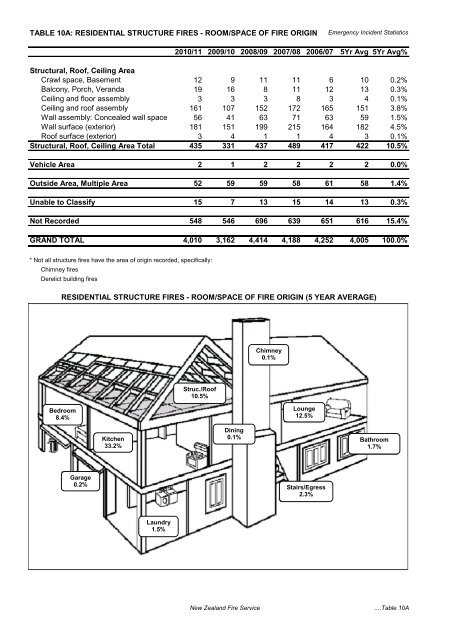
TABLE 10A: RESIDENTIAL STRUCTURE FIRES - ROOM/SPACE OF FIRE ORIGIN<br />
<strong>Emergency</strong> <strong>Incident</strong> <strong>Statistics</strong><br />
<strong>2010</strong>/11 2009/10 2008/09 2007/08 2006/07 5Yr Avg 5Yr Avg%<br />
Structural, Roof, Ceiling Area<br />
Crawl space, Basement 12 9 11 11 6 10 0.2%<br />
Balcony, Porch, Veranda 19 16 8 11 12 13 0.3%<br />
Ceiling and floor assembly 3 3 3 8 3 4 0.1%<br />
Ceiling and roof assembly 161 107 152 172 165 151 3.8%<br />
Wall assembly: Concealed wall space 56 41 63 71 63 59 1.5%<br />
Wall surface (exterior) 181 151 199 215 164 182 4.5%<br />
Roof surface (exterior) 3 4 1 1 4 3 0.1%<br />
Structural, Roof, Ceiling Area Total 435 331 437 489 417 422 10.5%<br />
Vehicle Area 2 1 2 2 2 2 0.0%<br />
Outside Area, Multiple Area 52 59 59 58 61 58 1.4%<br />
Unable to Classify 15 7 13 15 14 13 0.3%<br />
Not Recorded 548 546 696 639 651 616 15.4%<br />
GRAND TOTAL 4,010 3,162 4,414 4,188 4,252 4,005 100.0%<br />
* Not all structure fires have the area of origin recorded, specifically:<br />
Chimney fires<br />
Derelict building fires<br />
RESIDENTIAL STRUCTURE FIRES - ROOM/SPACE OF FIRE ORIGIN (5 YEAR AVERAGE)<br />
Bedroom<br />
8.4%<br />
Garage<br />
0.2%<br />
Kitchen<br />
33.2%<br />
Laundry<br />
1.5%<br />
Struc./Roof<br />
10.5%<br />
Dining<br />
0.1%<br />
Chimney<br />
0.1%<br />
Lounge<br />
12.5%<br />
Stairs/Egress<br />
2.3%<br />
Bathroom<br />
1.7%<br />
<strong>New</strong> <strong>Zealand</strong> <strong>Fire</strong> <strong>Service</strong> ....Table 10A


