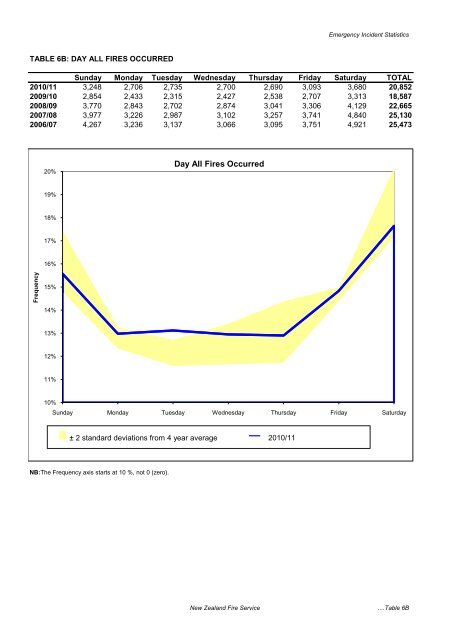
TABLE 6B: DAY ALL FIRES OCCURRED <strong>Emergency</strong> <strong>Incident</strong> <strong>Statistics</strong> Sunday Monday Tuesday Wednesday Thursday Friday Saturday TOTAL <strong>2010</strong>/11 3,248 2,706 2,735 2,700 2,690 3,093 3,680 20,852 2009/10 2,854 2,433 2,315 2,427 2,538 2,707 3,313 18,587 2008/09 3,770 2,843 2,702 2,874 3,041 3,306 4,129 22,665 2007/08 3,977 3,226 2,987 3,102 3,257 3,741 4,840 25,130 2006/07 4,267 3,236 3,137 3,066 3,095 3,751 4,921 25,473 Frequency 20% 19% 18% 17% 16% 15% 14% 13% 12% 11% 10% Sunday Monday Tuesday Wednesday Thursday Friday Saturday NB:The Frequency axis starts at 10 %, not 0 (zero). Day All <strong>Fire</strong>s Occurred ± 2 standard deviations from 4 year average <strong>2010</strong>/11 <strong>New</strong> <strong>Zealand</strong> <strong>Fire</strong> <strong>Service</strong> ....Table 6B
TABLE 7: ALL FIRES - INDICATED/SUPPOSED CAUSE <strong>Emergency</strong> <strong>Incident</strong> <strong>Statistics</strong> <strong>2010</strong>/11 2009/10 2008/09 2007/08 2006/07 Deliberately Lit <strong>Fire</strong> Unlawful 5,748 5,156 6,693 7,927 7,959 Lawful 2,128 1,922 2,291 2,435 2,572 Legality not known 585 478 599 704 697 Suspicious 1,953 1,603 2,082 2,169 2,197 Controlled burn, land clearing fire 624 544 665 707 812 Deliberately lit fire - not classified above 169 200 181 238 272 Deliberately Lit <strong>Fire</strong> Total 11,207 9,903 12,511 14,180 14,509 Reckless Reckless act (involving fire) 293 297 334 378 364 Reckless with fireworks 209 77 152 188 417 Reckless (involving fire) - not classified above - 13 20 39 60 Reckless Total 502 387 506 605 841 Carelessness with Heat Source Careless disposal: cigarettes, cigars, ashes, embers 1,148 1,019 1,375 1,528 1,299 Thawing 8 1 9 2 5 Unattended/Asleep: kitchen, cooking fire 980 689 1,052 1,005 1,022 Falling asleep: other (includes smoking in bed) 15 12 23 35 34 Inadequate control: open fires, camp fires, bonfires 199 176 207 268 219 Heat source too close to combustibles 478 378 444 495 524 People playing with heat sources 149 104 157 198 284 People impaired by drugs or alcohol 26 8 14 25 17 People otherwise impaired: unconscious, mental/physical impairment) 10 7 16 18 10 Carelessness with heat source - not classified above 242 213 311 332 323 Carelessness with Heat Source Total 3,255 2,607 3,608 3,906 3,737 Carelessness with Material Ignited Flammable liquid/gas spilled or accidentally released 27 27 58 33 50 Improper fuelling techniques: vehicles, saws, petrol motors etc 5 2 6 5 7 Flammable liquid used: kindle fire, washing, cleaning, painting 8 7 10 6 11 Improper container 13 9 12 16 19 Combustible placed too close to heat source 111 118 167 144 172 Improper storage procedures 23 12 35 29 22 People playing with combustibles 22 9 27 31 38 Carelessness with material ignited - not classified above 114 77 105 113 103 Carelessness with Material Ignited Total 323 261 420 377 422 Mechanical Failure, Malfunction Part failure, leak or break 686 428 635 706 653 Automatic control failure 46 38 60 54 61 Manual control failure 10 8 16 10 16 Short circuit, earth fault 551 430 620 558 589 Other electrical failure 718 502 662 609 652 Lack of maintenance 142 109 135 137 161 Backfire 16 22 25 28 49 Hydraulic line not tight 2 5 1 2 9 Mechanical failure, malfunction - not classified above 195 130 182 205 192 Mechanical Failure, Malfunction Total 2,366 1,672 2,336 2,309 2,382 <strong>New</strong> <strong>Zealand</strong> <strong>Fire</strong> <strong>Service</strong> ....Table 7