

Emergency Incident Statistics 2010-2011 - New Zealand Fire Service
Emergency Incident Statistics 2010-2011 - New Zealand Fire Service
Emergency Incident Statistics 2010-2011 - New Zealand Fire Service

Create successful ePaper yourself
Turn your PDF publications into a flip-book with our unique Google optimized e-Paper software.
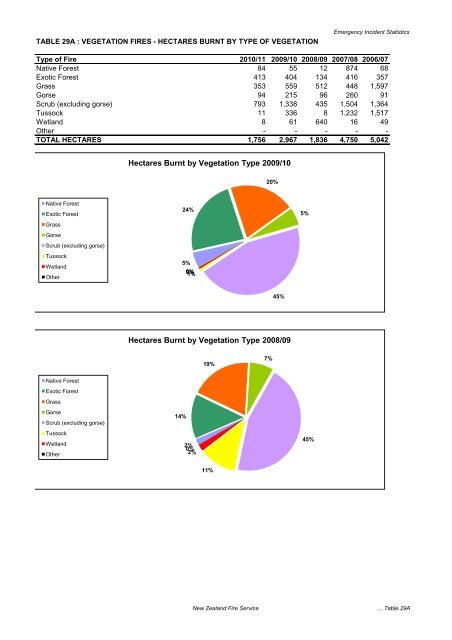
TABLE 29A : VEGETATION FIRES - HECTARES BURNT BY TYPE OF VEGETATION<br />
<strong>Emergency</strong> <strong>Incident</strong> <strong>Statistics</strong><br />
Type of <strong>Fire</strong> <strong>2010</strong>/11 2009/10 2008/09 2007/08 2006/07<br />
Native Forest 84 55 12 874 68<br />
Exotic Forest 413 404 134 416 357<br />
Grass 353 559 512 448 1,597<br />
Gorse 94 215 96 260 91<br />
Scrub (excluding gorse) 793 1,338 435 1,504 1,364<br />
Tussock 11 336 8 1,232 1,517<br />
Wetland 8 61 640 16 49<br />
Other - - - - -<br />
TOTAL HECTARES 1,756 2,967 1,836 4,750 5,042<br />
Native Forest<br />
Exotic Forest<br />
Grass<br />
Gorse<br />
Scrub (excluding gorse)<br />
Tussock<br />
Wetland<br />
Other<br />
Native Forest<br />
Exotic Forest<br />
Grass<br />
Gorse<br />
Scrub (excluding gorse)<br />
Tussock<br />
Wetland<br />
Other<br />
Hectares Burnt by Vegetation Type 2009/10<br />
24%<br />
5%<br />
14%<br />
0%<br />
1%<br />
2%<br />
0%<br />
2%<br />
19%<br />
11%<br />
20%<br />
7%<br />
45%<br />
Hectares Burnt by Vegetation Type 2008/09<br />
5%<br />
45%<br />
<strong>New</strong> <strong>Zealand</strong> <strong>Fire</strong> <strong>Service</strong> ....Table 29A


