Action Plan - FCM
Action Plan - FCM
Action Plan - FCM

Create successful ePaper yourself
Turn your PDF publications into a flip-book with our unique Google optimized e-Paper software.
Town of Banff Local <strong>Action</strong> <strong>Plan</strong><br />
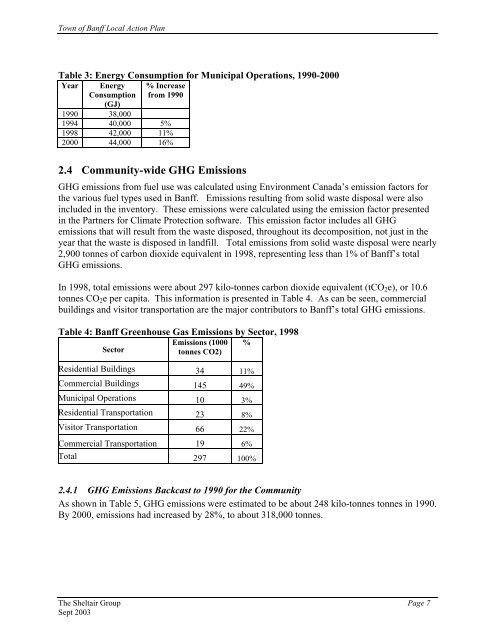
Table 3: Energy Consumption for Municipal Operations, 1990-2000<br />
Year Energy<br />
Consumption<br />
(GJ)<br />
% Increase<br />
from 1990<br />
1990 38,000<br />
1994 40,000 5%<br />
1998 42,000 11%<br />
2000 44,000 16%<br />
2.4 Community-wide GHG Emissions<br />
GHG emissions from fuel use was calculated using Environment Canada’s emission factors for<br />
the various fuel types used in Banff. Emissions resulting from solid waste disposal were also<br />
included in the inventory. These emissions were calculated using the emission factor presented<br />
in the Partners for Climate Protection software. This emission factor includes all GHG<br />
emissions that will result from the waste disposed, throughout its decomposition, not just in the<br />
year that the waste is disposed in landfill. Total emissions from solid waste disposal were nearly<br />
2,900 tonnes of carbon dioxide equivalent in 1998, representing less than 1% of Banff’s total<br />
GHG emissions.<br />
In 1998, total emissions were about 297 kilo-tonnes carbon dioxide equivalent (tCO2e), or 10.6<br />
tonnes CO2e per capita. This information is presented in Table 4. As can be seen, commercial<br />
buildings and visitor transportation are the major contributors to Banff’s total GHG emissions.<br />
Table 4: Banff Greenhouse Gas Emissions by Sector, 1998<br />
Sector<br />
Emissions (1000<br />
tonnes CO2)<br />
%<br />
Residential Buildings 34 11%<br />
Commercial Buildings 145 49%<br />
Municipal Operations 10 3%<br />
Residential Transportation 23 8%<br />
Visitor Transportation 66 22%<br />
Commercial Transportation 19 6%<br />
Total 297 100%<br />
2.4.1 GHG Emissions Backcast to 1990 for the Community<br />
As shown in Table 5, GHG emissions were estimated to be about 248 kilo-tonnes tonnes in 1990.<br />
By 2000, emissions had increased by 28%, to about 318,000 tonnes.<br />
The Sheltair Group Page 7<br />
Sept 2003