Action Plan - FCM
Action Plan - FCM
Action Plan - FCM

You also want an ePaper? Increase the reach of your titles
YUMPU automatically turns print PDFs into web optimized ePapers that Google loves.
Town of Banff Local <strong>Action</strong> <strong>Plan</strong><br />
• Using estimates of residential population from Alberta statistics and visitor population<br />
estimates from the East Park Gate counts and bed unit estimates.<br />
• Backcasting transportation estimates for 1990 assuming that per capita fuel consumption<br />
followed a consistent rate of growth between 1990 and 1998 (a 1.5% increase in activity rate<br />
each year 1 ).<br />
2.2 Energy Used Throughout the Community<br />
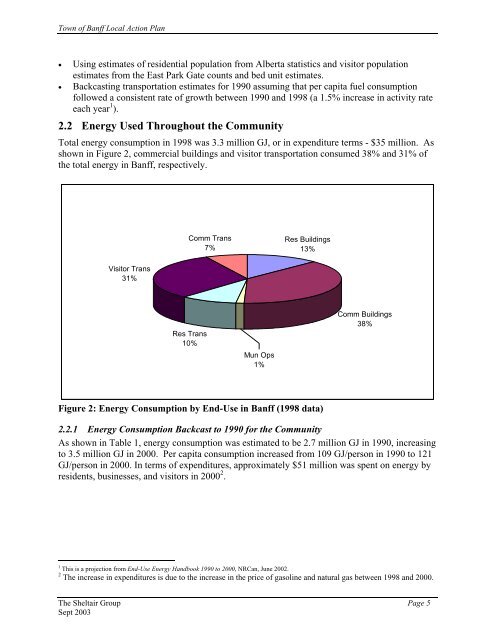
Total energy consumption in 1998 was 3.3 million GJ, or in expenditure terms - $35 million. As<br />
shown in Figure 2, commercial buildings and visitor transportation consumed 38% and 31% of<br />
the total energy in Banff, respectively.<br />
Visitor Trans<br />
31%<br />
Comm Trans<br />
7%<br />
Res Trans<br />
10%<br />
Mun Ops<br />
1%<br />
Res Buildings<br />
13%<br />
Figure 2: Energy Consumption by End-Use in Banff (1998 data)<br />
Comm Buildings<br />
38%<br />
2.2.1 Energy Consumption Backcast to 1990 for the Community<br />
As shown in Table 1, energy consumption was estimated to be 2.7 million GJ in 1990, increasing<br />
to 3.5 million GJ in 2000. Per capita consumption increased from 109 GJ/person in 1990 to 121<br />
GJ/person in 2000. In terms of expenditures, approximately $51 million was spent on energy by<br />
residents, businesses, and visitors in 2000 2 .<br />
1 This is a projection from End-Use Energy Handbook 1990 to 2000, NRCan, June 2002.<br />
2 The increase in expenditures is due to the increase in the price of gasoline and natural gas between 1998 and 2000.<br />
The Sheltair Group Page 5<br />
Sept 2003