

ESRB RISK DASHBOARD - European Systemic Risk Board - Europa
ESRB RISK DASHBOARD - European Systemic Risk Board - Europa
ESRB RISK DASHBOARD - European Systemic Risk Board - Europa

Create successful ePaper yourself
Turn your PDF publications into a flip-book with our unique Google optimized e-Paper software.
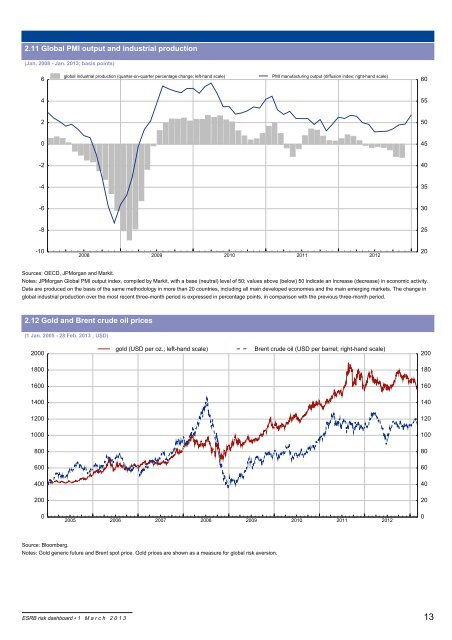
2.11 Global PMI output and industrial production<br />
(Jan. 2008 - Jan. 2013; basis points)<br />
6<br />
4<br />
2<br />
0<br />
-2<br />
-4<br />
-6<br />
-8<br />
-10<br />
global industrial production (quarter-on-quarter percentage change; left-hand scale) PMI manufacturing output (diffusion index; right-hand scale)<br />
<strong>ESRB</strong> risk dashboard 1 M a r c h 2 0 1 3<br />
2008 2009 2010 2011 2012<br />
Sources: OECD, JPMorgan and Markit.<br />
Notes: JPMorgan Global PMI output index, compiled by Markit, with a base (neutral) level of 50; values above (below) 50 indicate an increase (decrease) in economic activity.<br />
Data are produced on the basis of the same methodology in more than 20 countries, including all main developed economies and the main emerging markets. The change in<br />
global industrial production over the most recent three-month period is expressed in percentage points, in comparison with the previous three-month period.<br />
2.12 Gold and Brent crude oil prices<br />
(1 Jan. 2005 - 28 Feb. 2013 ; USD)<br />
2000<br />
1800<br />
1600<br />
1400<br />
1200<br />
1000<br />
800<br />
600<br />
400<br />
200<br />
0<br />
gold (USD per oz.; left-hand scale) Brent crude oil (USD per barrel; right-hand scale)<br />
2005 2006 2007 2008 2009 2010 2011 2012<br />
Source: Bloomberg.<br />
Notes: Gold generic future and Brent spot price. Gold prices are shown as a measure for global risk aversion.<br />
60<br />
55<br />
50<br />
45<br />
40<br />
35<br />
30<br />
25<br />
20<br />
200<br />
180<br />
160<br />
140<br />
120<br />
100<br />
80<br />
60<br />
40<br />
20<br />
0<br />
13


