

ESRB RISK DASHBOARD - European Systemic Risk Board - Europa
ESRB RISK DASHBOARD - European Systemic Risk Board - Europa
ESRB RISK DASHBOARD - European Systemic Risk Board - Europa

You also want an ePaper? Increase the reach of your titles
YUMPU automatically turns print PDFs into web optimized ePapers that Google loves.
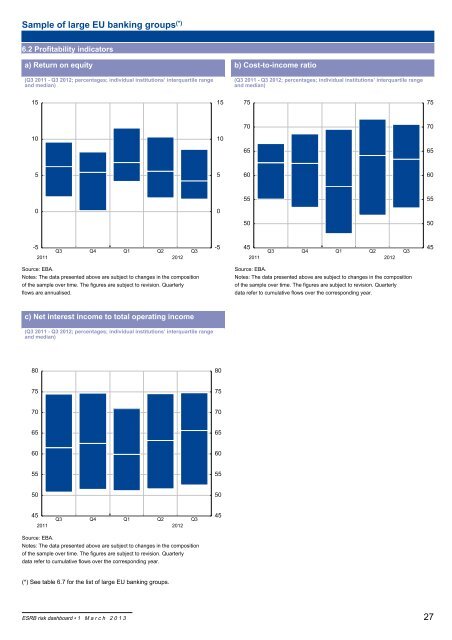
Sample of large EU banking groups (*)<br />
6.2 Profitability indicators<br />
a) Return on equity b) Cost-to-income ratio<br />
(Q3 2011 - Q3 2012; percentages; individual institutions’ interquartile range (Q3 2011 - Q3 2012; percentages; individual institutions’ interquartile range<br />
and median) and median)<br />
15<br />
10<br />
5<br />
0<br />
-5<br />
Q3 Q4 Q1 Q2 Q3<br />
2011 2012<br />
Source: EBA.<br />
Notes: The data presented above are subject to changes in the composition<br />
of the sample over time. The figures are subject to revision. Quarterly<br />
flows are annualised.<br />
c) Net interest income to total operating income<br />
(Q3 2011 - Q3 2012; percentages; individual institutions’ interquartile range<br />
and median)<br />
80<br />
75<br />
70<br />
65<br />
60<br />
55<br />
50<br />
45<br />
Q3 Q4 Q1 Q2 Q3<br />
2011 2012<br />
Source: EBA.<br />
Notes: The data presented above are subject to changes in the composition<br />
of the sample over time. The figures are subject to revision. Quarterly<br />
data refer to cumulative flows over the corresponding year.<br />
(*) See table 6.7 for the list of large EU banking groups.<br />
<strong>ESRB</strong> risk dashboard 1 M a r c h 2 0 1 3<br />
15<br />
10<br />
5<br />
0<br />
-5<br />
80<br />
75<br />
70<br />
65<br />
60<br />
55<br />
50<br />
45<br />
75<br />
70<br />
65<br />
60<br />
55<br />
50<br />
45<br />
Q3 Q4 Q1 Q2 Q3<br />
2011 2012<br />
Source: EBA.<br />
Notes: The data presented above are subject to changes in the composition<br />
of the sample over time. The figures are subject to revision. Quarterly<br />
data refer to cumulative flows over the corresponding year.<br />
75<br />
70<br />
65<br />
60<br />
55<br />
50<br />
45<br />
27


