

ESRB RISK DASHBOARD - European Systemic Risk Board - Europa
ESRB RISK DASHBOARD - European Systemic Risk Board - Europa
ESRB RISK DASHBOARD - European Systemic Risk Board - Europa

You also want an ePaper? Increase the reach of your titles
YUMPU automatically turns print PDFs into web optimized ePapers that Google loves.
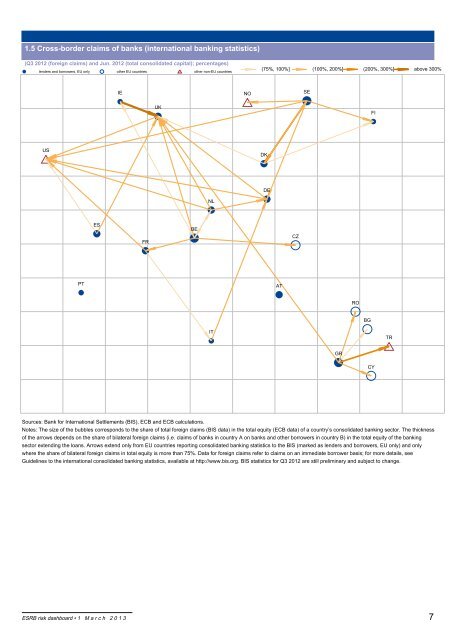
1.5 Cross-border claims of banks (international banking statistics)<br />
(Q3 2012 (foreign claims) and Jun. 2012 (total consolidated capital); percentages)<br />
lenders and borrowers, EU only other EU countries other non-EU countries<br />
US<br />
PT<br />
ES<br />
<strong>ESRB</strong> risk dashboard 1 M a r c h 2 0 1 3<br />
IE<br />
FR<br />
UK<br />
BE<br />
NL<br />
IT<br />
NO<br />
(75%, 100%] (100%, 200%] (200%, 300%] above 300%<br />
Sources: Bank for International Settlements (BIS), ECB and ECB calculations.<br />
Notes: The size of the bubbles corresponds to the share of total foreign claims (BIS data) in the total equity (ECB data) of a country’s consolidated banking sector. The thickness<br />
of the arrows depends on the share of bilateral foreign claims (i.e. claims of banks in country A on banks and other borrowers in country B) in the total equity of the banking<br />
sector extending the loans. Arrows extend only from EU countries reporting consolidated banking statistics to the BIS (marked as lenders and borrowers, EU only) and only<br />
where the share of bilateral foreign claims in total equity is more than 75%. Data for foreign claims refer to claims on an immediate borrower basis; for more details, see<br />
Guidelines to the international consolidated banking statistics, available at http://www.bis.org. BIS statistics for Q3 2012 are still preliminary and subject to change.<br />
DK<br />
DE<br />
AT<br />
CZ<br />
SE<br />
GR<br />
RO<br />
BG<br />
FI<br />
CY<br />
TR<br />
7


