

ESRB RISK DASHBOARD - European Systemic Risk Board - Europa
ESRB RISK DASHBOARD - European Systemic Risk Board - Europa
ESRB RISK DASHBOARD - European Systemic Risk Board - Europa

You also want an ePaper? Increase the reach of your titles
YUMPU automatically turns print PDFs into web optimized ePapers that Google loves.
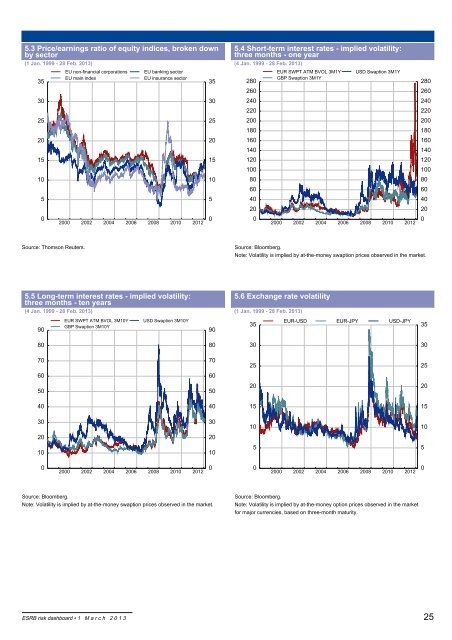
5.3 Price/earnings ratio of equity indices, broken down<br />
by sector<br />
(1 Jan. 1999 - 28 Feb. 2013) (4 Jan. 1999 - 28 Feb. 2013)<br />
35<br />
30<br />
25<br />
20<br />
15<br />
10<br />
5<br />
0<br />
EU non-financial corporations<br />
EU main index<br />
2000 2002 2004 2006 2008 2010 2012<br />
<strong>ESRB</strong> risk dashboard 1 M a r c h 2 0 1 3<br />
EU banking sector<br />
EU insurance sector<br />
35<br />
30<br />
25<br />
20<br />
15<br />
10<br />
5<br />
0<br />
5.4 Short-term interest rates - implied volatility:<br />
three months - one year<br />
280<br />
260<br />
240<br />
220<br />
200<br />
180<br />
160<br />
140<br />
120<br />
100<br />
80<br />
60<br />
40<br />
20<br />
0<br />
EUR SWPT ATM BVOL 3M1Y<br />
GBP Swaption 3M1Y<br />
USD Swaption 3M1Y<br />
2000 2002 2004 2006 2008 2010 2012<br />
Source: Thomson Reuters. Source: Bloomberg.<br />
Note: Volatility is implied by at-the-money swaption prices observed in the market.<br />
5.5 Long-term interest rates - implied volatility:<br />
three months - ten years<br />
5.6 Exchange rate volatility<br />
(4 Jan. 1999 - 28 Feb. 2013) (1 Jan. 1999 - 28 Feb. 2013)<br />
90<br />
80<br />
70<br />
60<br />
50<br />
40<br />
30<br />
20<br />
10<br />
0<br />
EUR SWPT ATM BVOL 3M10Y<br />
GBP Swaption 3M10Y<br />
USD Swaption 3M10Y<br />
2000 2002 2004 2006 2008 2010 2012<br />
Source: Bloomberg.<br />
Note: Volatility is implied by at-the-money swaption prices observed in the market.<br />
90<br />
80<br />
70<br />
60<br />
50<br />
40<br />
30<br />
20<br />
10<br />
0<br />
35<br />
30<br />
25<br />
20<br />
15<br />
10<br />
5<br />
0<br />
EUR-USD EUR-JPY USD-JPY<br />
2000 2002 2004 2006 2008 2010 2012<br />
Source: Bloomberg.<br />
Note: Volatility is implied by at-the-money option prices observed in the market<br />
for major currencies, based on three-month maturity.<br />
280<br />
260<br />
240<br />
220<br />
200<br />
180<br />
160<br />
140<br />
120<br />
100<br />
80<br />
60<br />
40<br />
20<br />
0<br />
35<br />
30<br />
25<br />
20<br />
15<br />
10<br />
5<br />
0<br />
25


