
You also want an ePaper? Increase the reach of your titles
YUMPU automatically turns print PDFs into web optimized ePapers that Google loves.
<strong>FTSE</strong> FACTSHEET<br />
<strong>FTSE</strong> SGX Asia Shariah 100 Index<br />
bmkTitle1<br />
The <strong>FTSE</strong> SGX Shariah Index Series, launched by <strong>FTSE</strong> Group and the Singapore Exchange<br />
(SGX), reflects the stock performance of companies in the Asia Pacific region whose business<br />
activities comply with Islamic Shariah Law. Independent screening is carried out by Yasaar Ltd,<br />
an organisation with a global network of expert Shariah scholars. Their approach is described<br />
below.<br />
The <strong>FTSE</strong> SGX Asia Shariah 100 Index consists of a combination of 50 of the largest Japanese<br />
companies and the 50 largest companies from Singapore, Taiwan, Korea and Hong Kong (SAR).<br />
Business Activity Screening<br />
Initially, companies involved in any of the following activities will be filtered out as non Shariahcompliant:<br />
• Conventional finance (non-Islamic banking, finance and insurance, etc.);<br />
• Alcohol;<br />
• Pork related products and non-halal food production, packaging and processing or any other<br />
activity related to pork and non-halal food;<br />
• Entertainment (casinos, gambling and pornography);<br />
• Tobacco; weapons, arms and defence manufacturing.<br />
Financial Ratios Screening<br />
The remaining companies are then further screened on a financial basis. The following financial<br />
ratios must be met for companies to be considered Shariah-compliant:<br />
• Debt is less than 33% of total assets;<br />
• Cash and interest bearing items are less than 33% of total assets;<br />
• Accounts receivable and cash are less than 50% of total assets;<br />
• Total interest and non compliant activities income should not exceed 5% of total revenue.<br />
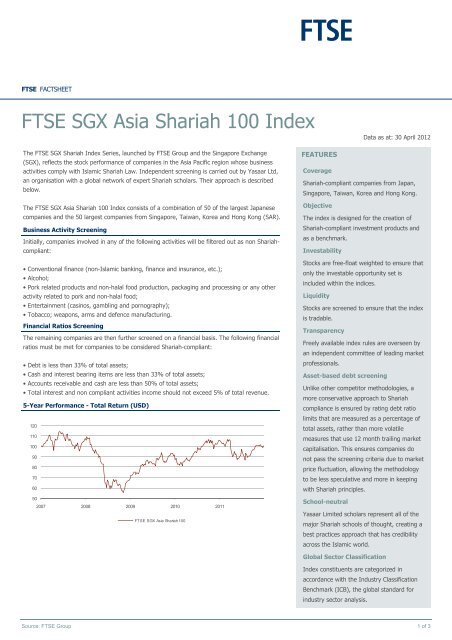
5-Year Performance - Total Return (USD)<br />
120<br />
110<br />
100<br />
90<br />
80<br />
70<br />
60<br />
50<br />
2007 2008 2009 2010 2011<br />
<strong>FTSE</strong> SGX Asia Shariah 100<br />
FEATURES<br />
Coverage<br />
Shariah-compliant companies from Japan,<br />
Singapore, Taiwan, Korea and Hong Kong.<br />
Objective<br />
The index is designed for the creation of<br />
Shariah-compliant investment products and<br />
as a benchmark.<br />
Investability<br />
Stocks are free-float weighted to ensure that<br />
only the investable opportunity set is<br />
included within the indices.<br />
Liquidity<br />
Stocks are screened to ensure that the index<br />
is tradable.<br />
Transparency<br />
Freely available index rules are overseen by<br />
an independent committee of leading market<br />
professionals.<br />
Asset-based debt screening<br />
Unlike other competitor methodologies, a<br />
more conservative approach to Shariah<br />
compliance is ensured by rating debt ratio<br />
limits that are measured as a percentage of<br />
total assets, rather than more volatile<br />
measures that use 12 month trailing market<br />
capitalisation. This ensures companies do<br />
not pass the screening criteria due to market<br />
price fluctuation, allowing the methodology<br />
to be less speculative and more in keeping<br />
with Shariah principles.<br />
School-neutral<br />
Yasaar Limited scholars represent all of the<br />
major Shariah schools of thought, creating a<br />
best practices approach that has credibility<br />
across the Islamic world.<br />
Global Sector Classification<br />
Data as at: 30 April 2012<br />
Index constituents are categorized in<br />
accordance with the Industry Classification<br />
Benchmark (ICB), the global standard for<br />
industry sector analysis.<br />
Source: <strong>FTSE</strong> Group 1 of 3
<strong>FTSE</strong> SGX Asia Shariah 100 Index Data as at: 30 April 2012<br />
Performance and Volatility - Total Return (USD)<br />
Performance % Return %* Volatility %**<br />
3M 6M YTD 12M 3YR 5YR 3YR 5YR 1YR 3YR 5YR<br />
<strong>FTSE</strong> SGX Asia Shariah 100 4.3 5.9 11.3 -4.9 47.5 1.2 13.8 0.2 20.4 17.2 20.5<br />
* Returns are annualised<br />
** Volatility - 1YR based on 12 months daily data. 3YR and 5YR based on monthly data<br />
Top 10 Constituents<br />
Constituent Country ICB Sector Net MCap (USDm) Wgt %<br />
Samsung Electronics Korea Technology Hardware & Equipment 180,046 12.96<br />
Taiwan Semiconductor Manufacturing Taiwan Technology Hardware & Equipment 76,686 5.52<br />
Canon Japan Technology Hardware & Equipment 60,965 4.39<br />
Hon Hai Precision Industry Taiwan Electronic & Electrical Equipment 33,687 2.42<br />
NTT Docomo Japan Mobile Telecommunications 29,878 2.15<br />
Posco Korea Industrial Metals & Mining 29,026 2.09<br />
Komatsu Japan Industrial Engineering 27,517 1.98<br />
Takeda Pharmaceutical Japan Pharmaceuticals & Biotechnology 25,755 1.85<br />
Softbank Japan Mobile Telecommunications 24,839 1.79<br />
Sun Hung Kai Props Hong Kong Real Estate Investment & Services 23,663 1.70<br />
Totals 512,061 36.86<br />
Country Breakdown<br />
Country No. of Cons Net MCap (USDm) Wgt %<br />
Hong Kong 15 128,798 9.27<br />
Japan 50 646,781 46.56<br />
Korea 19 363,518 26.17<br />
Singapore 6 53,991 3.89<br />
Taiwan 10 196,063 14.11<br />
Totals 100 1,389,150 100.00<br />
ICB Supersector Breakdown<br />
ICB Code ICB Supersector No. of Cons Net MCap (USDm) Wgt %<br />
0500 Oil & Gas 6 63,628 4.58<br />
1300 Chemicals 8 96,996 6.98<br />
1700 Basic Resources 4 60,703 4.37<br />
2300 Construction & Materials 4 30,422 2.19<br />
2700 Industrial Goods & Services 16 224,728 16.18<br />
3300 Automobiles & Parts 7 88,127 6.34<br />
3500 Food & Beverage 3 19,047 1.37<br />
3700 Personal & Household Goods 10 94,728 6.82<br />
4500 Health Care 7 80,861 5.82<br />
5300 Retail 1 1,656 0.12<br />
5500 Media 1 4,275 0.31<br />
5700 Travel & Leisure 3 13,920 1.00<br />
6500 Telecommunications 8 135,452 9.75<br />
7500 Utilities 4 35,735 2.57<br />
8600 Real Estate 9 75,103 5.41<br />
9500 Technology 9 363,769 26.19<br />
Totals 100 1,389,150 100.00<br />
INFORMATION<br />
Index Universe<br />
<strong>FTSE</strong> Global Equity Index Series (Japan,<br />
Singapore, Taiwan, Korea and Hong Kong<br />
(SAR))<br />
Index Launch<br />
20 February 2006<br />
Base Date<br />
30 December 2005<br />
Base Value<br />
Source: <strong>FTSE</strong> Group 2 of 3<br />
5000<br />
Investability Screen<br />
Free-float adjusted and liquidity screened<br />
Index Calculation<br />
Real time (calculated every 15 seconds) and<br />
end of day<br />
End-of-Day Distribution<br />
Via FTP and email<br />
Currency<br />
USD<br />
Review Dates<br />
Quarterly in March, June, September,<br />
December<br />
History<br />
From 30 December 2000<br />
Index Rules and Vendor Codes<br />
Available at www.ftse.com/sgx
<strong>FTSE</strong> SGX Asia Shariah 100 Index Data as at: 30 April 2012<br />
Index Characteristics<br />
Attributes <strong>FTSE</strong> SGX Asia Shariah 100<br />
Number of constituents 100<br />
Net MCap (USDm) 1,389,150<br />
Constituent Sizes (Net MCap USDm)<br />
Average 13,892<br />
Largest 180,046<br />
Smallest 1,451<br />
Median 9,238<br />
Weight of Largest Constituent (%) 12.96<br />
Top 10 Holdings (% Index MCap) 36.86<br />
Data as at: 30 April 2012<br />
bmkImage3<br />
“<strong>FTSE</strong> ® ” is a trade mark of the London Stock Exchange Plc Group companies and is used by <strong>FTSE</strong> International Limited (“<strong>FTSE</strong>”) under licence. SGX-ST is a<br />
trade mark of Singapore Exchange Securities Trading Ltd (“Partner”). All rights in and to the <strong>FTSE</strong> SGX Asia Shariah 100 (“Index”) vest in <strong>FTSE</strong> and/or its<br />
relevant Partner(s). The Industry Classification Benchmark (“ICB”) is owned by <strong>FTSE</strong>.<br />
All information is provided for information purposes only. Every effort is made to ensure that all information given in this publication is accurate, but no<br />
responsibility or liability can be accepted by <strong>FTSE</strong>, any Partner or their licensors for any errors or for any loss from use of this publication. Neither <strong>FTSE</strong>,<br />
Partner nor any of their licensors makes any claim, prediction, warranty or representation whatsoever, expressly or impliedly, either as to the results to be<br />
obtained from the use of the name of the Index set out above or the fitness or suitability of the Index for any particular purpose to which it might be put.<br />
No part of this information may be reproduced, stored in a retrieval system or transmitted in any form or by any means, electronic, mechanical,<br />
photocopying, recording or otherwise, without prior written permission of <strong>FTSE</strong>. Distribution of <strong>FTSE</strong> data and the use of <strong>FTSE</strong> indices to create financial<br />
products requires a licence with <strong>FTSE</strong> and/or its licensors. <strong>FTSE</strong> does not accept any liability to any person for any loss or damage arising out of any error or<br />
omission in the ICB.<br />
Data definitions available from info@ftse.com<br />
For further information visit www.ftse.com,<br />
email info@ftse.com or call your local <strong>FTSE</strong><br />
office:<br />
Beijing +86 (10) 8587 7722<br />
Dubai +971 4 319 9901<br />
Hong Kong +852 2164 3333<br />
London + 44 (0) 20 7866 1810<br />
Milan + 39 02 3604 6953<br />
Mumbai +91 22 6649 4180<br />
New York + 1 888 747 <strong>FTSE</strong> (3873)<br />
Paris +33 (0)1 53 76 82 89<br />
San Francisco +1 888 747 <strong>FTSE</strong> (3873)<br />
Sydney +61 (2) 9293 2864<br />
Tokyo +81 (3) 3581 2811<br />
Source: <strong>FTSE</strong> Group 3 of 3