FTSE Factsheet
FTSE Factsheet
FTSE Factsheet

Create successful ePaper yourself
Turn your PDF publications into a flip-book with our unique Google optimized e-Paper software.
<strong>FTSE</strong> FACTSHEET<br />
<strong>FTSE</strong> TWSE RAFI Taiwan 50 Index<br />
bmkTitle1<br />
The <strong>FTSE</strong> TWSE RAFI ® Taiwan 50 Index was launched in association with the Taiwan Stock<br />
Exchange and Research Affiliates ® , LLC. As part of <strong>FTSE</strong> Group's range of alternative weighted<br />
indices, the <strong>FTSE</strong> RAFI Index Series selects and weights index constituents using four<br />
fundamental factors, rather than market capitalisation. The factors are dividends, cash flows,<br />
sales and book value.<br />
The <strong>FTSE</strong> TWSE RAFI Taiwan 50 Index comprises the top 50 Taiwanese companies with the<br />
largest RAFI fundamental scores, selected from the <strong>FTSE</strong> Global Equity Index Series (excluding<br />
stocks listed on FTO - Taiwan (Taipei OTC)).<br />
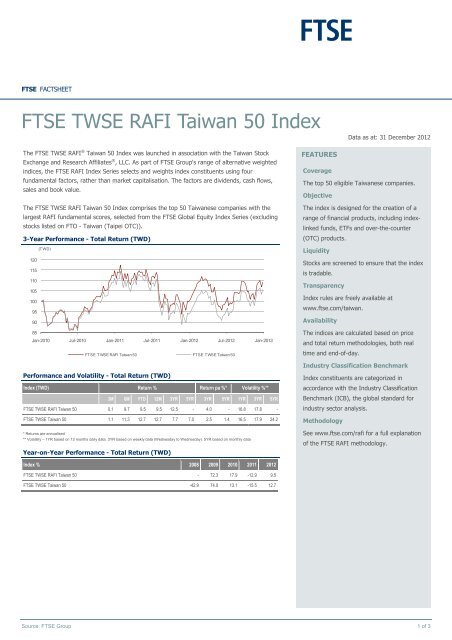
3-Year Performance - Total Return (TWD)<br />
120<br />
115<br />
110<br />
105<br />
100<br />
95<br />
90<br />
85<br />
(T WD)<br />
Jan-2010 Jul-2010 Jan-2011 Jul-2011 Jan-2012 Jul-2012 Jan-2013<br />
<strong>FTSE</strong> T WSE RAFI Taiwan 50 FT SE TWSE Taiwan 50<br />
Performance and Volatility - Total Return (TWD)<br />
Index (TWD) Return % Return pa %* Volatility %**<br />
3M 6M YTD 12M 3YR 5YR 3YR 5YR 1YR 3YR 5YR<br />
<strong>FTSE</strong> TWSE RAFI Taiwan 50 0.1 9.7 9.5 9.5 12.5 - 4.0 - 16.8 17.8 -<br />
<strong>FTSE</strong> TWSE Taiwan 50 1.1 11.3 12.7 12.7 7.7 7.0 2.5 1.4 16.5 17.9 24.2<br />
* Returns are annualised<br />
** Volatility – 1YR based on 12 months daily data. 3YR based on weekly data (Wednesday to Wednesday). 5YR based on monthly data<br />
Year-on-Year Performance - Total Return (TWD)<br />
Index % 2008 2009 2010 2011 2012<br />
<strong>FTSE</strong> TWSE RAFI Taiwan 50 - 72.3 17.9 -12.9 9.5<br />
<strong>FTSE</strong> TWSE Taiwan 50 -42.9 74.0 13.1 -15.5 12.7<br />
FEATURES<br />
Coverage<br />
The top 50 eligible Taiwanese companies.<br />
Objective<br />
The index is designed for the creation of a<br />
range of financial products, including indexlinked<br />
funds, ETFs and over-the-counter<br />
(OTC) products.<br />
Liquidity<br />
Stocks are screened to ensure that the index<br />
is tradable.<br />
Transparency<br />
Index rules are freely available at<br />
www.ftse.com/taiwan.<br />
Availability<br />
The indices are calculated based on price<br />
and total return methodologies, both real<br />
time and end-of-day.<br />
Industry Classification Benchmark<br />
Index constituents are categorized in<br />
accordance with the Industry Classification<br />
Benchmark (ICB), the global standard for<br />
industry sector analysis.<br />
Methodology<br />
Data as at: 31 December 2012<br />
See www.ftse.com/rafi for a full explanation<br />
of the <strong>FTSE</strong> RAFI methodology.<br />
Source: <strong>FTSE</strong> Group 1 of 3
<strong>FTSE</strong> TWSE RAFI Taiwan 50 Index Data as at: 31 December 2012<br />
Top 10 Constituents - <strong>FTSE</strong> TWSE RAFI Taiwan 50 Index<br />
Constituent ICB Sector <strong>FTSE</strong> TWSE RAFI Taiwan 50<br />
(Wgt %)<br />
Taiwan Semiconductor<br />
Manufacturing<br />
Technology Hardware &<br />
Equipment<br />
Hon Hai Precision Industry Electronic & Electrical<br />
Equipment<br />
<strong>FTSE</strong> TWSE Taiwan 50 Diff %<br />
(Wgt %)<br />
14.97 21.43 -6.46<br />
9.00 9.03 -0.03<br />
Nan Ya Plastics Chemicals 4.02 3.77 0.25<br />
Formosa Plastics Corp Chemicals 3.76 4.13 -0.37<br />
Chunghwa Telecom Fixed Line Telecommunications 3.63 3.08 0.55<br />
China Steel Industrial Metals & Mining 3.43 2.69 0.74<br />
Asustek Computer Inc Technology Hardware &<br />
Equipment<br />
AU Optronics Technology Hardware &<br />
Equipment<br />
MediaTek Technology Hardware &<br />
Equipment<br />
3.35 2.11 1.24<br />
3.22 0.98 2.24<br />
3.12 3.74 -0.62<br />
Formosa Chemicals & Fibre Chemicals 2.91 2.75 0.16<br />
Totals 51.41 53.71<br />
ICB Supersector Breakdown<br />
<strong>FTSE</strong> TWSE RAFI Taiwan 50 <strong>FTSE</strong> TWSE Taiwan 50<br />
ICB Code ICB Supersector No. of Cons Wgt % No. of Cons Wgt % Diff %<br />
0500 Oil & Gas 1 1.36 1 1.40 -0.04<br />
1300 Chemicals 3 10.70 4 11.12 -0.43<br />
1700 Basic Resources 1 3.43 1 2.69 0.74<br />
2300 Construction & Materials 2 2.16 2 2.01 0.15<br />
2700 Industrial Goods & Services 5 14.01 6 14.91 -0.89<br />
3300 Automobiles & Parts - - 2 1.92 -1.92<br />
3500 Food & Beverage 1 2.07 1 2.22 -0.15<br />
3700 Personal & Household Goods 2 2.70 2 1.75 0.96<br />
5300 Retail 1 0.62 2 1.86 -1.24<br />
6500 Telecommunications 3 5.75 3 5.64 0.11<br />
8300 Banks 7 7.49 7 7.60 -0.11<br />
8500 Insurance 3 4.79 2 4.37 0.42<br />
8700 Financial Services 2 1.65 2 2.23 -0.58<br />
9500 Technology 19 43.28 15 40.29 2.98<br />
Totals 50 100.00 50 100.00<br />
INFORMATION<br />
Index Universe<br />
<strong>FTSE</strong> Global Equity Index Series (<strong>FTSE</strong><br />
Taiwan Index)<br />
Index Launch<br />
27 October 2008<br />
Base Date<br />
26 March 2008<br />
Base Value<br />
Source: <strong>FTSE</strong> Group 2 of 3<br />
5000<br />
Index Calculation<br />
Real-time (calculated every 15 seconds) and<br />
end-of-day indices available<br />
End-of-Day Distribution<br />
Via FTP and email<br />
Currency<br />
TWD and USD. Real time in TWD only<br />
Review Dates<br />
Annually in March<br />
Index Rules and Vendor Codes<br />
Available at www.ftse.com/taiwan
<strong>FTSE</strong> TWSE RAFI Taiwan 50 Index Data as at: 31 December 2012<br />
Index Characteristics<br />
Attributes <strong>FTSE</strong> TWSE RAFI Taiwan 50 <strong>FTSE</strong> TWSE Taiwan 50<br />
Number of constituents 50 50<br />
Constituent (Wgt %)<br />
Average 2.00 2.00<br />
Largest 14.97 21.43<br />
Median 1.38 1.06<br />
Top 10 Holdings (Wgt %) 51.41 55.06<br />
Data as at: 31 December 2012<br />
bmkImage3<br />
“<strong>FTSE</strong> ® ” is a trade mark of the London Stock Exchange Plc Group companies and is used by <strong>FTSE</strong> International Limited (“<strong>FTSE</strong>”) under licence. TWSE is a<br />
trade mark of the Taiwan Stock Exchange Corporation ("TWSE")("Partner"). Research Affiliates and Fundamental Indices are trade marks of Research<br />
Affiliates LLC (RA) (“Partner”). "Fundamental Index ® " and/or "Research Affiliates Fundamental Index ® " and/or "RAFI" and/or all other RA trademarks, trade<br />
names, patented and patent-pending concepts are the exclusive property of Research Affiliates, LLC. The <strong>FTSE</strong> Research Affiliates Fundamental Indices<br />
("<strong>FTSE</strong>/RAFI Indices") are calculated by <strong>FTSE</strong> RA. All rights in and to the <strong>FTSE</strong> RAFI Index Series (“Index”) vest in <strong>FTSE</strong> and/or its relevant Partner(s). The<br />
Industry Classification Benchmark (“ICB”) is owned by <strong>FTSE</strong>.<br />
All information is provided for information purposes only. Every effort is made to ensure that all information given in this publication is accurate, but no<br />
responsibility or liability can be accepted by <strong>FTSE</strong>, any Partner or their licensors for any errors or for any loss from use of this publication. Neither <strong>FTSE</strong>,<br />
Partner nor any of their licensors makes any claim, prediction, warranty or representation whatsoever, expressly or impliedly, either as to the results to be<br />
obtained from the use of the name of the Index set out above or the fitness or suitability of the Index for any particular purpose to which it might be put.<br />
All figures and graphical representations in this publication refer to past performance and are sourced by <strong>FTSE</strong>. Past performance is not a reliable indicator<br />
of future results. No part of this information may be reproduced, stored in a retrieval system or transmitted in any form or by any means, electronic,<br />
mechanical, photocopying, recording or otherwise, without prior written permission of <strong>FTSE</strong>. Distribution of <strong>FTSE</strong> data and the use of <strong>FTSE</strong> indices to create<br />
financial products requires a licence with <strong>FTSE</strong> and/or its licensors. <strong>FTSE</strong> does not accept any liability to any person for any loss or damage arising out of any<br />
error or omission in the ICB.<br />
Data definitions available from info@ftse.com<br />
For further information visit www.ftse.com,<br />
email info@ftse.com or call your local <strong>FTSE</strong><br />
office:<br />
Beijing +86 (10) 8587 7722<br />
Dubai +971 4 319 9901<br />
Hong Kong +852 2164 3333<br />
London + 44 (0) 20 7866 1810<br />
Milan + 39 02 3604 6953<br />
Mumbai +91 22 6649 4180<br />
New York + 1 888 747 <strong>FTSE</strong> (3873)<br />
Paris +33 (0)1 53 76 82 89<br />
San Francisco +1 888 747 <strong>FTSE</strong> (3873)<br />
Sydney +61 (2) 9293 2864<br />
Tokyo +81 (3) 3581 2811<br />
Source: <strong>FTSE</strong> Group 3 of 3