

September - FTSE
September - FTSE
September - FTSE

Create successful ePaper yourself
Turn your PDF publications into a flip-book with our unique Google optimized e-Paper software.
<strong>FTSE</strong> MONTHLY REPORT - <strong>September</strong> 2012<br />
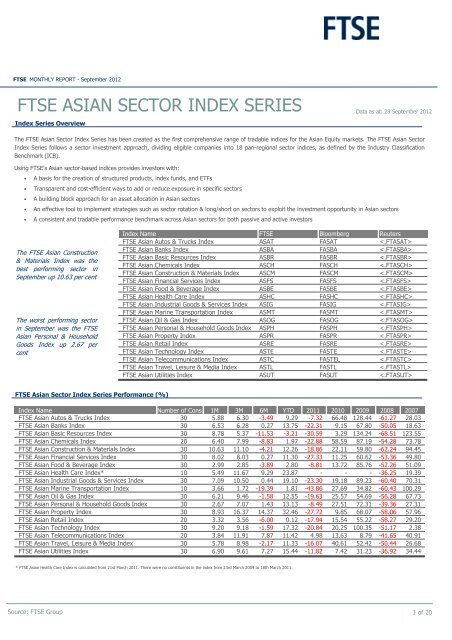
<strong>FTSE</strong> ASIAN SECTOR INDEX SERIES Data as at: 28 <strong>September</strong> 2012<br />
Index Series Overview<br />
The <strong>FTSE</strong> Asian Sector Index Series has been created as the first comprehensive range of tradable indices for the Asian Equity markets. The <strong>FTSE</strong> Asian Sector<br />
Index Series follows a sector investment approach, dividing eligible companies into 18 pan-regional sector indices, as defined by the Industry Classification<br />
Benchmark (ICB).<br />
Using <strong>FTSE</strong>'s Asian sector-based indices provides investors with:<br />
● A basis for the creation of structured products, index funds, and ETFs<br />
● Transparent and cost-efficient ways to add or reduce exposure in specific sectors<br />
● A building block approach for an asset allocation in Asian sectors<br />
● An effective tool to implement strategies such as sector rotation & long/short on sectors to exploit the investment opportunity in Asian sectors<br />
● A consistent and tradable performance benchmark across Asian sectors for both passive and active investors<br />
The <strong>FTSE</strong> Asian Construction<br />
& Materials Index was the<br />
best performing sector in<br />
<strong>September</strong> up 10.63 per cent<br />
The worst performing sector<br />
in <strong>September</strong> was the <strong>FTSE</strong><br />
Asian Personal & Household<br />
Goods Index up 2.67 per<br />
cent<br />
<strong>FTSE</strong> Asian Sector Index Series Performance (%)<br />
Index Name <strong>FTSE</strong> Bloomberg Reuters<br />
<strong>FTSE</strong> Asian Autos & Trucks Index ASAT FASAT <br />
<strong>FTSE</strong> Asian Banks Index ASBA FASBA <br />
<strong>FTSE</strong> Asian Basic Resources Index ASBR FASBR <br />
<strong>FTSE</strong> Asian Chemicals Index ASCH FASCH <br />
<strong>FTSE</strong> Asian Construction & Materials Index ASCM FASCM <br />
<strong>FTSE</strong> Asian Financial Services Index ASFS FASFS <br />
<strong>FTSE</strong> Asian Food & Beverage Index ASBE FASBE <br />
<strong>FTSE</strong> Asian Health Care Index ASHC FASHC <br />
<strong>FTSE</strong> Asian Industrial Goods & Services Index ASIG FASIG <br />
<strong>FTSE</strong> Asian Marine Transportation Index ASMT FASMT <br />
<strong>FTSE</strong> Asian Oil & Gas Index ASOG FASOG <br />
<strong>FTSE</strong> Asian Personal & Household Goods Index ASPH FASPH <br />
<strong>FTSE</strong> Asian Property Index ASPR FASPR <br />
<strong>FTSE</strong> Asian Retail Index ASRE FASRE <br />
<strong>FTSE</strong> Asian Technology Index ASTE FASTE <br />
<strong>FTSE</strong> Asian Telecommunications Index ASTC FASTEL <br />
<strong>FTSE</strong> Asian Travel, Leisure & Media Index ASTL FASTL <br />
<strong>FTSE</strong> Asian Utilities Index ASUT FASUT <br />
Index Name Number of Cons. 1M 3M 6M YTD 2011 2010 2009 2008 2007<br />
<strong>FTSE</strong> Asian Autos & Trucks Index<br />
30 5.88 6.30 -3.49 9.29 -7.32 66.48 128.44 -61.27 28.03<br />
<strong>FTSE</strong> Asian Banks Index<br />
30 6.53 6.28 0.27 13.75 -22.31 9.15 67.80 -50.05 18.63<br />
<strong>FTSE</strong> Asian Basic Resources Index<br />
30 8.78 5.37 -11.53 -3.21 -30.59 3.29 134.24 -68.51 123.55<br />
<strong>FTSE</strong> Asian Chemicals Index<br />
20 6.40 7.99 -8.83 1.97 -22.88 58.59 87.19 -54.28 73.78<br />
<strong>FTSE</strong> Asian Construction & Materials Index<br />
30 10.63 11.10 -4.21 12.26 -18.86 22.11 59.80 -62.24 94.45<br />
<strong>FTSE</strong> Asian Financial Services Index<br />
30 8.02 8.03 0.27 11.30 -27.33 11.25 60.62 -53.36 49.80<br />
<strong>FTSE</strong> Asian Food & Beverage Index<br />
30 2.99 2.85 -3.89 2.80 -8.81 13.72 85.76 -52.26 51.09<br />
<strong>FTSE</strong> Asian Health Care Index*<br />
10 5.49 11.67 9.29 23.87 - - - -36.25 19.39<br />
<strong>FTSE</strong> Asian Industrial Goods & Services Index<br />
30 7.09 10.50 0.44 19.10 -23.30 19.18 89.23 -60.40 70.31<br />
<strong>FTSE</strong> Asian Marine Transportation Index<br />
10 3.66 1.72 -19.39 1.81 -43.86 27.69 34.82 -60.43 100.29<br />
<strong>FTSE</strong> Asian Oil & Gas Index<br />
30 6.21 9.46 -1.58 12.55 -19.63 25.57 54.69 -56.28 67.73<br />
<strong>FTSE</strong> Asian Personal & Household Goods Index<br />
30 2.67 7.07 1.43 13.13 -8.49 27.51 72.31 -39.36 27.31<br />
<strong>FTSE</strong> Asian Property Index<br />
30 8.93 16.37 14.37 32.46 -27.72 9.85 68.07 -58.06 57.96<br />
<strong>FTSE</strong> Asian Retail Index<br />
20 3.32 3.56 -6.00 0.12 -17.94 15.54 55.22 -58.27 29.20<br />
<strong>FTSE</strong> Asian Technology Index<br />
30 9.20 9.18 -1.59 17.32 -20.84 20.25 100.35 -51.17 2.38<br />
<strong>FTSE</strong> Asian Telecommunications Index<br />
20 3.84 11.91 7.87 11.42 4.98 13.63 8.79 -41.65 40.91<br />
<strong>FTSE</strong> Asian Travel, Leisure & Media Index<br />
30 5.78 8.98 -2.17 11.33 -16.07 40.61 52.42 -50.44 26.68<br />
<strong>FTSE</strong> Asian Utilities Index<br />
30 6.90 9.61 7.27 15.44 -11.82 7.42 31.23 -36.92 34.44<br />
* <strong>FTSE</strong> Asian Health Care Index is calculated from 21st March 2011. There were no constituents in the index from 23rd March 2009 to 18th March 2011.<br />
Source: <strong>FTSE</strong> Group 1 of 20
<strong>FTSE</strong> Asian Auto & Trucks Index Data as at: 28 <strong>September</strong> 2012<br />
Index Overview<br />
<strong>FTSE</strong> Asian Auto & Trucks Index consists of manufacturers and distributors of commercial or passenger vehicles, motorcycles, heavy agricultural and construction machinery. It also<br />
includes companies that provides commercial trucking services and manufacturers of new and replacement parts for motorcycles and retreaders of automobiles, truck and<br />
motorcycle tires.<br />
Historical Performance (%)<br />
Index Name Number of Cons.<br />
<strong>FTSE</strong> Asian Autos & Trucks Index<br />
<strong>FTSE</strong> Asia Pacific ex Japan Index<br />
Historical Volatility (%)<br />
Index Name 1M 3M 6M YTD 2011 2010 2009 2008 2007<br />
<strong>FTSE</strong> Asian Autos & Trucks Index<br />
<strong>FTSE</strong> Asia Pacific ex Japan Index<br />
Top 5 Constituents by Index Weighting Vendor Codes<br />
Rank<br />
1<br />
2<br />
3<br />
4<br />
5<br />
Constituent Name<br />
Country<br />
ICB Subsector<br />
Wgt in Index (%)<br />
<strong>FTSE</strong><br />
ASAT<br />
Hyundai Motor South Korea Automobiles 15.56<br />
Bloomberg FASAT<br />
Astra International Indonesia Auto Parts 13.34<br />
Reuters <br />
Hyundai Mobis South Korea Auto Parts<br />
KIA Motors South Korea Automobiles<br />
24.95 21.40 21.44 21.22<br />
16.33 15.82 16.11 15.64<br />
Hyundai Heavy Industries South Korea Commercial Vehicles & Trucks<br />
33.64 23.54 35.02 49.59 23.60<br />
23.19 18.33 25.92 40.26 21.62<br />
5 Year Historical Country Weightings Breakdown Country Weightings Breakdown % - <strong>September</strong> 2012<br />
100%<br />
80%<br />
60%<br />
40%<br />
20%<br />
0%<br />
1M<br />
30 5.88 6.30 -3.49 9.29 -7.32 66.48<br />
5.60<br />
● China<br />
● Hong Kong, SAR<br />
● India<br />
● Indonesia<br />
● Malaysia<br />
● Philippines<br />
● Singapore<br />
● South Korea<br />
● Taiwan<br />
● Thailand<br />
5 Year Historical ICB Subsector Weightings Breakdown ICB Subsector Weightings Breakdown % - <strong>September</strong> 2012<br />
100%<br />
80%<br />
60%<br />
40%<br />
20%<br />
0%<br />
-<br />
3M<br />
8.58<br />
● Automobiles<br />
● Auto Parts<br />
● Commercial<br />
Vehicles & Trucks<br />
● Tires<br />
● Trucking<br />
Source: <strong>FTSE</strong> Group 2 of 20<br />
6M<br />
0.48<br />
58.69<br />
25.47<br />
YTD 2011<br />
12.48<br />
-17.96<br />
4.53<br />
11.63<br />
10.82<br />
5.62<br />
7.40<br />
39.32<br />
2010<br />
2009<br />
128.44<br />
2008<br />
-61.27<br />
16.78 69.64 -53.24<br />
5.66 1.22<br />
10.62<br />
1.63<br />
0.88<br />
29.59<br />
16.78<br />
2007<br />
28.03<br />
35.85<br />
12M Div Yld<br />
1.45<br />
3.05
<strong>FTSE</strong> Asian Banks Index Data as at: 28 <strong>September</strong> 2012<br />
Index Overview<br />
<strong>FTSE</strong> Asian Banks Index consists of banks providing a broad range of financial services, including retail banking, loans and money transmissions.<br />
Historical Performance (%)<br />
Index Name Number of Cons. 1M 3M 6M YTD 2011 2010 2009 2008 2007 12M Div Yld<br />
<strong>FTSE</strong> Asian Banks Index<br />
<strong>FTSE</strong> Asia Pacific ex Japan Index<br />
Historical Volatility (%)<br />
Index Name 1M 3M 6M YTD 2011 2010 2009 2008<br />
<strong>FTSE</strong> Asian Banks Index<br />
<strong>FTSE</strong> Asia Pacific ex Japan Index<br />
16.33 15.82 16.11 15.64 23.19 18.33 25.92 40.26 21.62<br />
Top 5 Constituents by Index Weighting Vendor Codes<br />
Rank Constituent Name Country ICB Subsector Wgt in Index (%)<br />
<strong>FTSE</strong><br />
ASBA<br />
1 HSBC Holdings Hong Kong, SAR Banks 14.87<br />
Bloomberg FASBA<br />
2 China Construction Bank (H) China Banks 10.87<br />
Reuters <br />
3 ICBC (H) China Banks<br />
8.35<br />
4 Bank of China (H) China Banks<br />
6.91<br />
5 DBS Group Holdings Singapore Banks<br />
4.63<br />
5 Year Historical Country Weightings Breakdown Country Weightings Breakdown % - <strong>September</strong> 2012<br />
100%<br />
80%<br />
60%<br />
40%<br />
20%<br />
0%<br />
30 6.53 6.28 0.27 13.75 -22.31 9.15 67.80 -50.05<br />
- 5.60 8.58 0.48 12.48 -17.96 16.78 69.64 -53.24 35.85 3.05<br />
● China<br />
● Hong Kong, SAR<br />
● India<br />
● Indonesia<br />
● Malaysia<br />
● Philippines<br />
● Singapore<br />
● South Korea<br />
● Taiwan<br />
● Thailand<br />
5 Year Historical ICB Subsector Weightings Breakdown ICB Subsector Weightings Breakdown % - <strong>September</strong> 2012<br />
100%<br />
80%<br />
60%<br />
40%<br />
20%<br />
0%<br />
● Banks<br />
Source: <strong>FTSE</strong> Group 3 of 20<br />
2007<br />
17.76 16.64 16.33 16.56 24.77 18.09 31.04 41.70 22.51<br />
12.96<br />
8.37<br />
7.37<br />
6.00<br />
1.45 4.03<br />
8.15<br />
100.00<br />
22.04<br />
29.62<br />
18.63 3.81
<strong>FTSE</strong> Asian Basic Resources Index Data as at: 28 <strong>September</strong> 2012<br />
Index Overview<br />
<strong>FTSE</strong> Asian Basic Resources Index consists of companies engaged in forestry & paper sectors, manufacturer and traders of industrial metals such as, aluminium, steel and<br />
nonferrous metals. It also includes companies engaged in the exploration for or mining of coal, diamonds, gold or other precious metals.<br />
Historical Performance (%)<br />
Index Name Number of Cons. 1M 3M 6M YTD 2011 2010 2009 2008 2007 12M Div Yld<br />
<strong>FTSE</strong> Asian Basic Resources Index<br />
<strong>FTSE</strong> Asia Pacific ex Japan Index<br />
Historical Volatility (%)<br />
Index Name 1M 3M 6M YTD 2011 2010 2009 2008<br />
<strong>FTSE</strong> Asian Basic Resources Index<br />
<strong>FTSE</strong> Asia Pacific ex Japan Index<br />
16.33 15.82 16.11 15.64 23.19 18.33 25.92 40.26 21.62<br />
Top 5 Constituents by Index Weighting Vendor Codes<br />
Rank Constituent Name Country ICB Subsector Wgt in Index (%)<br />
<strong>FTSE</strong><br />
ASBR<br />
1 Posco South Korea Iron & Steel 14.55<br />
Bloomberg FASBR<br />
2 China Shenhua Energy (H) China Coal 14.10<br />
Reuters <br />
3 China Steel Taiwan Iron & Steel<br />
11.18<br />
4 Korea Zinc South Korea Nonferrous Metals<br />
6.64<br />
5 Coal India India Coal<br />
4.60<br />
5 Year Historical Country Weightings Breakdown Country Weightings Breakdown % - <strong>September</strong> 2012<br />
100%<br />
80%<br />
60%<br />
40%<br />
20%<br />
0%<br />
30 8.78 5.37 -11.53 -3.21 -30.59 3.29 134.24 -68.51<br />
● China<br />
● Hong Kong, SAR<br />
● India<br />
● Indonesia<br />
● Malaysia<br />
● Philippines<br />
● Singapore<br />
● South Korea<br />
● Taiwan<br />
● Thailand<br />
5 Year Historical ICB Subsector Weightings Breakdown ICB Subsector Weightings Breakdown % - <strong>September</strong> 2012<br />
100%<br />
80%<br />
60%<br />
40%<br />
20%<br />
0%<br />
● Aluminium<br />
● Coal<br />
● Diamonds & Gems<br />
● Forestry<br />
● General Mining<br />
● Gold Mining<br />
● Iron & Steel<br />
● Nonferrous Metals<br />
● Paper<br />
● Plat & Precious Met<br />
Source: <strong>FTSE</strong> Group 4 of 20<br />
2007<br />
28.15 22.74 20.62 20.73 27.30 25.70 37.69 56.02 32.57<br />
123.55 3.05<br />
- 5.60 8.58 0.48 12.48 -17.96 16.78 69.64 -53.24 35.85 3.05<br />
25.88<br />
40.66<br />
11.18<br />
1.58<br />
6.06<br />
0.75<br />
1.48<br />
1.42<br />
16.90<br />
19.69<br />
1.70<br />
30.96<br />
3.16<br />
38.58
<strong>FTSE</strong> Asian Chemicals Index Data as at: 28 <strong>September</strong> 2012<br />
Index Overview<br />
<strong>FTSE</strong> Asian Chemicals Index consists of producers and distributors of commodity chemicals and specialty chemicals. Commodity chemicals are simple chemical products that are<br />
primarily used to formulate more complex chemicals and specialty chemical are those finished chemicals for industries or end users.<br />
Historical Performance (%)<br />
Index Name Number of Cons. 1M 3M 6M YTD 2011 2010 2009 2008 2007 12M Div Yld<br />
<strong>FTSE</strong> Asian Chemicals Index<br />
<strong>FTSE</strong> Asia Pacific ex Japan Index<br />
Historical Volatility (%)<br />
Index Name 1M 3M 6M YTD 2011 2010 2009 2008<br />
<strong>FTSE</strong> Asian Chemicals Index<br />
<strong>FTSE</strong> Asia Pacific ex Japan Index<br />
16.33 15.82 16.11 15.64 23.19 18.33 25.92 40.26 21.62<br />
Top 5 Constituents by Index Weighting Vendor Codes<br />
Rank Constituent Name Country ICB Subsector Wgt in Index (%)<br />
<strong>FTSE</strong><br />
ASCH<br />
1 Nan Ya Plastics Taiwan Commodity Chemicals 15.36<br />
Bloomberg FASCH<br />
2 LG Chemical South Korea Commodity Chemicals 15.30<br />
Reuters <br />
3 Formosa Plastics Corp Taiwan Commodity Chemicals<br />
14.81<br />
4 Formosa Chemicals & Fibre Taiwan Commodity Chemicals<br />
13.45<br />
5 PETRONAS Chemicals Group Bhd Malaysia Commodity Chemicals<br />
7.85<br />
5 Year Historical Country Weightings Breakdown Country Weightings Breakdown % - <strong>September</strong> 2012<br />
100%<br />
80%<br />
60%<br />
40%<br />
20%<br />
0%<br />
20 6.40 7.99 -8.83 1.97 -22.88 58.59 87.19 -54.28<br />
● China<br />
● Hong Kong, SAR<br />
● India<br />
● Indonesia<br />
● Malaysia<br />
● Philippines<br />
● Singapore<br />
● South Korea<br />
● Taiwan<br />
● Thailand<br />
5 Year Historical ICB Subsector Weightings Breakdown ICB Subsector Weightings Breakdown % - <strong>September</strong> 2012<br />
100%<br />
80%<br />
60%<br />
40%<br />
20%<br />
0%<br />
● Commodity<br />
Chemicals<br />
● Speciality<br />
Chemicals<br />
Source: <strong>FTSE</strong> Group 5 of 20<br />
2007<br />
20.85 20.91 21.79 20.85 31.32 21.21 27.18 36.94 21.71<br />
73.78 2.90<br />
- 5.60 8.58 0.48 12.48 -17.96 16.78 69.64 -53.24 35.85 3.05<br />
45.96<br />
9.52<br />
3.21<br />
1.76 3.37<br />
2.05<br />
7.85<br />
90.48<br />
35.80
<strong>FTSE</strong> Asian Construction & Materials Index<br />
Index Overview<br />
<strong>FTSE</strong> Asian Construction & Materials Index consists of producers of materials used in the construction and refurbishment of buildings and structures and also companies engaged in<br />
the construction of commercial buildings and infrastructure.<br />
Historical Performance (%)<br />
Index Name Number of Cons. 1M 3M 6M YTD 2011 2010 2009 2008 2007 12M Div Yld<br />
<strong>FTSE</strong> Asian Construction & Materials Index<br />
<strong>FTSE</strong> Asia Pacific ex Japan Index<br />
Historical Volatility (%)<br />
Index Name 1M 3M 6M YTD 2011 2010 2009 2008<br />
<strong>FTSE</strong> Asian Construction & Materials Index<br />
<strong>FTSE</strong> Asia Pacific ex Japan Index<br />
16.33 15.82 16.11 15.64 23.19 18.33 25.92 40.26 21.62<br />
Top 5 Constituents by Index Weighting Vendor Codes<br />
Rank Constituent Name Country ICB Subsector Wgt in Index (%)<br />
<strong>FTSE</strong><br />
ASCM<br />
1 Samsung C&T South Korea Heavy Construction 10.61<br />
Bloomberg FASCM<br />
2 Samsung Eng South Korea Heavy Construction 7.94<br />
Reuters <br />
3 Hyundai Engineering & Construction South Korea Heavy Construction<br />
5.79<br />
4 Taiwan Cement Taiwan Building Materials & Fixtures<br />
5.26<br />
5 Semen Gresik Indonesia Building Materials & Fixtures<br />
5.15<br />
5 Year Historical Country Weightings Breakdown Country Weightings Breakdown % - <strong>September</strong> 2012<br />
100%<br />
80%<br />
60%<br />
40%<br />
20%<br />
0%<br />
30 10.63 11.10 -4.21 12.26 -18.86 22.11 59.80 -62.24<br />
● China<br />
● Hong Kong, SAR<br />
● India<br />
● Indonesia<br />
● Malaysia<br />
● Philippines<br />
● Singapore<br />
● South Korea<br />
● Taiwan<br />
● Thailand<br />
5 Year Historical ICB Subsector Weightings Breakdown ICB Subsector Weightings Breakdown % - <strong>September</strong> 2012<br />
100%<br />
80%<br />
60%<br />
40%<br />
20%<br />
0%<br />
● Building Materials<br />
& Fixtures<br />
● Heavy<br />
Construction<br />
Source: <strong>FTSE</strong> Group 6 of 20<br />
2007<br />
24.99 21.30 20.91 20.84 28.86 20.54 31.34 51.13 27.03<br />
Data as at: 28 <strong>September</strong> 2012<br />
94.45 2.02<br />
- 5.60 8.58 0.48 12.48 -17.96 16.78 69.64 -53.24 35.85 3.05<br />
35.77<br />
51.91<br />
10.87<br />
5.45<br />
2.67<br />
15.62<br />
7.86<br />
1.99<br />
19.77<br />
48.09
<strong>FTSE</strong> Asian Financial Services Index Data as at: 28 <strong>September</strong> 2012<br />
Index Overview<br />
<strong>FTSE</strong> Asian Financial Services Index consists of companies in the life and nonlife insurance sectors. Companies providing services on consumer finance, specialty finance, investment<br />
services and asset managers are also included in this sector.<br />
Historical Performance (%)<br />
Index Name Number of Cons. 1M 3M 6M YTD 2011 2010 2009 2008 2007 12M Div Yld<br />
<strong>FTSE</strong> Asian Financial Services Index<br />
<strong>FTSE</strong> Asia Pacific ex Japan Index<br />
Historical Volatility (%)<br />
Index Name 1M 3M 6M YTD 2011 2010 2009 2008<br />
<strong>FTSE</strong> Asian Financial Services Index<br />
<strong>FTSE</strong> Asia Pacific ex Japan Index<br />
16.33 15.82 16.11 15.64 23.19 18.33 25.92 40.26 21.62<br />
Top 5 Constituents by Index Weighting Vendor Codes<br />
Rank Constituent Name Country ICB Subsector Wgt in Index (%)<br />
<strong>FTSE</strong><br />
ASFS<br />
1 AIA Group Ltd. Hong Kong, SAR Life Insurance 14.92<br />
Bloomberg FASFS<br />
2 China Life Insurance (H) China Life Insurance 12.22<br />
Reuters <br />
3 Ping An Insurance (H) China Life Insurance<br />
10.08<br />
4 Hong Kong Exchanges & Clearing Hong Kong, SAR Investment Services<br />
9.28<br />
5 Samsung F & M Ins Co South Korea Property & Casualty Insurance<br />
5.79<br />
5 Year Historical Country Weightings Breakdown Country Weightings Breakdown % - <strong>September</strong> 2012<br />
100%<br />
80%<br />
60%<br />
40%<br />
20%<br />
0%<br />
30 8.02 8.03 0.27 11.30 -27.33 11.25 60.62 -53.36<br />
● China<br />
● Hong Kong, SAR<br />
● India<br />
● Indonesia<br />
● Malaysia<br />
● Philippines<br />
● Singapore<br />
● South Korea<br />
● Taiwan<br />
● Thailand<br />
5 Year Historical ICB Subsector Weightings Breakdown ICB Subsector Weightings Breakdown % - <strong>September</strong> 2012<br />
100%<br />
80%<br />
60%<br />
40%<br />
20%<br />
0%<br />
● Asset Managers<br />
● Consumer Finance<br />
● Full Line Insurance<br />
● Insurance Brokers<br />
● Investment Services<br />
● Life Insurance<br />
● Property &<br />
Casualty Insurance<br />
● Reinsurance<br />
● Specialty Finance<br />
Source: <strong>FTSE</strong> Group 7 of 20<br />
2007<br />
23.12 20.13 19.47 20.10 27.84 20.41 34.02 47.43 27.67<br />
49.80 1.94<br />
- 5.60 8.58 0.48 12.48 -17.96 16.78 69.64 -53.24 35.85 3.05<br />
19.96<br />
15.47<br />
3.47<br />
4.59<br />
11.29<br />
7.70<br />
59.09<br />
0.75<br />
24.20<br />
21.17<br />
32.31
<strong>FTSE</strong> Asian Food & Beverage Index Data as at: 28 <strong>September</strong> 2012<br />
Index Overview<br />
<strong>FTSE</strong> Asian Food & Beverage Index consists of manufacturers and distributors of beer, wines and spirits, non-alcoholic beverage and food products. It also includes companies in<br />
the farming and fishing sector that grow crops or raise livestock, operate fisheries or own non-tobacco plantations.<br />
Historical Performance (%)<br />
Index Name Number of Cons. 1M 3M 6M YTD 2011 2010 2009 2008 2007 12M Div Yld<br />
<strong>FTSE</strong> Asian Food & Beverage Index<br />
<strong>FTSE</strong> Asia Pacific ex Japan Index<br />
Historical Volatility (%)<br />
Index Name 1M 3M 6M YTD 2011 2010 2009 2008<br />
<strong>FTSE</strong> Asian Food & Beverage Index<br />
<strong>FTSE</strong> Asia Pacific ex Japan Index<br />
16.33 15.82 16.11 15.64 23.19 18.33 25.92 40.26 21.62<br />
Top 5 Constituents by Index Weighting Vendor Codes<br />
Rank Constituent Name Country ICB Subsector Wgt in Index (%)<br />
<strong>FTSE</strong> ASBE<br />
1 Uni-president Enterprises Taiwan Food Products 9.15<br />
Bloomberg FASBE<br />
2 Want Want China Holdings Ltd. Hong Kong, SAR Food Products 8.93<br />
Reuters <br />
3 IOI Malaysia Farming & Fishing<br />
8.31<br />
4 Wilmar International Limited Singapore Food Products<br />
7.18<br />
5 Tingyi (Cayman Islands) Holdings Hong Kong, SAR Food Products<br />
7.14<br />
5 Year Historical Country Weightings Breakdown Country Weightings Breakdown % - <strong>September</strong> 2012<br />
100%<br />
80%<br />
60%<br />
40%<br />
20%<br />
0%<br />
30 2.99 2.85 -3.89 2.80 -8.81 13.72 85.76 -52.26<br />
● China<br />
● Hong Kong, SAR<br />
● India<br />
● Indonesia<br />
● Malaysia<br />
● Philippines<br />
● Singapore<br />
● South Korea<br />
● Taiwan<br />
● Thailand<br />
5 Year Historical ICB Subsector Weightings Breakdown ICB Subsector Weightings Breakdown % - <strong>September</strong> 2012<br />
100%<br />
80%<br />
60%<br />
40%<br />
20%<br />
0%<br />
● Brewers<br />
● Distillers &<br />
Vintners<br />
● Farming & Fishing<br />
● Food Products<br />
● Soft Drinks<br />
Source: <strong>FTSE</strong> Group 8 of 20<br />
2007<br />
13.80 14.18 14.30 14.09 20.26 17.49 20.44 36.34 21.53<br />
51.09 1.87<br />
- 5.60 8.58 0.48 12.48 -17.96 16.78 69.64 -53.24 35.85 3.05<br />
9.96<br />
16.37<br />
65.69<br />
9.15<br />
2.65<br />
4.85<br />
5.07<br />
16.72<br />
5.53 1.57<br />
6.92<br />
23.59<br />
4.71<br />
27.21
<strong>FTSE</strong> Asian Health Care Index Data as at: 28 <strong>September</strong> 2012<br />
Index Overview<br />
<strong>FTSE</strong> Asian Health Care Index consists of manufacturers and distributors of medical devices, medical supplies and prescription or over-the-counter drugs. It also includes companies<br />
engaged in biotechnology research and operators of health maintenance organizations, hospitals, clinics, rehabilitation and retirement centres.<br />
* <strong>FTSE</strong> Asian Health Care Index is calculated from 21st March 2011. There were no constituents in the index from 23rd March 2009 to 18th March 2011.<br />
Historical Performance (%)<br />
Index Name Number of Cons. 1M 3M 6M YTD 2011 2010 2009 2008 2007 12M Div Yld<br />
<strong>FTSE</strong> Asian Health Care Index<br />
<strong>FTSE</strong> Asia Pacific ex Japan Index<br />
Historical Volatility (%)<br />
Index Name 1M 3M 6M YTD 2011 2010 2009 2008<br />
<strong>FTSE</strong> Asian Health Care Index<br />
<strong>FTSE</strong> Asia Pacific ex Japan Index<br />
16.33 15.82 16.11 15.64 23.19 18.33 25.92 40.26 21.62<br />
Top 5 Constituents by Index Weighting Vendor Codes<br />
Rank Constituent Name Country ICB Subsector Wgt in Index (%)<br />
<strong>FTSE</strong> ASHC<br />
1 Sun Pharmaceuticals Industries India Pharmaceuticals 15.47<br />
Bloomberg FASHC<br />
2 Celltrion Inc South Korea Biotechnology 13.98<br />
Reuters <br />
3 Dr Reddys Laboratories India Pharmaceuticals<br />
11.30<br />
4 IHH Healthcare Malaysia Health Care Providers<br />
11.12<br />
5 Cipla India Pharmaceuticals<br />
10.19<br />
5 Year Historical Country Weightings Breakdown Country Weightings Breakdown % - <strong>September</strong> 2012<br />
100%<br />
80%<br />
60%<br />
40%<br />
20%<br />
0%<br />
10 5.49 11.67 9.29 23.87 - - - -36.25<br />
● China<br />
● Hong Kong, SAR<br />
● India<br />
● Indonesia<br />
● Malaysia<br />
● Philippines<br />
● Singapore<br />
● South Korea<br />
● Taiwan<br />
● Thailand<br />
5 Year Historical ICB Subsector Weightings Breakdown ICB Subsector Weightings Breakdown % - <strong>September</strong> 2012<br />
● Biotechnology<br />
● Health Care<br />
Providers<br />
● Medical Equipment<br />
● Medical Supplies<br />
● Pharmaceuticals<br />
Source: <strong>FTSE</strong> Group 9 of 20<br />
2007<br />
10.95 13.79 13.93 13.96 - - - 32.46 19.21<br />
19.39 0.53<br />
- 5.60 8.58 0.48 12.48 -17.96 16.78 69.64 -53.24 35.85 3.05<br />
100% 13.98<br />
80%<br />
60%<br />
40%<br />
20%<br />
0%<br />
11.12<br />
59.99<br />
13.98<br />
4.75<br />
20.31<br />
49.84<br />
10.17<br />
15.87
<strong>FTSE</strong> Asian Industrial Goods & Services Index<br />
Index Overview<br />
<strong>FTSE</strong> Asian Industrial Goods & Services Index consists of companies engaged in aerospace & defense industry, container & packaging, electrical components & equipment and<br />
industrial machinery. It also includes operators of mail and package delivery services, industrial railway transportation and railway lines, transportations services and companies in<br />
the support services sectors.<br />
Historical Performance (%)<br />
Index Name Number of Cons. 1M 3M 6M YTD 2011 2010 2009 2008 2007 12M Div Yld<br />
<strong>FTSE</strong> Asian Industrial Goods & Services Index<br />
<strong>FTSE</strong> Asia Pacific ex Japan Index<br />
Historical Volatility (%)<br />
Index Name 1M 3M 6M YTD 2011 2010 2009 2008<br />
<strong>FTSE</strong> Asian Industrial Goods & Services Index<br />
<strong>FTSE</strong> Asia Pacific ex Japan Index<br />
16.33 15.82 16.11 15.64 23.19 18.33 25.92 40.26 21.62<br />
Top 5 Constituents by Index Weighting Vendor Codes<br />
Rank Constituent Name Country ICB Subsector Wgt in Index (%)<br />
<strong>FTSE</strong> ASIG<br />
1 Hutchison Whampoa Hong Kong, SAR Diversified Industrials 15.13<br />
Bloomberg FASIG<br />
2 Hon Hai Precision Industry Taiwan Electrical Components & Equipment 14.24<br />
Reuters <br />
3 Jardine Matheson Hong Kong, SAR Diversified Industrials<br />
9.00<br />
4 Sime Darby Bhd Malaysia Diversified Industrials<br />
8.55<br />
5 Swire Pacific A Hong Kong, SAR Diversified Industrials<br />
6.57<br />
5 Year Historical Country Weightings Breakdown Country Weightings Breakdown % - <strong>September</strong> 2012<br />
100%<br />
80%<br />
60%<br />
40%<br />
20%<br />
0%<br />
30 7.09 10.50 0.44 19.10 -23.30 19.18 89.23 -60.40<br />
● China<br />
● Hong Kong, SAR<br />
● India<br />
● Indonesia<br />
● Malaysia<br />
● Philippines<br />
● Singapore<br />
● South Korea<br />
● Taiwan<br />
● Thailand<br />
5 Year Historical ICB Subsector Weightings Breakdown ICB Subsector Weightings Breakdown % - <strong>September</strong> 2012<br />
100%<br />
80%<br />
60%<br />
40%<br />
20%<br />
0%<br />
● Aerospace<br />
● Defense<br />
● Diversified<br />
Industrials<br />
● Electrical Comp &<br />
Equipment<br />
● Industrial Machinery<br />
● Industrial Suppliers<br />
● Transportation<br />
Services<br />
Source: <strong>FTSE</strong> Group 10 of 20<br />
2007<br />
14.19 14.13 15.57 15.38 21.78 17.64 26.22 42.80 25.93<br />
Data as at: 28 <strong>September</strong> 2012<br />
70.31 2.44<br />
- 5.60 8.58 0.48 12.48 -17.96 16.78 69.64 -53.24 35.85 3.05<br />
7.73<br />
14.10<br />
19.08<br />
16.33<br />
2.61<br />
8.55<br />
1.62<br />
3.73<br />
8.24<br />
0.66<br />
2.80<br />
0.74<br />
2.63<br />
9.32<br />
64.70<br />
37.16
<strong>FTSE</strong> Asian Marine Transportation Index<br />
Index Overview<br />
<strong>FTSE</strong> Asian Marine Transportation Index consists of providers of on-water transportation for commercial markets such as container shipping.<br />
Historical Performance (%)<br />
Index Name Number of Cons. 1M 3M 6M YTD 2011 2010 2009 2008 2007 12M Div Yld<br />
<strong>FTSE</strong> Asian Marine Transportation Index<br />
<strong>FTSE</strong> Asia Pacific ex Japan Index<br />
Historical Volatility (%)<br />
Index Name 1M 3M 6M YTD 2011 2010 2009 2008<br />
<strong>FTSE</strong> Asian Marine Transportation Index<br />
<strong>FTSE</strong> Asia Pacific ex Japan Index<br />
16.33 15.82 16.11 15.64 23.19 18.33 25.92 40.26 21.62<br />
Top 5 Constituents by Index Weighting Vendor Codes<br />
Rank Constituent Name Country ICB Subsector Wgt in Index (%)<br />
<strong>FTSE</strong> ASMT<br />
1 Hyundai Merchant Marine South Korea Marine Transportation 15.39<br />
Bloomberg FASMT<br />
2 Cosco Pacific (Red Chip) China Marine Transportation 15.19<br />
Reuters <br />
3 Orient Overseas International Hong Kong, SAR Marine Transportation<br />
12.41<br />
4 Hanjin Shipping Co. Ltd. New South Korea Marine Transportation<br />
10.24<br />
5 Bumi Armada Malaysia Marine Transportation<br />
9.54<br />
5 Year Historical Country Weightings Breakdown Country Weightings Breakdown % - <strong>September</strong> 2012<br />
100%<br />
80%<br />
60%<br />
40%<br />
20%<br />
0%<br />
10 3.66 1.72 -19.39 1.81 -43.86 27.69 34.82 -60.43<br />
● China<br />
● Hong Kong, SAR<br />
● India<br />
● Indonesia<br />
● Malaysia<br />
● Philippines<br />
● Singapore<br />
● South Korea<br />
● Taiwan<br />
● Thailand<br />
5 Year Historical ICB Subsector Weightings Breakdown ICB Subsector Weightings Breakdown % - <strong>September</strong> 2012<br />
100%<br />
80%<br />
60%<br />
40%<br />
20%<br />
0%<br />
● Marine<br />
Transportation<br />
Source: <strong>FTSE</strong> Group 11 of 20<br />
2007<br />
28.41 24.51 26.03 26.01 33.07 25.79 39.30 54.33 35.38<br />
Data as at: 28 <strong>September</strong> 2012<br />
100.29 1.10<br />
- 5.60 8.58 0.48 12.48 -17.96 16.78 69.64 -53.24 35.85 3.05<br />
25.63<br />
19.23<br />
8.50<br />
100.00<br />
9.54<br />
24.68<br />
12.41
<strong>FTSE</strong> Asian Oil & Gas Index Data as at: 28 <strong>September</strong> 2012<br />
Index Overview<br />
<strong>FTSE</strong> Asian Oil & Gas Index consists of companies engaged in exploration for and drilling, distribution and supply of oil and gas products. It also includes supplier of equipment and<br />
services to oil fields and offshore platforms and operators of pipelines. Companies that manufacture renewable energy equipment and produce alternative fules are also included in<br />
this index.<br />
Historical Performance (%)<br />
Index Name Number of Cons. 1M 3M 6M YTD 2011 2010 2009 2008 2007 12M Div Yld<br />
<strong>FTSE</strong> Asian Oil & Gas Index<br />
<strong>FTSE</strong> Asia Pacific ex Japan Index<br />
Historical Volatility (%)<br />
Index Name 1M 3M 6M YTD 2011 2010 2009 2008<br />
<strong>FTSE</strong> Asian Oil & Gas Index<br />
<strong>FTSE</strong> Asia Pacific ex Japan Index<br />
16.33 15.82 16.11 15.64 23.19 18.33 25.92 40.26 21.62<br />
Top 5 Constituents by Index Weighting Vendor Codes<br />
Rank Constituent Name Country ICB Subsector Wgt in Index (%)<br />
<strong>FTSE</strong> ASOG<br />
1 CNOOC (Red Chip) China Exploration & Production 15.17<br />
Bloomberg FASOG<br />
2 Petrochina (H) China Integrated Oil & Gas 13.02<br />
Reuters <br />
3 Reliance Industries India Exploration & Production<br />
11.88<br />
4 China Petroleum & Chemical (H) China Integrated Oil & Gas<br />
7.38<br />
5 Keppel Corp Singapore Oil Equipment & Services<br />
5.86<br />
5 Year Historical Country Weightings Breakdown Country Weightings Breakdown % - <strong>September</strong> 2012<br />
100%<br />
80%<br />
60%<br />
40%<br />
20%<br />
0%<br />
30 6.21 9.46 -1.58 12.55 -19.63 25.57 54.69 -56.28<br />
● China<br />
● Hong Kong, SAR<br />
● India<br />
● Indonesia<br />
● Malaysia<br />
● Philippines<br />
● Singapore<br />
● South Korea<br />
● Taiwan<br />
● Thailand<br />
5 Year Historical ICB Subsector Weightings Breakdown ICB Subsector Weightings Breakdown % - <strong>September</strong> 2012<br />
100%<br />
80%<br />
60%<br />
40%<br />
20%<br />
0%<br />
● Alternative Fuels<br />
● Exploration<br />
& Production<br />
● Integrated Oil<br />
& Gas<br />
● Oil Equipment<br />
& Services<br />
● Pipelines<br />
● Renewable Energy<br />
Equipment<br />
Source: <strong>FTSE</strong> Group 12 of 20<br />
2007<br />
20.69 18.42 18.57 18.95 26.32 20.07 31.42 51.05 29.10<br />
67.73 2.84<br />
- 5.60 8.58 0.48 12.48 -17.96 16.78 69.64 -53.24 35.85 3.05<br />
13.37<br />
9.39<br />
27.12<br />
3.35<br />
2.69<br />
10.71<br />
9.99<br />
20.65<br />
2.02<br />
0.56<br />
39.99<br />
60.15
<strong>FTSE</strong> Asian Personal & Household Goods Index<br />
Index Overview<br />
<strong>FTSE</strong> Asian Personal & Household Goods Index consists of manufacturers and distributors of durable and nondurable household products, furniture, consumer electronics,<br />
recreational products, toys, clothing & accessories, footwear, personal products and tobacco.<br />
Historical Performance (%)<br />
Index Name Number of Cons. 1M 3M 6M YTD 2011 2010 2009 2008 2007 12M Div Yld<br />
<strong>FTSE</strong> Asian Personal & Household Goods Index<br />
<strong>FTSE</strong> Asia Pacific ex Japan Index<br />
Historical Volatility (%)<br />
Index Name 1M 3M 6M YTD 2011 2010 2009 2008<br />
<strong>FTSE</strong> Asian Personal & Household Goods Index<br />
<strong>FTSE</strong> Asia Pacific ex Japan Index<br />
16.33 15.82 16.11 15.64 23.19 18.33 25.92 40.26 21.62<br />
Top 5 Constituents by Index Weighting Vendor Codes<br />
Rank Constituent Name Country ICB Subsector Wgt in Index (%)<br />
<strong>FTSE</strong> ASPH<br />
1 ITC India Tobacco 15.98<br />
Bloomberg FASPH<br />
2 Belle International Hong Kong, SAR Footwear 8.63<br />
Reuters <br />
3 Li & Fung Hong Kong, SAR Clothing & Accessories<br />
7.31<br />
4 Hindustan Unilever India Personal Products<br />
6.75<br />
5 Hengan Intl Group Hong Kong, SAR Personal Products<br />
6.51<br />
5 Year Historical Country Weightings Breakdown Country Weightings Breakdown % - <strong>September</strong> 2012<br />
100%<br />
80%<br />
60%<br />
40%<br />
20%<br />
0%<br />
30 2.67 7.07 1.43 13.13 -8.49 27.51 72.31 -39.36<br />
● China<br />
● Hong Kong, SAR<br />
● India<br />
● Indonesia<br />
● Malaysia<br />
● Philippines<br />
● Singapore<br />
● South Korea<br />
● Taiwan<br />
● Thailand<br />
5 Year Historical ICB Subsector Weightings Breakdown ICB Subsector Weightings Breakdown % - <strong>September</strong> 2012<br />
100%<br />
80%<br />
60%<br />
40%<br />
20%<br />
0%<br />
● Clothing & Access.<br />
● Consumer Electron.<br />
● Durable House. Pdt<br />
● Footwear<br />
● Furnishings<br />
● Nondurable Hse Pdt<br />
● Personal Products<br />
● Recreational Pdt<br />
● Tobacco<br />
● Toys<br />
Source: <strong>FTSE</strong> Group 13 of 20<br />
2007<br />
16.62 16.27 15.30 14.95 20.03 16.70 22.38 34.46 19.07<br />
Data as at: 28 <strong>September</strong> 2012<br />
27.31 2.07<br />
- 5.60 8.58 0.48 12.48 -17.96 16.78 69.64 -53.24 35.85 3.05<br />
25.10<br />
2.13<br />
5.24<br />
24.15<br />
2.70<br />
29.72<br />
9.10<br />
2.62<br />
27.69<br />
18.00<br />
30.74<br />
5.74<br />
3.48<br />
13.59
<strong>FTSE</strong> Asian Property Index Data as at: 28 <strong>September</strong> 2012<br />
Index Overview<br />
<strong>FTSE</strong> Asian Property Index consists of companies that invest directly or indirectly in real estate, real estate investment trusts (REITs) and listed property trust (LPTs). It also<br />
includes companies in the mortgage finance sectors and home construction sectors.<br />
Historical Performance (%)<br />
Index Name Number of Cons. 1M 3M 6M YTD 2011 2010 2009 2008 2007 12M Div Yld<br />
<strong>FTSE</strong> Asian Property Index<br />
<strong>FTSE</strong> Asia Pacific ex Japan Index<br />
Historical Volatility (%)<br />
Index Name 1M 3M 6M YTD 2011 2010 2009 2008<br />
<strong>FTSE</strong> Asian Property Index<br />
<strong>FTSE</strong> Asia Pacific ex Japan Index<br />
16.33 15.82 16.11 15.64 23.19 18.33 25.92 40.26 21.62<br />
Top 5 Constituents by Index Weighting Vendor Codes<br />
Rank Constituent Name Country ICB Subsector Wgt in Index (%)<br />
<strong>FTSE</strong> ASPR<br />
1 Sun Hung Kai Props Hong Kong, SAR Real Estate Holding & Development 13.71<br />
Bloomberg FASPR<br />
2 Cheung Kong (Hldgs) Hong Kong, SAR Real Estate Holding & Development 12.16<br />
Reuters <br />
3 Housing Development Finance India Mortgage Finance<br />
7.88<br />
4 Link Real Estate Investment Trust Hong Kong, SAR Retail REITs<br />
5.17<br />
5 Wharf Holdings Hong Kong, SAR Real Estate Holding & Development<br />
5.02<br />
5 Year Historical Country Weightings Breakdown Country Weightings Breakdown % - <strong>September</strong> 2012<br />
100%<br />
80%<br />
60%<br />
40%<br />
20%<br />
0%<br />
30 8.93 16.37 14.37 32.46 -27.72 9.85 68.07 -58.06<br />
● China<br />
● Hong Kong, SAR<br />
● India<br />
● Indonesia<br />
● Malaysia<br />
● Philippines<br />
● Singapore<br />
● South Korea<br />
● Taiwan<br />
● Thailand<br />
5 Year Historical ICB Subsector Weightings Breakdown ICB Subsector Weightings Breakdown % - <strong>September</strong> 2012<br />
100%<br />
80%<br />
60%<br />
40%<br />
20%<br />
0%<br />
● Diversified REITs<br />
● Home Construction<br />
● Hotel &<br />
Lodging REITs<br />
● Industrial &<br />
Office REITs<br />
● Mortgage Finance<br />
● Mortgate REITs<br />
● Real Estate<br />
Holding & Dev<br />
● Real Estate Services<br />
● Residential REITs<br />
● Retail REITs<br />
● Specialty REITs<br />
Source: <strong>FTSE</strong> Group 14 of 20<br />
2007<br />
16.80 16.53 17.39 18.53 25.88 18.52 33.71 46.57 27.62<br />
57.96 2.31<br />
- 5.60 8.58 0.48 12.48 -17.96 16.78 69.64 -53.24 35.85 3.05<br />
8.96<br />
2.63<br />
12.26<br />
7.13<br />
84.99<br />
7.40<br />
7.88<br />
68.74
<strong>FTSE</strong> Asian Retail Index Data as at: 28 <strong>September</strong> 2012<br />
Index Overview<br />
<strong>FTSE</strong> Asian Retail Index consists of drug retailers, food retailers & wholesalers, apparel retailers, broadline retailers and home improvement retailers. It also includes specialized<br />
consumer services providers such as day-care centres, hair salons etc. and specialty retailers which concentrate on a single class of goods such as electronics and books.<br />
Historical Performance (%)<br />
Index Name Number of Cons. 1M 3M 6M YTD 2011 2010 2009 2008 2007 12M Div Yld<br />
<strong>FTSE</strong> Asian Retail Index<br />
<strong>FTSE</strong> Asia Pacific ex Japan Index<br />
Historical Volatility (%)<br />
Index Name 1M 3M 6M YTD 2011 2010 2009 2008<br />
<strong>FTSE</strong> Asian Retail Index<br />
<strong>FTSE</strong> Asia Pacific ex Japan Index<br />
16.33 15.82 16.11 15.64 23.19 18.33 25.92 40.26 21.62<br />
Top 5 Constituents by Index Weighting Vendor Codes<br />
Rank Constituent Name Country ICB Subsector Wgt in Index (%)<br />
<strong>FTSE</strong> ASRE<br />
1 Jardine Cycle & Carriage Singapore Specialty Retailers 11.14<br />
Bloomberg FASRE<br />
2 CP ALL Thailand Food Retailers & Wholesalers 10.13<br />
Reuters <br />
3 E-Mart South Korea Broadline Retailers<br />
9.09<br />
4 President Chain Store Taiwan Food Retailers & Wholesalers<br />
8.33<br />
5 Sun Art Retail Group Hong Kong, SAR Broadline Retailers<br />
7.10<br />
5 Year Historical Country Weightings Breakdown Country Weightings Breakdown % - <strong>September</strong> 2012<br />
100%<br />
80%<br />
60%<br />
40%<br />
20%<br />
0%<br />
20 3.32 3.56 -6.00 0.12 -17.94 15.54 55.22 -58.27<br />
● China<br />
● Hong Kong, SAR<br />
● India<br />
● Indonesia<br />
● Malaysia<br />
● Philippines<br />
● Singapore<br />
● South Korea<br />
● Taiwan<br />
● Thailand<br />
5 Year Historical ICB Subsector Weightings Breakdown ICB Subsector Weightings Breakdown % - <strong>September</strong> 2012<br />
100%<br />
80%<br />
60%<br />
40%<br />
20%<br />
0%<br />
● Apparel Retailers<br />
● Broadline Retailers<br />
● Drug Retailers<br />
● Food Retailers<br />
& Wholesalers<br />
● Home Improvement<br />
Retailers<br />
● Specialized<br />
Consumer Services<br />
● Specialty Retailers<br />
Source: <strong>FTSE</strong> Group 15 of 20<br />
2007<br />
15.38 16.57 16.89 17.34 25.62 20.73 31.04 42.71 22.69<br />
29.20 1.73<br />
- 5.60 8.58 0.48 12.48 -17.96 16.78 69.64 -53.24 35.85 3.05<br />
14.17<br />
24.37<br />
16.60<br />
23.28<br />
21.98<br />
1.91<br />
7.04<br />
11.14<br />
26.51<br />
6.39<br />
46.61
<strong>FTSE</strong> Asian Technology Index Data as at: 28 <strong>September</strong> 2012<br />
Index Overview<br />
<strong>FTSE</strong> Asian Technology Index consists of companies providing consultation services to other business relating to information technology, internet-related services and distributors of<br />
computer software for home or corporate use. The index also includes manufacturers and distributors of computer hardware and electronic products, electronic office equipments,<br />
semiconductors and telecommunications equipments.<br />
Historical Performance (%)<br />
Index Name Number of Cons. 1M 3M 6M YTD 2011 2010 2009 2008 2007 12M Div Yld<br />
<strong>FTSE</strong> Asian Technology Index<br />
<strong>FTSE</strong> Asia Pacific ex Japan Index<br />
Historical Volatility (%)<br />
Index Name 1M 3M 6M YTD 2011 2010 2009 2008<br />
<strong>FTSE</strong> Asian Technology Index<br />
<strong>FTSE</strong> Asia Pacific ex Japan Index<br />
16.33 15.82 16.11 15.64 23.19 18.33 25.92 40.26 21.62<br />
Top 5 Constituents by Index Weighting Vendor Codes<br />
Rank Constituent Name Country ICB Subsector Wgt in Index (%)<br />
<strong>FTSE</strong> ASTE<br />
1 Taiwan Semiconductor Manufacturing Taiwan Semiconductors 15.57<br />
Bloomberg FASTE<br />
2 Samsung Electronics South Korea Semiconductors 15.13<br />
Reuters <br />
3 Tencent Holdings Hong Kong, SAR Internet<br />
10.76<br />
4 Infosys India Computer Services<br />
9.46<br />
5 MediaTek Taiwan Semiconductors<br />
4.91<br />
5 Year Historical Country Weightings Breakdown Country Weightings Breakdown % - <strong>September</strong> 2012<br />
100%<br />
80%<br />
60%<br />
40%<br />
20%<br />
0%<br />
30 9.20 9.18 -1.59 17.32 -20.84 20.25 100.35 -51.17<br />
● China<br />
● Hong Kong, SAR<br />
● India<br />
● Indonesia<br />
● Malaysia<br />
● Philippines<br />
● Singapore<br />
● South Korea<br />
● Taiwan<br />
● Thailand<br />
5 Year Historical ICB Subsector Weightings Breakdown ICB Subsector Weightings Breakdown % - <strong>September</strong> 2012<br />
● Computer Hardware<br />
● Computer Services<br />
● Electronic<br />
Equipment<br />
● Electronic Office<br />
Equipment<br />
● Internet<br />
● Semiconductors<br />
● Software<br />
● Telecoms Equipment<br />
Source: <strong>FTSE</strong> Group 16 of 20<br />
2007<br />
19.02 20.74 21.32 19.84 25.80 20.04 26.89 40.22 22.13<br />
2.38 2.25<br />
- 5.60 8.58 0.48 12.48 -17.96 16.78 69.64 -53.24 35.85 3.05<br />
100% 0.33 3.26<br />
12.59<br />
80%<br />
60%<br />
40%<br />
20%<br />
0%<br />
43.42<br />
46.27<br />
2.62<br />
11.56<br />
27.74<br />
15.06<br />
14.66<br />
14.57<br />
7.92
<strong>FTSE</strong> Asian Telecommunications Index Data as at: 28 <strong>September</strong> 2012<br />
Index Overview<br />
<strong>FTSE</strong> Asian Telecommunications Index consists of providers of fixed-line telephone services, including regional and long-distance and providers of mobile telephone services,<br />
including cellular, satellite and paging services.<br />
Historical Performance (%)<br />
Index Name Number of Cons. 1M 3M 6M YTD 2011 2010 2009 2008 2007 12M Div Yld<br />
<strong>FTSE</strong> Asian Telecommunications Index<br />
<strong>FTSE</strong> Asia Pacific ex Japan Index<br />
Historical Volatility (%)<br />
Index Name 1M 3M 6M YTD 2011 2010 2009 2008<br />
<strong>FTSE</strong> Asian Telecommunications Index<br />
<strong>FTSE</strong> Asia Pacific ex Japan Index<br />
16.33 15.82 16.11 15.64 23.19 18.33 25.92 40.26 21.62<br />
Top 5 Constituents by Index Weighting Vendor Codes<br />
Rank Constituent Name Country ICB Subsector Wgt in Index (%)<br />
<strong>FTSE</strong> ASTC<br />
1 China Mobile (Red Chip) China Mobile Telecommunications 15.47<br />
Bloomberg FASTEL<br />
2 Singapore Telecom Singapore Mobile Telecommunications 12.69<br />
Reuters <br />
3 Axiata Group Bhd Malaysia Mobile Telecommunications<br />
8.23<br />
4 Chunghwa Telecom Taiwan Fixed Line Telecommunications<br />
7.44<br />
5 China Unicom HK Ltd (Red Chip) China Mobile Telecommunications<br />
7.12<br />
5 Year Historical Country Weightings Breakdown Country Weightings Breakdown % - <strong>September</strong> 2012<br />
100%<br />
80%<br />
60%<br />
40%<br />
20%<br />
0%<br />
20 3.84 11.91 7.87 11.42 4.98 13.63 8.79 -41.65<br />
● China<br />
● Hong Kong, SAR<br />
● India<br />
● Indonesia<br />
● Malaysia<br />
● Philippines<br />
● Singapore<br />
● South Korea<br />
● Taiwan<br />
● Thailand<br />
5 Year Historical ICB Subsector Weightings Breakdown ICB Subsector Weightings Breakdown % - <strong>September</strong> 2012<br />
100%<br />
80%<br />
60%<br />
40%<br />
20%<br />
0%<br />
● Fixed Line<br />
Telecommunications<br />
● Mobile<br />
Telecommunications<br />
Source: <strong>FTSE</strong> Group 17 of 20<br />
2007<br />
13.07 12.89 12.57 12.34 14.66 13.31 21.22 33.15 21.51<br />
40.91 3.86<br />
- 5.60 8.58 0.48 12.48 -17.96 16.78 69.64 -53.24 35.85 3.05<br />
5.68<br />
13.60<br />
13.96<br />
1.75<br />
76.97<br />
6.35<br />
18.83<br />
28.30<br />
6.08<br />
23.03<br />
5.45
<strong>FTSE</strong> Asian Travel, Leisure & Media Index<br />
Index Overview<br />
<strong>FTSE</strong> Asian Travel, Leisure & Media Index consists operators and broadcasters of radio, television, music and filmed entertainment, media agencies and publishers. It<br />
also includes companies engaging in the airlines, gambling and casino facilities, hotel, recreational services, restaurants & bars and providers of travel and tourism<br />
related services.<br />
Historical Performance (%)<br />
Index Name Number of Cons. 1M 3M 6M YTD 2011 2010 2009 2008 2007 12M Div Yld<br />
<strong>FTSE</strong> Asian Travel, Leisure & Media Index<br />
<strong>FTSE</strong> Asia Pacific ex Japan Index<br />
Historical Volatility (%)<br />
Index Name 1M 3M 6M YTD 2011 2010 2009 2008<br />
<strong>FTSE</strong> Asian Travel, Leisure & Media Index<br />
<strong>FTSE</strong> Asia Pacific ex Japan Index<br />
16.33 15.82 16.11 15.64 23.19 18.33 25.92 40.26 21.62<br />
Top 5 Constituents by Index Weighting Vendor Codes<br />
Rank Constituent Name Country ICB Subsector Wgt in Index (%)<br />
<strong>FTSE</strong> ASTL<br />
1 Sands China Hong Kong, SAR Gambling 9.86<br />
Bloomberg FASTL<br />
2 Genting Malaysia Hotels 8.64<br />
Reuters <br />
3 Genting Singapore Singapore Recreational Services<br />
7.44<br />
4 MTR Corp Hong Kong, SAR Travel & Tourism<br />
7.20<br />
5 Singapore Press Holdings Singapore Publishing<br />
5.79<br />
5 Year Historical Country Weightings Breakdown Country Weightings Breakdown % - <strong>September</strong> 2012<br />
100%<br />
80%<br />
60%<br />
40%<br />
20%<br />
0%<br />
30 5.78 8.98 -2.17 11.33 -16.07 40.61 52.42 -50.44<br />
● China<br />
● Hong Kong, SAR<br />
● India<br />
● Indonesia<br />
● Malaysia<br />
● Philippines<br />
● Singapore<br />
● South Korea<br />
● Taiwan<br />
● Thailand<br />
5 Year Historical ICB Subsector Weightings Breakdown ICB Subsector Weightings Breakdown % - <strong>September</strong> 2012<br />
100%<br />
80%<br />
60%<br />
40%<br />
20%<br />
0%<br />
● Airlines<br />
● Broadcasting &<br />
Entertainment<br />
● Gambling<br />
● Hotels<br />
● Media Agencies<br />
● Publishing<br />
● Recreational Services<br />
● Restaurant & Bars<br />
● Travel & Tourism<br />
Source: <strong>FTSE</strong> Group 18 of 20<br />
2007<br />
15.66 14.28 15.59 15.53 24.68 16.36 22.33 30.81 20.04<br />
Data as at: 28 <strong>September</strong> 2012<br />
26.68 2.33<br />
- 5.60 8.58 0.48 12.48 -17.96 16.78 69.64 -53.24 35.85 3.05<br />
23.26<br />
5.79<br />
2.01<br />
1.10<br />
7.44<br />
1.10<br />
16.72<br />
3.17<br />
2.08<br />
7.64<br />
16.17<br />
11.54<br />
1.57<br />
2.22<br />
16.57<br />
31.29<br />
42.79<br />
7.54
<strong>FTSE</strong> Asian Utilities Index Data as at: 28 <strong>September</strong> 2012<br />
Index Overview<br />
<strong>FTSE</strong> Asian Utilities Index consists of companies generating and distributing electricity, distributors of gas to end users and companies providing water to end users,<br />
including water treatment plants. Utilities companies with significant presence in more than one utility are also included.<br />
Historical Performance (%)<br />
Index Name Number of Cons. 1M 3M 6M YTD 2011 2010 2009 2008 2007 12M Div Yld<br />
<strong>FTSE</strong> Asian Utilities Index<br />
<strong>FTSE</strong> Asia Pacific ex Japan Index<br />
Historical Volatility (%)<br />
Index Name 1M 3M 6M YTD 2011 2010 2009 2008<br />
<strong>FTSE</strong> Asian Utilities Index<br />
<strong>FTSE</strong> Asia Pacific ex Japan Index<br />
16.33 15.82 16.11 15.64 23.19 18.33 25.92 40.26 21.62<br />
Top 5 Constituents by Index Weighting Vendor Codes<br />
Rank Constituent Name Country ICB Subsector Wgt in Index (%)<br />
<strong>FTSE</strong> ASUT<br />
1 Hong Kong & China Gas Hong Kong, SAR Gas Distribution 14.98<br />
Bloomberg FASUT<br />
2 CLP Holdings Hong Kong, SAR Conventional Electricity 14.58<br />
Reuters <br />
3 Power Assets Holdings Hong Kong, SAR Conventional Electricity<br />
13.50<br />
4 Kepco South Korea Conventional Electricity<br />
6.38<br />
5 NTPC India Conventional Electricity<br />
5.23<br />
5 Year Historical Country Weightings Breakdown Country Weightings Breakdown % - <strong>September</strong> 2012<br />
100%<br />
80%<br />
60%<br />
40%<br />
20%<br />
0%<br />
30 6.90 9.61 7.27 15.44 -11.82 7.42 31.23 -36.92<br />
● China<br />
● Hong Kong, SAR<br />
● India<br />
● Indonesia<br />
● Malaysia<br />
● Philippines<br />
● Singapore<br />
● South Korea<br />
● Taiwan<br />
● Thailand<br />
5 Year Historical ICB Subsector Weightings Breakdown ICB Subsector Weightings Breakdown % - <strong>September</strong> 2012<br />
100%<br />
80%<br />
60%<br />
40%<br />
20%<br />
0%<br />
● Alternative<br />
Electricity<br />
● Conventional<br />
Electricity<br />
● Gas Distribution<br />
● Multiutilities<br />
● Water<br />
Source: <strong>FTSE</strong> Group 19 of 20<br />
2007<br />
8.82 9.71 10.19 10.65 14.22 11.79 17.55 33.65 16.55<br />
34.44 2.33<br />
- 5.60 8.58 0.48 12.48 -17.96 16.78 69.64 -53.24 35.85 3.05<br />
8.66<br />
4.15<br />
15.18<br />
25.20<br />
7.86<br />
3.39<br />
4.06<br />
1.82<br />
3.03 7.42<br />
9.53<br />
49.40<br />
60.28
<strong>FTSE</strong> Asian Sectors Index Series Data as at: 28 <strong>September</strong> 2012<br />
©<strong>FTSE</strong> International Limited (“<strong>FTSE</strong>”) 2012. “<strong>FTSE</strong>®” is a trade mark of the London Stock Exchange Group companies and is used by <strong>FTSE</strong> International Limited (“<strong>FTSE</strong>”) under<br />
licence. All information is provided for information purposes only. Every effort is made to ensure that all information given in this publication is accurate, but no responsibility or<br />
liability can be accepted by <strong>FTSE</strong> or its licensors for any errors or for any loss from use of this publication. Neither <strong>FTSE</strong> nor any of its licensors makes any claim, prediction, warranty<br />
or representation whatsoever, expressly or impliedly, either as to the results to be obtained from the use of <strong>FTSE</strong> indices, data or other material herein (“<strong>FTSE</strong> Material”) or the<br />
fitness or suitability of the <strong>FTSE</strong> Material for any particular purpose to which it might be put. No part of this information may be reproduced, stored in a retrieval system or<br />
transmitted in any form or by any means, electronic, mechanical, photocopying, recording or otherwise, without prior written permission of <strong>FTSE</strong>. Distribution of <strong>FTSE</strong> data and the<br />
use of <strong>FTSE</strong> indices to create financial products requires a licence with <strong>FTSE</strong> and/or its licensors.<br />
Industry Classification Benchmark (“ICB”) is a product of <strong>FTSE</strong> International Limited (“<strong>FTSE</strong>”). All intellectual property rights in and to ICB vest in <strong>FTSE</strong> and a licence from <strong>FTSE</strong> is<br />
required for use of ICB. <strong>FTSE</strong> and its licensors do not accept any liability to any person for any loss or damage arising out of any error or omission in ICB.<br />
Data definitions available from www.ftse.com<br />
For further information visit www.ftse.com,<br />
email info@ftse.com or call your local <strong>FTSE</strong><br />
office:<br />
Beijing +86 (10) 8587 7722<br />
Dubai +971 4 319 9901<br />
Hong Kong +852 2164 3333<br />
London +44 (0) 20 7866 1810<br />
Milan +39 02 3604 6953<br />
Mumbai +91 22 6649 4180<br />
New York +1 888 <strong>FTSE</strong> (3873)<br />
Paris +33 (0) 1 53 76 82 89<br />
San Francisco +1 888 747 <strong>FTSE</strong> (3873)<br />
Sydney +61 (2) 9293 2864<br />
Tokyo +81 (3) 3581 2811<br />
Source: <strong>FTSE</strong> Group 20 of 20


