

September - FTSE
September - FTSE
September - FTSE

You also want an ePaper? Increase the reach of your titles
YUMPU automatically turns print PDFs into web optimized ePapers that Google loves.
<strong>FTSE</strong> Asian Construction & Materials Index<br />
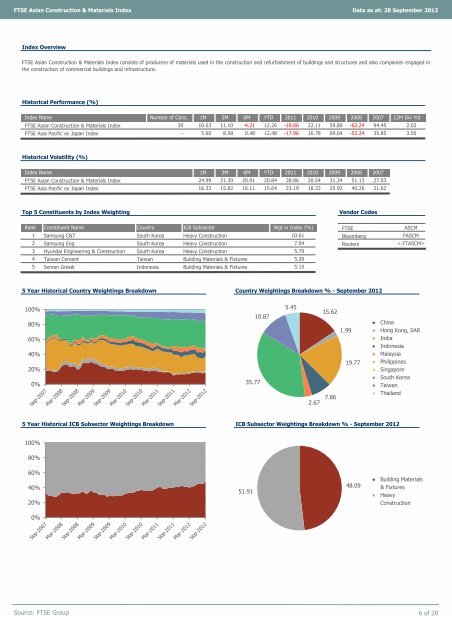
Index Overview<br />
<strong>FTSE</strong> Asian Construction & Materials Index consists of producers of materials used in the construction and refurbishment of buildings and structures and also companies engaged in<br />
the construction of commercial buildings and infrastructure.<br />
Historical Performance (%)<br />
Index Name Number of Cons. 1M 3M 6M YTD 2011 2010 2009 2008 2007 12M Div Yld<br />
<strong>FTSE</strong> Asian Construction & Materials Index<br />
<strong>FTSE</strong> Asia Pacific ex Japan Index<br />
Historical Volatility (%)<br />
Index Name 1M 3M 6M YTD 2011 2010 2009 2008<br />
<strong>FTSE</strong> Asian Construction & Materials Index<br />
<strong>FTSE</strong> Asia Pacific ex Japan Index<br />
16.33 15.82 16.11 15.64 23.19 18.33 25.92 40.26 21.62<br />
Top 5 Constituents by Index Weighting Vendor Codes<br />
Rank Constituent Name Country ICB Subsector Wgt in Index (%)<br />
<strong>FTSE</strong><br />
ASCM<br />
1 Samsung C&T South Korea Heavy Construction 10.61<br />
Bloomberg FASCM<br />
2 Samsung Eng South Korea Heavy Construction 7.94<br />
Reuters <br />
3 Hyundai Engineering & Construction South Korea Heavy Construction<br />
5.79<br />
4 Taiwan Cement Taiwan Building Materials & Fixtures<br />
5.26<br />
5 Semen Gresik Indonesia Building Materials & Fixtures<br />
5.15<br />
5 Year Historical Country Weightings Breakdown Country Weightings Breakdown % - <strong>September</strong> 2012<br />
100%<br />
80%<br />
60%<br />
40%<br />
20%<br />
0%<br />
30 10.63 11.10 -4.21 12.26 -18.86 22.11 59.80 -62.24<br />
● China<br />
● Hong Kong, SAR<br />
● India<br />
● Indonesia<br />
● Malaysia<br />
● Philippines<br />
● Singapore<br />
● South Korea<br />
● Taiwan<br />
● Thailand<br />
5 Year Historical ICB Subsector Weightings Breakdown ICB Subsector Weightings Breakdown % - <strong>September</strong> 2012<br />
100%<br />
80%<br />
60%<br />
40%<br />
20%<br />
0%<br />
● Building Materials<br />
& Fixtures<br />
● Heavy<br />
Construction<br />
Source: <strong>FTSE</strong> Group 6 of 20<br />
2007<br />
24.99 21.30 20.91 20.84 28.86 20.54 31.34 51.13 27.03<br />
Data as at: 28 <strong>September</strong> 2012<br />
94.45 2.02<br />
- 5.60 8.58 0.48 12.48 -17.96 16.78 69.64 -53.24 35.85 3.05<br />
35.77<br />
51.91<br />
10.87<br />
5.45<br />
2.67<br />
15.62<br />
7.86<br />
1.99<br />
19.77<br />
48.09


