

September - FTSE
September - FTSE
September - FTSE

Create successful ePaper yourself
Turn your PDF publications into a flip-book with our unique Google optimized e-Paper software.
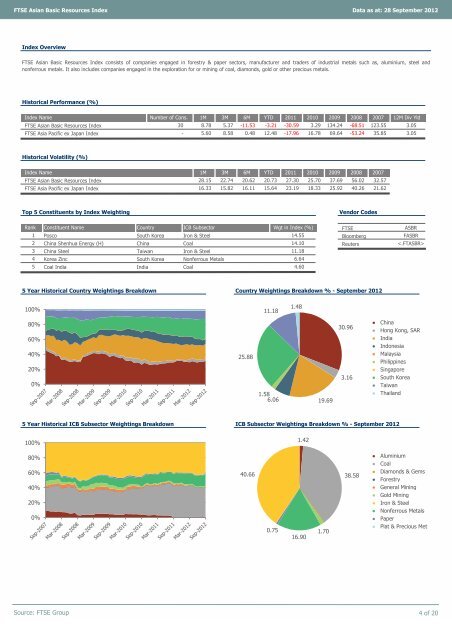
<strong>FTSE</strong> Asian Basic Resources Index Data as at: 28 <strong>September</strong> 2012<br />
Index Overview<br />
<strong>FTSE</strong> Asian Basic Resources Index consists of companies engaged in forestry & paper sectors, manufacturer and traders of industrial metals such as, aluminium, steel and<br />
nonferrous metals. It also includes companies engaged in the exploration for or mining of coal, diamonds, gold or other precious metals.<br />
Historical Performance (%)<br />
Index Name Number of Cons. 1M 3M 6M YTD 2011 2010 2009 2008 2007 12M Div Yld<br />
<strong>FTSE</strong> Asian Basic Resources Index<br />
<strong>FTSE</strong> Asia Pacific ex Japan Index<br />
Historical Volatility (%)<br />
Index Name 1M 3M 6M YTD 2011 2010 2009 2008<br />
<strong>FTSE</strong> Asian Basic Resources Index<br />
<strong>FTSE</strong> Asia Pacific ex Japan Index<br />
16.33 15.82 16.11 15.64 23.19 18.33 25.92 40.26 21.62<br />
Top 5 Constituents by Index Weighting Vendor Codes<br />
Rank Constituent Name Country ICB Subsector Wgt in Index (%)<br />
<strong>FTSE</strong><br />
ASBR<br />
1 Posco South Korea Iron & Steel 14.55<br />
Bloomberg FASBR<br />
2 China Shenhua Energy (H) China Coal 14.10<br />
Reuters <br />
3 China Steel Taiwan Iron & Steel<br />
11.18<br />
4 Korea Zinc South Korea Nonferrous Metals<br />
6.64<br />
5 Coal India India Coal<br />
4.60<br />
5 Year Historical Country Weightings Breakdown Country Weightings Breakdown % - <strong>September</strong> 2012<br />
100%<br />
80%<br />
60%<br />
40%<br />
20%<br />
0%<br />
30 8.78 5.37 -11.53 -3.21 -30.59 3.29 134.24 -68.51<br />
● China<br />
● Hong Kong, SAR<br />
● India<br />
● Indonesia<br />
● Malaysia<br />
● Philippines<br />
● Singapore<br />
● South Korea<br />
● Taiwan<br />
● Thailand<br />
5 Year Historical ICB Subsector Weightings Breakdown ICB Subsector Weightings Breakdown % - <strong>September</strong> 2012<br />
100%<br />
80%<br />
60%<br />
40%<br />
20%<br />
0%<br />
● Aluminium<br />
● Coal<br />
● Diamonds & Gems<br />
● Forestry<br />
● General Mining<br />
● Gold Mining<br />
● Iron & Steel<br />
● Nonferrous Metals<br />
● Paper<br />
● Plat & Precious Met<br />
Source: <strong>FTSE</strong> Group 4 of 20<br />
2007<br />
28.15 22.74 20.62 20.73 27.30 25.70 37.69 56.02 32.57<br />
123.55 3.05<br />
- 5.60 8.58 0.48 12.48 -17.96 16.78 69.64 -53.24 35.85 3.05<br />
25.88<br />
40.66<br />
11.18<br />
1.58<br />
6.06<br />
0.75<br />
1.48<br />
1.42<br />
16.90<br />
19.69<br />
1.70<br />
30.96<br />
3.16<br />
38.58


