

September - FTSE
September - FTSE
September - FTSE

Create successful ePaper yourself
Turn your PDF publications into a flip-book with our unique Google optimized e-Paper software.
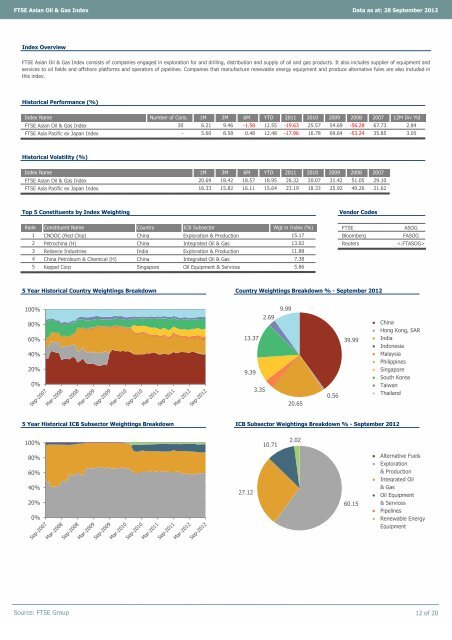
<strong>FTSE</strong> Asian Oil & Gas Index Data as at: 28 <strong>September</strong> 2012<br />
Index Overview<br />
<strong>FTSE</strong> Asian Oil & Gas Index consists of companies engaged in exploration for and drilling, distribution and supply of oil and gas products. It also includes supplier of equipment and<br />
services to oil fields and offshore platforms and operators of pipelines. Companies that manufacture renewable energy equipment and produce alternative fules are also included in<br />
this index.<br />
Historical Performance (%)<br />
Index Name Number of Cons. 1M 3M 6M YTD 2011 2010 2009 2008 2007 12M Div Yld<br />
<strong>FTSE</strong> Asian Oil & Gas Index<br />
<strong>FTSE</strong> Asia Pacific ex Japan Index<br />
Historical Volatility (%)<br />
Index Name 1M 3M 6M YTD 2011 2010 2009 2008<br />
<strong>FTSE</strong> Asian Oil & Gas Index<br />
<strong>FTSE</strong> Asia Pacific ex Japan Index<br />
16.33 15.82 16.11 15.64 23.19 18.33 25.92 40.26 21.62<br />
Top 5 Constituents by Index Weighting Vendor Codes<br />
Rank Constituent Name Country ICB Subsector Wgt in Index (%)<br />
<strong>FTSE</strong> ASOG<br />
1 CNOOC (Red Chip) China Exploration & Production 15.17<br />
Bloomberg FASOG<br />
2 Petrochina (H) China Integrated Oil & Gas 13.02<br />
Reuters <br />
3 Reliance Industries India Exploration & Production<br />
11.88<br />
4 China Petroleum & Chemical (H) China Integrated Oil & Gas<br />
7.38<br />
5 Keppel Corp Singapore Oil Equipment & Services<br />
5.86<br />
5 Year Historical Country Weightings Breakdown Country Weightings Breakdown % - <strong>September</strong> 2012<br />
100%<br />
80%<br />
60%<br />
40%<br />
20%<br />
0%<br />
30 6.21 9.46 -1.58 12.55 -19.63 25.57 54.69 -56.28<br />
● China<br />
● Hong Kong, SAR<br />
● India<br />
● Indonesia<br />
● Malaysia<br />
● Philippines<br />
● Singapore<br />
● South Korea<br />
● Taiwan<br />
● Thailand<br />
5 Year Historical ICB Subsector Weightings Breakdown ICB Subsector Weightings Breakdown % - <strong>September</strong> 2012<br />
100%<br />
80%<br />
60%<br />
40%<br />
20%<br />
0%<br />
● Alternative Fuels<br />
● Exploration<br />
& Production<br />
● Integrated Oil<br />
& Gas<br />
● Oil Equipment<br />
& Services<br />
● Pipelines<br />
● Renewable Energy<br />
Equipment<br />
Source: <strong>FTSE</strong> Group 12 of 20<br />
2007<br />
20.69 18.42 18.57 18.95 26.32 20.07 31.42 51.05 29.10<br />
67.73 2.84<br />
- 5.60 8.58 0.48 12.48 -17.96 16.78 69.64 -53.24 35.85 3.05<br />
13.37<br />
9.39<br />
27.12<br />
3.35<br />
2.69<br />
10.71<br />
9.99<br />
20.65<br />
2.02<br />
0.56<br />
39.99<br />
60.15


