

September - FTSE
September - FTSE
September - FTSE

Create successful ePaper yourself
Turn your PDF publications into a flip-book with our unique Google optimized e-Paper software.
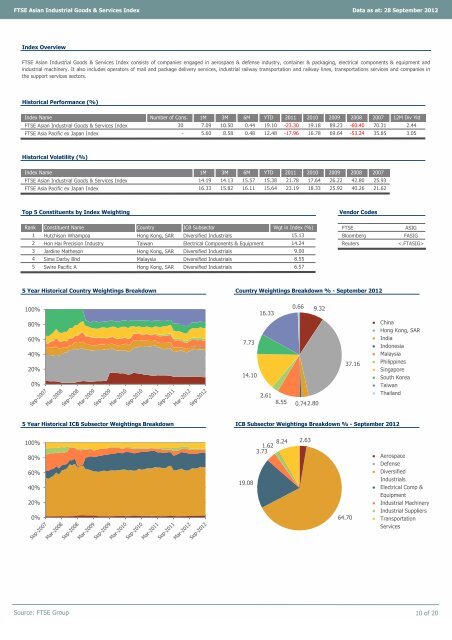
<strong>FTSE</strong> Asian Industrial Goods & Services Index<br />
Index Overview<br />
<strong>FTSE</strong> Asian Industrial Goods & Services Index consists of companies engaged in aerospace & defense industry, container & packaging, electrical components & equipment and<br />
industrial machinery. It also includes operators of mail and package delivery services, industrial railway transportation and railway lines, transportations services and companies in<br />
the support services sectors.<br />
Historical Performance (%)<br />
Index Name Number of Cons. 1M 3M 6M YTD 2011 2010 2009 2008 2007 12M Div Yld<br />
<strong>FTSE</strong> Asian Industrial Goods & Services Index<br />
<strong>FTSE</strong> Asia Pacific ex Japan Index<br />
Historical Volatility (%)<br />
Index Name 1M 3M 6M YTD 2011 2010 2009 2008<br />
<strong>FTSE</strong> Asian Industrial Goods & Services Index<br />
<strong>FTSE</strong> Asia Pacific ex Japan Index<br />
16.33 15.82 16.11 15.64 23.19 18.33 25.92 40.26 21.62<br />
Top 5 Constituents by Index Weighting Vendor Codes<br />
Rank Constituent Name Country ICB Subsector Wgt in Index (%)<br />
<strong>FTSE</strong> ASIG<br />
1 Hutchison Whampoa Hong Kong, SAR Diversified Industrials 15.13<br />
Bloomberg FASIG<br />
2 Hon Hai Precision Industry Taiwan Electrical Components & Equipment 14.24<br />
Reuters <br />
3 Jardine Matheson Hong Kong, SAR Diversified Industrials<br />
9.00<br />
4 Sime Darby Bhd Malaysia Diversified Industrials<br />
8.55<br />
5 Swire Pacific A Hong Kong, SAR Diversified Industrials<br />
6.57<br />
5 Year Historical Country Weightings Breakdown Country Weightings Breakdown % - <strong>September</strong> 2012<br />
100%<br />
80%<br />
60%<br />
40%<br />
20%<br />
0%<br />
30 7.09 10.50 0.44 19.10 -23.30 19.18 89.23 -60.40<br />
● China<br />
● Hong Kong, SAR<br />
● India<br />
● Indonesia<br />
● Malaysia<br />
● Philippines<br />
● Singapore<br />
● South Korea<br />
● Taiwan<br />
● Thailand<br />
5 Year Historical ICB Subsector Weightings Breakdown ICB Subsector Weightings Breakdown % - <strong>September</strong> 2012<br />
100%<br />
80%<br />
60%<br />
40%<br />
20%<br />
0%<br />
● Aerospace<br />
● Defense<br />
● Diversified<br />
Industrials<br />
● Electrical Comp &<br />
Equipment<br />
● Industrial Machinery<br />
● Industrial Suppliers<br />
● Transportation<br />
Services<br />
Source: <strong>FTSE</strong> Group 10 of 20<br />
2007<br />
14.19 14.13 15.57 15.38 21.78 17.64 26.22 42.80 25.93<br />
Data as at: 28 <strong>September</strong> 2012<br />
70.31 2.44<br />
- 5.60 8.58 0.48 12.48 -17.96 16.78 69.64 -53.24 35.85 3.05<br />
7.73<br />
14.10<br />
19.08<br />
16.33<br />
2.61<br />
8.55<br />
1.62<br />
3.73<br />
8.24<br />
0.66<br />
2.80<br />
0.74<br />
2.63<br />
9.32<br />
64.70<br />
37.16


