

September - FTSE
September - FTSE
September - FTSE

You also want an ePaper? Increase the reach of your titles
YUMPU automatically turns print PDFs into web optimized ePapers that Google loves.
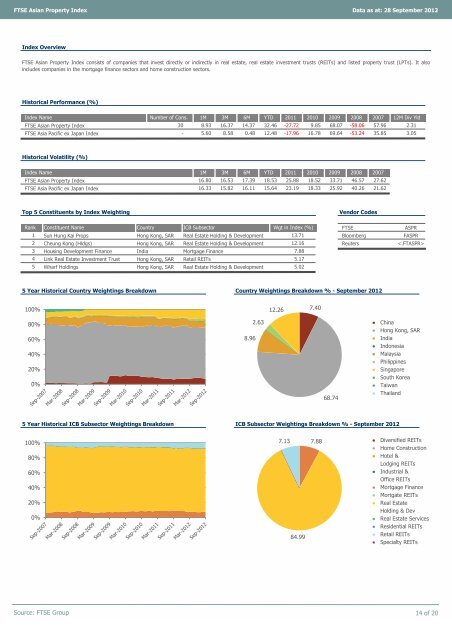
<strong>FTSE</strong> Asian Property Index Data as at: 28 <strong>September</strong> 2012<br />
Index Overview<br />
<strong>FTSE</strong> Asian Property Index consists of companies that invest directly or indirectly in real estate, real estate investment trusts (REITs) and listed property trust (LPTs). It also<br />
includes companies in the mortgage finance sectors and home construction sectors.<br />
Historical Performance (%)<br />
Index Name Number of Cons. 1M 3M 6M YTD 2011 2010 2009 2008 2007 12M Div Yld<br />
<strong>FTSE</strong> Asian Property Index<br />
<strong>FTSE</strong> Asia Pacific ex Japan Index<br />
Historical Volatility (%)<br />
Index Name 1M 3M 6M YTD 2011 2010 2009 2008<br />
<strong>FTSE</strong> Asian Property Index<br />
<strong>FTSE</strong> Asia Pacific ex Japan Index<br />
16.33 15.82 16.11 15.64 23.19 18.33 25.92 40.26 21.62<br />
Top 5 Constituents by Index Weighting Vendor Codes<br />
Rank Constituent Name Country ICB Subsector Wgt in Index (%)<br />
<strong>FTSE</strong> ASPR<br />
1 Sun Hung Kai Props Hong Kong, SAR Real Estate Holding & Development 13.71<br />
Bloomberg FASPR<br />
2 Cheung Kong (Hldgs) Hong Kong, SAR Real Estate Holding & Development 12.16<br />
Reuters <br />
3 Housing Development Finance India Mortgage Finance<br />
7.88<br />
4 Link Real Estate Investment Trust Hong Kong, SAR Retail REITs<br />
5.17<br />
5 Wharf Holdings Hong Kong, SAR Real Estate Holding & Development<br />
5.02<br />
5 Year Historical Country Weightings Breakdown Country Weightings Breakdown % - <strong>September</strong> 2012<br />
100%<br />
80%<br />
60%<br />
40%<br />
20%<br />
0%<br />
30 8.93 16.37 14.37 32.46 -27.72 9.85 68.07 -58.06<br />
● China<br />
● Hong Kong, SAR<br />
● India<br />
● Indonesia<br />
● Malaysia<br />
● Philippines<br />
● Singapore<br />
● South Korea<br />
● Taiwan<br />
● Thailand<br />
5 Year Historical ICB Subsector Weightings Breakdown ICB Subsector Weightings Breakdown % - <strong>September</strong> 2012<br />
100%<br />
80%<br />
60%<br />
40%<br />
20%<br />
0%<br />
● Diversified REITs<br />
● Home Construction<br />
● Hotel &<br />
Lodging REITs<br />
● Industrial &<br />
Office REITs<br />
● Mortgage Finance<br />
● Mortgate REITs<br />
● Real Estate<br />
Holding & Dev<br />
● Real Estate Services<br />
● Residential REITs<br />
● Retail REITs<br />
● Specialty REITs<br />
Source: <strong>FTSE</strong> Group 14 of 20<br />
2007<br />
16.80 16.53 17.39 18.53 25.88 18.52 33.71 46.57 27.62<br />
57.96 2.31<br />
- 5.60 8.58 0.48 12.48 -17.96 16.78 69.64 -53.24 35.85 3.05<br />
8.96<br />
2.63<br />
12.26<br />
7.13<br />
84.99<br />
7.40<br />
7.88<br />
68.74


