ftse/xinhua china a50 index
ftse/xinhua china a50 index
ftse/xinhua china a50 index
Create successful ePaper yourself
Turn your PDF publications into a flip-book with our unique Google optimized e-Paper software.
FACTSHEET<br />
FTSE/XINHUA CHINA A50 INDEX<br />
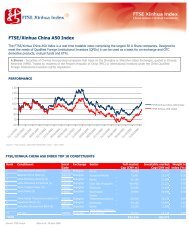
The FTSE/Xinhua China A50 Index is a real-time tradable <strong>index</strong> comprising the largest 50 ‘A’ Share<br />
companies. Designed to meet the needs of Qualified Foreign Institutional Investors (QFIIs) it can be used<br />
as a basis for on-exchange and OTC derivative products, mutual funds and ETFs.<br />
‘A’ Shares – Securities of companies incorporated in Mainland China, that trade on the<br />
Shanghai or Shenzhen stock exchanges, quoted in Chinese Yuan (CNY). These shares are traded<br />
by Chinese or international investors (under the China Qualified Foreign Institutional Investors<br />
– QFII regulations).<br />
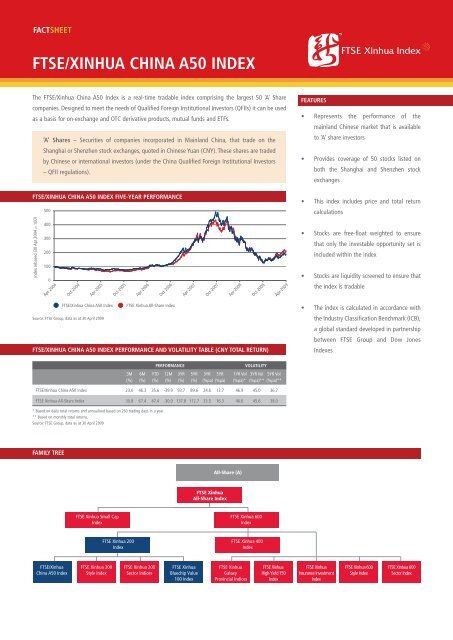
FTSE/XINHUA CHINA A50 INDEX FIVE-YEAR PERFORMANCE<br />
Index rebased (30 Apr 2004 = 100)<br />
500<br />
400<br />
300<br />
200<br />
100<br />
0<br />
Apr-2004<br />
Source: FTSE Group, data as at 30 April 2009<br />
FTSE/XINHUA CHINA A50 INDEX PERFORMANCE AND VOLATILITY TABLE (CNY TOTAL RETURN)<br />
PERFORMANCE VOLATILITY<br />
3M 6M YTD 12M 3YR 5YR 3YR 5YR 1YR Vol 3YR Vol 5YR Vol<br />
(%) (%) (%) (%) (%) (%) (%pa) (%pa) (%pa)* (%pa)** (%pa)**<br />
FTSE/Xinhua China A50 Index 23.0 46.3 35.6 -39.9 93.7 89.6 24.6 13.7 46.9 45.0 36.7<br />
FTSE Xinhua All-Share Index 30.8 67.4 47.4 -30.0 137.8 112.7 33.5 16.3 46.6 45.6 38.0<br />
* Based on daily total returns and annualised based on 260 trading days in a year.<br />
** Based on monthly total returns.<br />
Source: FTSE Group, data as at 30 April 2009<br />
FAMILY TREE<br />
FTSE/Xinhua<br />
China A50 Index<br />
Oct-2004<br />
Apr-2005<br />
Apr-2006<br />
Oct-2006<br />
FTSE/Xinhua China A50 Index FTSE Xinhua All-Share Index<br />
FTSE Xinhua Small Cap<br />
Index<br />
FTSE Xinhua 200<br />
Style Index<br />
Oct-2005<br />
FTSE Xinhua 200<br />
Index<br />
FTSE Xinhua 200<br />
Sector Indices<br />
Apr-2007<br />
FTSE Xinhua<br />
Bluechip Value<br />
100 Index<br />
Oct-2007<br />
Apr-2008<br />
All-Share (A)<br />
FTSE Xinhua<br />
All-Share Index<br />
Oct-2008<br />
FTSE Xinhua 600<br />
Index<br />
FTSE Xinhua 400<br />
Index<br />
FTSE Xinhua<br />
Galaxy<br />
Provincial Indices<br />
Apr-2009<br />
FTSE Xinhua<br />
High Yield 150<br />
Index<br />
FEATURES<br />
• Represents the performance of the<br />
mainland Chinese market that is available<br />
to ‘A’ share investors<br />
• Provides coverage of 50 stocks listed on<br />
both the Shanghai and Shenzhen stock<br />
exchanges<br />
• This <strong>index</strong> includes price and total return<br />
calculations<br />
• Stocks are free-float weighted to ensure<br />
that only the investable opportunity set is<br />
included within the <strong>index</strong><br />
• Stocks are liquidity screened to ensure that<br />
the <strong>index</strong> is tradable<br />
• The <strong>index</strong> is calculated in accordance with<br />
the Industry Classification Benchmark (ICB),<br />
a global standard developed in partnership<br />
between FTSE Group and Dow Jones<br />
Indexes<br />
FTSE Xinhua<br />
Insurance Investment<br />
Index<br />
FTSE Xinhua 600<br />
Style Index<br />
FTSE Xinhua 600<br />
Sector Index
FTSE/XINHUA CHINA A50 INDEX TOP 10 CONSTITUENTS<br />
Rank Constituent Country ICB Supersector Net Mkt Cap Index Weight<br />
(CNYm) (%)<br />
1 Ping An of China (A) China Insurance 190,020 8.69<br />
2 China Merchants Bank (A) China Banks 139,972 6.40<br />
3 Bank of Communications (A) China Banks 131,854 6.03<br />
4 Industrial Bank (A) China Banks 121,450 5.56<br />
5 Citic Securities (A) China Financial Services 120,592 5.52<br />
6 China Vanke (A) China Financial Services 82,089 3.76<br />
7 China Minsheng Banking (A) China Banks 78,915 3.61<br />
8 China Yangtze Power (A) China Utilities 68,944 3.15<br />
9 Shanghai Pudong Development Bank (A) China Banks 65,587 3.00<br />
10 Industrial and Commercial Bank of China (A) China Banks 61,586 2.82<br />
Total 1,061,007 48.54<br />
Source: FTSE Group, data as at 30 April 2009<br />
FTSE/XINHUA CHINA A50 INDEX ICB SUPERSECTOR BREAKDOWN<br />
ICB Supersector No. of Constituents Net Mkt Cap (CNYm) Index Weight (%)<br />
Banks 12 761,447 34.83<br />
Financial Services 4 286,253 13.09<br />
Insurance 3 246,969 11.30<br />
Basic Resources 9 217,566 9.95<br />
Industrial Goods & Services 6 135,843 6.21<br />
Utilities 3 120,279 5.50<br />
Oil & Gas 3 96,889 4.43<br />
Construction & Materials 3 82,217 3.76<br />
Food & Beverage 2 64,393 2.95<br />
Telecommunications 1 57,231 2.62<br />
Retail 1 50,204 2.30<br />
Technology 1 32,118 1.47<br />
Automobiles & Parts 1 24,095 1.10<br />
Travel & Leisure 1 10,482 0.48<br />
Total 50 2,185,987 100.00<br />
Source: FTSE Group, data as at 30 April 2009<br />
FTSE/XINHUA CHINA A50 INDEX PORTFOLIO CHARACTERISTICS<br />
FTSE Xinhua China A50 Index FTSE Xinhua All-Share Index<br />
Number of Constituents 50 976<br />
Net Market Cap (CNYm)<br />
Constituent Sizes (Net Market Cap CNYm)<br />
2,185,987 5,686,185<br />
Average 43,720 5,826<br />
Largest 190,020 190,020<br />
Smallest 5,468 312<br />
Median 31,784 2,575<br />
Weight of Largest Constituent (%) 8.69 3.34<br />
Top 10 Holdings (% Index Market Cap) 48.54 18.66<br />
Source: FTSE Group, data as at 30 April 2009<br />
FOR FURTHER INFORMATION VISIT WWW.FTSE.COM, EMAIL INFO@FTSE.COM OR CALL YOUR LOCAL FTSE OFFICE:<br />
LONDON +44 (0) 20 7866 1810 BOSTON +1 888 747 FTSE (3873) FRANKFURT +49 (0) 69 156 85 144 HONG KONG +852 2230 5800<br />
BEIJING + 86 10 5864 5277 MADRID +34 91 411 3787 NEW YORK +1 888 747 FTSE (3873) PARIS +33 (0) 1 53 76 82 88<br />
SAN FRANCISCO +1 888 747 FTSE (3873) SYDNEY +61 2 9293 2866 TOKYO +81 3 3581 2811 MILAN +39 02 72426 641<br />
INFORMATION<br />
Index Universe<br />
FTSE Xinhua 200 Index<br />
Index Launch<br />
13 December 2003<br />
Base Date<br />
21 July 2003<br />
Base Value<br />
5000<br />
Investability Screens<br />
Free float adjusted and liquidity screened<br />
Index Calculation<br />
Index is calculated every 15 seconds. The <strong>index</strong><br />
is also calculated at end-of-day<br />
End-of-Day Distribution<br />
Index available at 20:00 local time (12:00 hours<br />
London time GMT or 13:00 hours BST) via FTP<br />
and email<br />
Currency<br />
CNY, HKD and USD (Base Currency is CNY)<br />
Review Dates<br />
Quarterly in January, April, July and October<br />
Index Rules<br />
Available at: www.<strong>ftse</strong>.com/<strong>xinhua</strong><br />
Vendor Codes<br />
Available at www.<strong>ftse</strong>.com/<strong>xinhua</strong><br />
© Copyright 2009 FTSE Xinhua Index Limited ("FXI"). All rights<br />
reserved. “FTSE ® ” is a trade mark jointly owned by the London Stock<br />
Exchange PLC and The Financial Times Limited and is used by FTSE<br />
® International Limited (“FTSE”) under licence. “ ” is a<br />
trademark of FTSE and is licensed for use by FXI. “Xinhua ® ” and<br />
® “ ” are service marks and trademarks of Xinhua Finance<br />
Limited. All marks are licensed for use by FXI. The FTSE/Xinhua China<br />
A50 Index is calculated by FXI and all rights therein vest in FXI. All<br />
information is provided for information purposes only. Whilst every<br />
effort is made to ensure that all information given in this publication<br />
is accurate, no responsibility or liability can be accepted by FXI for any<br />
errors or for any loss arising from use of this information. Distribution<br />
of FXI <strong>index</strong> values and the use of FXI indices to create financial<br />
products requires a licence from FXI. The Industry Classification<br />
Benchmark (“ICB”) is a joint product of FTSE and Dow Jones &<br />
Company, Inc (“Dow Jones”). “Dow Jones” and “DJ” are trade and<br />
service marks of Dow Jones. FTSE and Dow Jones do not accept any<br />
liability to any person for any loss or damage arising out of any error<br />
or omission in the ICB.


