STI Turnover Report (Fraser & Neave deletion) - March 2013 - FTSE
STI Turnover Report (Fraser & Neave deletion) - March 2013 - FTSE
STI Turnover Report (Fraser & Neave deletion) - March 2013 - FTSE
You also want an ePaper? Increase the reach of your titles
YUMPU automatically turns print PDFs into web optimized ePapers that Google loves.
<strong>FTSE</strong> INDEX REVIEW<br />
<strong>FTSE</strong> ST Index Series<br />
Straits Times Index (<strong>STI</strong>) - <strong>Fraser</strong> & <strong>Neave</strong> Deletion - 03 April <strong>2013</strong><br />
Review Overview<br />
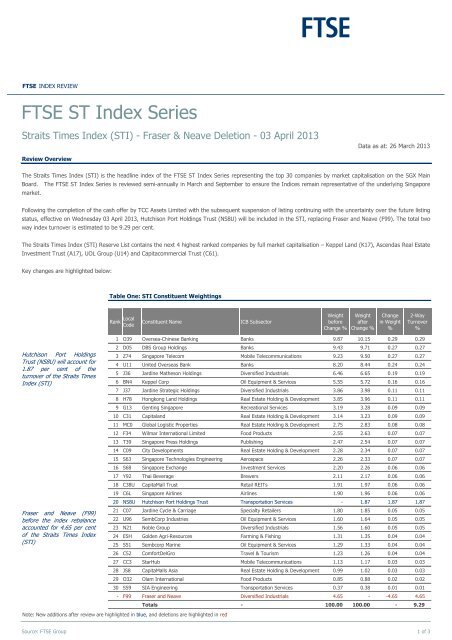
Table One: <strong>STI</strong> Constituent Weightings<br />
Data as at: 26 <strong>March</strong> <strong>2013</strong><br />
The Straits Times Index (<strong>STI</strong>) is the headline index of the <strong>FTSE</strong> ST Index Series representing the top 30 companies by market capitalisation on the SGX Main<br />
Board. The <strong>FTSE</strong> ST Index Series is reviewed semi-annually in <strong>March</strong> and September to ensure the Indices remain representative of the underlying Singapore<br />
market.<br />
Following the completion of the cash offer by TCC Assets Limited with the subsequent suspension of listing continuing with the uncertainty over the future listing<br />
status, effective on Wednesday 03 April <strong>2013</strong>, Hutchison Port Holdings Trust (NS8U) will be included in the <strong>STI</strong>, replacing <strong>Fraser</strong> and <strong>Neave</strong> (F99). The total two-<br />
way index turnover is estimated to be 9.29 per cent.<br />
The Straits Times Index (<strong>STI</strong>) Reserve List contains the next 4 highest ranked companies by full market capitalisation – Keppel Land (K17), Ascendas Real Estate<br />
Investment Trust (A17), UOL Group (U14) and Capitacommercial Trust (C61).<br />
Key changes are highlighted below:<br />
Hutchison Port Holdings<br />
Trust (NS8U) will account for<br />
1.87 per cent of the<br />
turnover of the Straits Times<br />
Index (<strong>STI</strong>)<br />
<strong>Fraser</strong> and <strong>Neave</strong> (F99)<br />
before the index rebalance<br />
accounted for 4.65 per cent<br />
of the Straits Times Index<br />
(<strong>STI</strong>)<br />
Rank Local<br />
Code<br />
Constituent Name ICB Subsector<br />
Weight<br />
before<br />
Change %<br />
Weight<br />
after<br />
Change %<br />
Change<br />
in Weight<br />
%<br />
2-Way<br />
<strong>Turnover</strong><br />
%<br />
1 O39 Oversea-Chinese Banking Banks 9.87 10.15 0.29 0.29<br />
2 D05 DBS Group Holdings Banks 9.43 9.71 0.27 0.27<br />
3 Z74 Singapore Telecom Mobile Telecommunications 9.23 9.50 0.27 0.27<br />
4 U11 United Overseas Bank Banks 8.20 8.44 0.24 0.24<br />
5 J36 Jardine Matheson Holdings Diversified Industrials 6.46 6.65 0.19 0.19<br />
6 BN4 Keppel Corp Oil Equipment & Services 5.55 5.72 0.16 0.16<br />
7 J37 Jardine Strategic Holdings Diversified Industrials 3.86 3.98 0.11 0.11<br />
8 H78 Hongkong Land Holdings Real Estate Holding & Development 3.85 3.96 0.11 0.11<br />
9 G13 Genting Singapore Recreational Services 3.19 3.28 0.09 0.09<br />
10 C31 Capitaland Real Estate Holding & Development 3.14 3.23 0.09 0.09<br />
11 MC0 Global Logistic Properties Real Estate Holding & Development 2.75 2.83 0.08 0.08<br />
12 F34 Wilmar International Limited Food Products 2.55 2.63 0.07 0.07<br />
13 T39 Singapore Press Holdings Publishing 2.47 2.54 0.07 0.07<br />
14 C09 City Developments Real Estate Holding & Development 2.28 2.34 0.07 0.07<br />
15 S63 Singapore Technologies Engineering Aerospace 2.26 2.33 0.07 0.07<br />
16 S68 Singapore Exchange Investment Services 2.20 2.26 0.06 0.06<br />
17 Y92 Thai Beverage Brewers 2.11 2.17 0.06 0.06<br />
18 C38U CapitaMall Trust Retail REITs 1.91 1.97 0.06 0.06<br />
19 C6L Singapore Airlines Airlines 1.90 1.96 0.06 0.06<br />
20 NS8U Hutchison Port Holdings Trust Transportation Services - 1.87 1.87 1.87<br />
21 C07 Jardine Cycle & Carriage Specialty Retailers 1.80 1.85 0.05 0.05<br />
22 U96 SembCorp Industries Oil Equipment & Services 1.60 1.64 0.05 0.05<br />
23 N21 Noble Group Diversified Industrials 1.56 1.60 0.05 0.05<br />
24 E5H Golden Agri-Resources Farming & Fishing 1.31 1.35 0.04 0.04<br />
25 S51 Sembcorp Marine Oil Equipment & Services 1.29 1.33 0.04 0.04<br />
26 C52 ComfortDelGro Travel & Tourism 1.23 1.26 0.04 0.04<br />
27 CC3 StarHub Mobile Telecommunications 1.13 1.17 0.03 0.03<br />
28 JS8 CapitaMalls Asia Real Estate Holding & Development 0.99 1.02 0.03 0.03<br />
29 O32 Olam International Food Products 0.85 0.88 0.02 0.02<br />
30 S59 SIA Engineering Transportation Services 0.37 0.38 0.01 0.01<br />
- F99 <strong>Fraser</strong> and <strong>Neave</strong> Diversified Industrials 4.65 - -4.65 4.65<br />
Note: New additions after review are highlighted in blue, and <strong>deletion</strong>s are highlighted in red<br />
Totals - 100.00 100.00 - 9.29<br />
Source: <strong>FTSE</strong> Group 1 of 3
Straits Times Index (<strong>STI</strong>) - <strong>Fraser</strong> & <strong>Neave</strong> Deletion - 03 April <strong>2013</strong> Data as at: 26 <strong>March</strong> <strong>2013</strong><br />
Industrial Transportation will<br />
see the largest change in<br />
Index weighting, up 1.88<br />
per cent to 2.25 per cent<br />
General Industrials will see<br />
the largest fall in Index<br />
weighting, down 4.30 per<br />
cent to 12.23 per cent<br />
After the <strong>STI</strong> review<br />
changes have been applied,<br />
the estimated tracking error<br />
and estimated correlation to<br />
the <strong>FTSE</strong> ST All-Share Index<br />
will be 2.25 per cent and<br />
0.9917 respectively<br />
Table Two: <strong>STI</strong> Sector Breakdown<br />
ICB Industry / Sector<br />
Oil & Gas<br />
Oil Equipment, Services & Distribution<br />
Industrials<br />
Aerospace & Defense<br />
General Industrials<br />
Industrial Transportation<br />
Consumer Goods<br />
Beverages<br />
Food Producers<br />
Consumer Services<br />
General Retailers<br />
Media<br />
Travel & Leisure<br />
Telecommunications<br />
Mobile Telecommunications<br />
Financials<br />
Banks<br />
Real Estate Investment & Services<br />
Real Estate Investment Trusts<br />
Financial Services<br />
Totals<br />
Table Three: <strong>STI</strong> Estimates Data<br />
Index<br />
<strong>STI</strong><br />
<strong>FTSE</strong> ST All-Share Index<br />
Number of<br />
Constituents<br />
after Change<br />
Estimated Volatility<br />
%<br />
Change<br />
in<br />
Constituents<br />
Weight<br />
before<br />
Change %<br />
Weight<br />
after<br />
Change %<br />
Change<br />
in Weight<br />
%<br />
2-Way<br />
<strong>Turnover</strong><br />
%<br />
3 0 8.44 8.69 0.25 0.25<br />
3 0 8.44 8.69 0.25 0.25<br />
6 0 19.16 16.81 -2.35 6.94<br />
1 0 2.26 2.33 0.07<br />
Source: <strong>FTSE</strong> Group 2 of 3<br />
0.07<br />
3 -1 16.53 12.23 -4.30 4.99<br />
2 1 0.37 2.25 1.88 1.88<br />
4 0 6.82 7.02 0.20<br />
0.20<br />
1 0 2.11 2.17 0.06 0.06<br />
3 0 4.72 4.85 0.14 0.14<br />
5 0 10.59 10.90 0.31<br />
0.31<br />
1 0 1.80 1.85 0.05 0.05<br />
1 0 2.47 2.54 0.07 0.07<br />
3 0 6.32 6.50 0.18<br />
0.18<br />
2 0 10.37 10.67 0.30 0.30<br />
2 0 10.37 10.67 0.30 0.30<br />
10 0 44.62<br />
45.91 1.30 1.30<br />
3 0 27.50 28.30 0.80 0.80<br />
5 0 13.00 13.38 0.38 0.38<br />
1 0 1.91 1.97 0.06 0.06<br />
1 0 2.20 2.26 0.06 0.06<br />
30 2 100.00 100.00 -<br />
Estimated<br />
Correlation<br />
Estimated Tracking<br />
Error %<br />
Estimated Beta<br />
17.52 0.9917 2.25 1.00<br />
17.43 1.0000 - 1.00<br />
9.29
Straits Times Index (<strong>STI</strong>) - <strong>Fraser</strong> & <strong>Neave</strong> Deletion - 03 April <strong>2013</strong> Data as at: 26 <strong>March</strong> <strong>2013</strong><br />
The <strong>FTSE</strong> ST Index Series and the Straits Times Index (“Index Series”) are calculated by <strong>FTSE</strong> International Limited (“<strong>FTSE</strong>”) in conjunction with SPH<br />
Data Services Pte Ltd (“SPH”) and data from Singapore Exchange Securities Trading Ltd (“SGX-ST”) (collectively the “Licensor Parties”). All rights in the<br />
Index Series vest in the Licensor Parties with all rights in the Straits Times Index (“<strong>STI</strong>”) vesting exclusively in Singapore Press Holdings Limited, the<br />
holding company of SPH. “<strong>FTSE</strong>®” is a trade mark of the London Stock Exchange Plc Group companies and is used by <strong>FTSE</strong> International Limited<br />
(“<strong>FTSE</strong>”) under licence. “Singapore Exchange”, “SGX” and “SGX-ST” are trade marks of Singapore Exchange Ltd and “Straits Times”, Straits Times Index”,<br />
“ST” and “<strong>STI</strong>” are trade marks of Singapore Press Holdings Limited. The Industry Classification Benchmark (“ICB”) is owned by <strong>FTSE</strong>.<br />
All information is provided for information purposes only. Every effort is made to ensure that all information given in this publication is accurate, but no<br />
responsibility or liability can be accepted by <strong>FTSE</strong>, any Partner or their licensors for any errors or for any loss from use of this publication. Neither <strong>FTSE</strong>,<br />
Partner nor any of their licensors makes any claim, prediction, warranty or representation whatsoever, expressly or impliedly, either as to the results to be<br />
obtained from the use of the name of the Index set out above or the fitness or suitability of the Index for any particular purpose to which it might be put.<br />
No part of this information may be reproduced, stored in a retrieval system or transmitted in any form or by any means, electronic, mechanical,<br />
photocopying, recording or otherwise, without prior written permission of <strong>FTSE</strong>. Distribution of <strong>FTSE</strong> data and the use of <strong>FTSE</strong> indices to create financial<br />
products requires a licence with <strong>FTSE</strong> and/or its licensors. <strong>FTSE</strong> does not accept any liability to any person for any loss or damage arising out of any error<br />
or omission in the ICB.<br />
EM Applications provides multi asset risk models and software tools to institutional investors around the globe. For further information please visit<br />
www.emapplications.com<br />
Source: <strong>FTSE</strong> Group 3 of 3<br />
-<br />
Data definitions available from www.ftse.com<br />
For further information visit www.ftse.com,<br />
email info@ftse.com or call your local <strong>FTSE</strong><br />
office:<br />
Sydney +61 (2) 9293 2864<br />
Beijing +86 (10) 8587 7722<br />
Dubai +971 4 319 9901<br />
Hong Kong +852 2164 3333<br />
London +44 (0) 20 7866 1810<br />
Milan +39 02 3604 6953<br />
Mumbai +91 22 6649 4180<br />
New York +1 888 747 <strong>FTSE</strong> (3873)<br />
Paris +33 (0) 1 53 76 82 89<br />
San Francisco +1 888 747 <strong>FTSE</strong> (3873)<br />
Tokyo +81 (3) 3581 2811


