

September - FTSE
September - FTSE
September - FTSE

You also want an ePaper? Increase the reach of your titles
YUMPU automatically turns print PDFs into web optimized ePapers that Google loves.
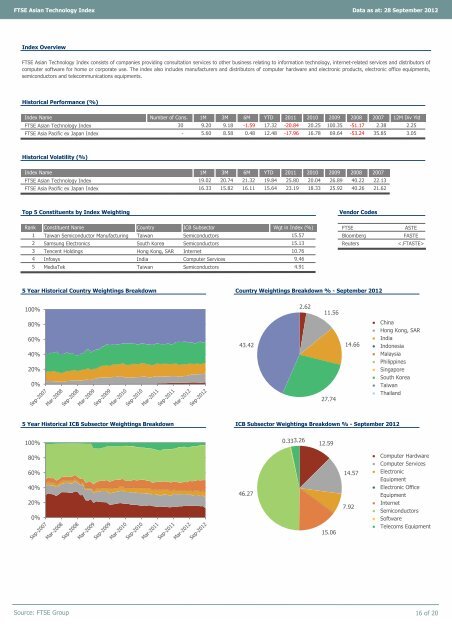
<strong>FTSE</strong> Asian Technology Index Data as at: 28 <strong>September</strong> 2012<br />
Index Overview<br />
<strong>FTSE</strong> Asian Technology Index consists of companies providing consultation services to other business relating to information technology, internet-related services and distributors of<br />
computer software for home or corporate use. The index also includes manufacturers and distributors of computer hardware and electronic products, electronic office equipments,<br />
semiconductors and telecommunications equipments.<br />
Historical Performance (%)<br />
Index Name Number of Cons. 1M 3M 6M YTD 2011 2010 2009 2008 2007 12M Div Yld<br />
<strong>FTSE</strong> Asian Technology Index<br />
<strong>FTSE</strong> Asia Pacific ex Japan Index<br />
Historical Volatility (%)<br />
Index Name 1M 3M 6M YTD 2011 2010 2009 2008<br />
<strong>FTSE</strong> Asian Technology Index<br />
<strong>FTSE</strong> Asia Pacific ex Japan Index<br />
16.33 15.82 16.11 15.64 23.19 18.33 25.92 40.26 21.62<br />
Top 5 Constituents by Index Weighting Vendor Codes<br />
Rank Constituent Name Country ICB Subsector Wgt in Index (%)<br />
<strong>FTSE</strong> ASTE<br />
1 Taiwan Semiconductor Manufacturing Taiwan Semiconductors 15.57<br />
Bloomberg FASTE<br />
2 Samsung Electronics South Korea Semiconductors 15.13<br />
Reuters <br />
3 Tencent Holdings Hong Kong, SAR Internet<br />
10.76<br />
4 Infosys India Computer Services<br />
9.46<br />
5 MediaTek Taiwan Semiconductors<br />
4.91<br />
5 Year Historical Country Weightings Breakdown Country Weightings Breakdown % - <strong>September</strong> 2012<br />
100%<br />
80%<br />
60%<br />
40%<br />
20%<br />
0%<br />
30 9.20 9.18 -1.59 17.32 -20.84 20.25 100.35 -51.17<br />
● China<br />
● Hong Kong, SAR<br />
● India<br />
● Indonesia<br />
● Malaysia<br />
● Philippines<br />
● Singapore<br />
● South Korea<br />
● Taiwan<br />
● Thailand<br />
5 Year Historical ICB Subsector Weightings Breakdown ICB Subsector Weightings Breakdown % - <strong>September</strong> 2012<br />
● Computer Hardware<br />
● Computer Services<br />
● Electronic<br />
Equipment<br />
● Electronic Office<br />
Equipment<br />
● Internet<br />
● Semiconductors<br />
● Software<br />
● Telecoms Equipment<br />
Source: <strong>FTSE</strong> Group 16 of 20<br />
2007<br />
19.02 20.74 21.32 19.84 25.80 20.04 26.89 40.22 22.13<br />
2.38 2.25<br />
- 5.60 8.58 0.48 12.48 -17.96 16.78 69.64 -53.24 35.85 3.05<br />
100% 0.33 3.26<br />
12.59<br />
80%<br />
60%<br />
40%<br />
20%<br />
0%<br />
43.42<br />
46.27<br />
2.62<br />
11.56<br />
27.74<br />
15.06<br />
14.66<br />
14.57<br />
7.92


