1989 - FTSE
1989 - FTSE
1989 - FTSE

Create successful ePaper yourself
Turn your PDF publications into a flip-book with our unique Google optimized e-Paper software.
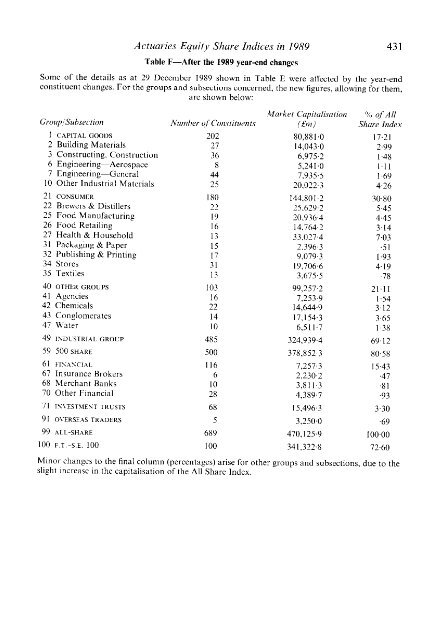
Actuaries Equity Share Indices in <strong>1989</strong> 431<br />
Table F—After the <strong>1989</strong> year-end changes<br />
Some of the details as at 29 December <strong>1989</strong> shown in Table E were affected by the year-end<br />
constituent changes. For the groups and subsections concerned, the new figures, allowing for them,<br />
are shown below:<br />
Group/Subsection Number of Constituents<br />
Market Capitalisation<br />
(£m)<br />
% of All<br />
Share Index<br />
1 CAPITAL GOODS<br />
2 Building Materials<br />
3 Constructing, Construction<br />
6 Engineering—Aerospace<br />
7 Engineering—General<br />
10 Other Industrial Materials<br />
202<br />
27<br />
36<br />
8<br />
44<br />
25<br />
80,881·0<br />
14,043·0<br />
6,975·2<br />
5,241·O<br />
7,935·5<br />
20,022·3<br />
17·21<br />
2·99<br />
1·48<br />
1·11<br />
1·69<br />
4·26<br />
21 CONSUMER<br />
22 Brewers & Distillers<br />
25 Food Manufacturing<br />
26 Food Retailing<br />
27 Health & Household<br />
31 Packaging & Paper<br />
32 Publishing & Printing<br />
34 Stores<br />
35 Textiles<br />
180<br />
22<br />
19<br />
16<br />
13<br />
15<br />
17<br />
31<br />
13<br />
144,801.2<br />
25,629·2<br />
20,936·4<br />
14,764.2<br />
33,027·4<br />
2,396·3<br />
9,079·3<br />
19,706·6<br />
3,675·5<br />
30·80<br />
5.45<br />
4·45<br />
3·14<br />
7·03<br />
·51<br />
1·93<br />
4·19<br />
·78<br />
40 OTHER GROUPS<br />
41 Agencies<br />
42 Chemicals<br />
103<br />
16<br />
22<br />
99,257·2<br />
7,253·9<br />
14,644·9<br />
21·11<br />
1·54<br />
3·12<br />
43 Conglomerates<br />
47 Water<br />
14<br />
10<br />
17,154·3<br />
6,511·7<br />
3·65<br />
1·38<br />
49 INDUSTRIAL GROUP 485 324,939·4 69·12<br />
59 500 SHARE 500 378,852·3 80·58<br />
61 FINANCIAL<br />
67 Insurance Brokers<br />
68 Merchant Banks<br />
70 Other Financial<br />
116<br />
6<br />
10<br />
28<br />
7,257·3<br />
2,230·2<br />
3,811·3<br />
4,389·7<br />
15·43<br />
·47<br />
·81<br />
·93<br />
71 INVESTMENT TRUSTS 68 15,496·3 3·30<br />
91 OVERSEAS TRADERS 5 3,250·O ·69<br />
99 ALL-SHARE 689 470,125·9 100·00<br />
100 F.T.–S.E. 100 100 341,322·8 72·60<br />
Minor changes to the final column (percentages) arise for other groups and subsections, due to the<br />
slight Increase in the capitalisation of the All Share Index.