

natural Hazards and Climate Change risks - GFDRR
natural Hazards and Climate Change risks - GFDRR
natural Hazards and Climate Change risks - GFDRR

Create successful ePaper yourself
Turn your PDF publications into a flip-book with our unique Google optimized e-Paper software.
awareness-raising <strong>and</strong> institutional engagement purposes intended here. Extensions to this<br />
analysis, not covered at the current pilot stage, may include (a) consideration of other <strong>natural</strong><br />
hazards; (b) more thorough evaluation of the potential economic impact of <strong>natural</strong> hazards,<br />
taking into account direct <strong>and</strong> indirect damages; <strong>and</strong> (c) additional analysis of more detailed<br />
geographic information systems (GIS) data, cadastres, <strong>and</strong> first-h<strong>and</strong> ground-truthing, to<br />
ascertain detailed <strong>risks</strong> faced by specific populations <strong>and</strong> built areas in the broad areas<br />
indicated here as under risk.<br />
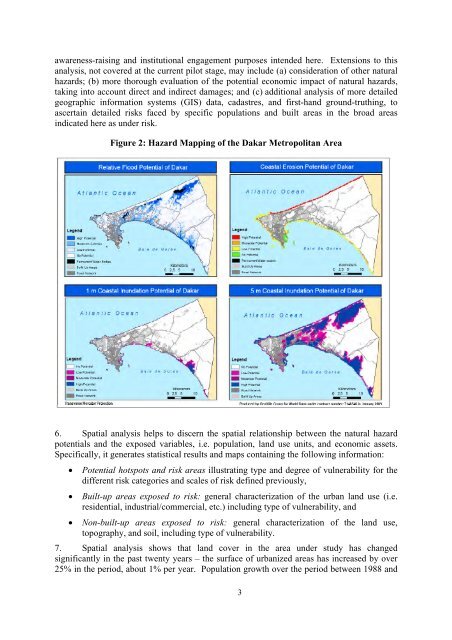
Figure 2: Hazard Mapping of the Dakar Metropolitan Area<br />
6. Spatial analysis helps to discern the spatial relationship between the <strong>natural</strong> hazard<br />
potentials <strong>and</strong> the exposed variables, i.e. population, l<strong>and</strong> use units, <strong>and</strong> economic assets.<br />
Specifically, it generates statistical results <strong>and</strong> maps containing the following information:<br />
<br />
<br />
Potential hotspots <strong>and</strong> risk areas illustrating type <strong>and</strong> degree of vulnerability for the<br />
different risk categories <strong>and</strong> scales of risk defined previously,<br />
Built-up areas exposed to risk: general characterization of the urban l<strong>and</strong> use (i.e.<br />
residential, industrial/commercial, etc.) including type of vulnerability, <strong>and</strong><br />
Non-built-up areas exposed to risk: general characterization of the l<strong>and</strong> use,<br />
topography, <strong>and</strong> soil, including type of vulnerability.<br />
7. Spatial analysis shows that l<strong>and</strong> cover in the area under study has changed<br />
significantly in the past twenty years – the surface of urbanized areas has increased by over<br />
25% in the period, about 1% per year. Population growth over the period between 1988 <strong>and</strong><br />
3


