

natural Hazards and Climate Change risks - GFDRR
natural Hazards and Climate Change risks - GFDRR
natural Hazards and Climate Change risks - GFDRR

You also want an ePaper? Increase the reach of your titles
YUMPU automatically turns print PDFs into web optimized ePapers that Google loves.
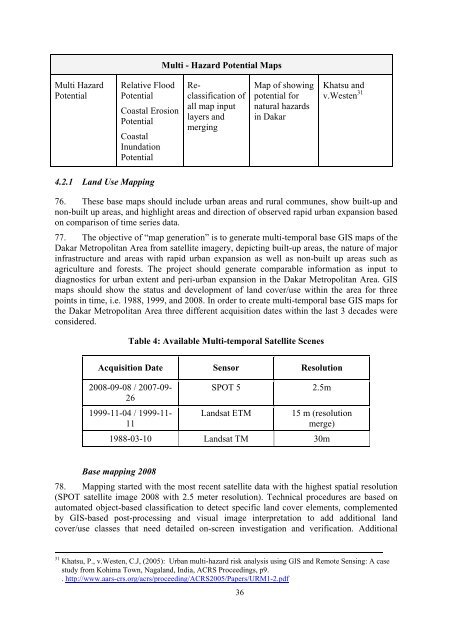
Multi - Hazard Potential Maps<br />
Multi Hazard<br />
Potential<br />
Relative Flood<br />
Potential<br />
Coastal Erosion<br />
Potential<br />
Coastal<br />
Inundation<br />
Potential<br />
Reclassification<br />
of<br />
all map input<br />
layers <strong>and</strong><br />
merging<br />
Map of showing<br />
potential for<br />
<strong>natural</strong> hazards<br />
in Dakar<br />
Khatsu <strong>and</strong><br />
v.Westen 31<br />
4.2.1 L<strong>and</strong> Use Mapping<br />
76. These base maps should include urban areas <strong>and</strong> rural communes, show built-up <strong>and</strong><br />
non-built up areas, <strong>and</strong> highlight areas <strong>and</strong> direction of observed rapid urban expansion based<br />
on comparison of time series data.<br />
77. The objective of “map generation” is to generate multi-temporal base GIS maps of the<br />
Dakar Metropolitan Area from satellite imagery, depicting built-up areas, the nature of major<br />
infrastructure <strong>and</strong> areas with rapid urban expansion as well as non-built up areas such as<br />
agriculture <strong>and</strong> forests. The project should generate comparable information as input to<br />
diagnostics for urban extent <strong>and</strong> peri-urban expansion in the Dakar Metropolitan Area. GIS<br />
maps should show the status <strong>and</strong> development of l<strong>and</strong> cover/use within the area for three<br />
points in time, i.e. 1988, 1999, <strong>and</strong> 2008. In order to create multi-temporal base GIS maps for<br />
the Dakar Metropolitan Area three different acquisition dates within the last 3 decades were<br />
considered.<br />
Table 4: Available Multi-temporal Satellite Scenes<br />
Acquisition Date Sensor Resolution<br />
2008-09-08 / 2007-09-<br />
26<br />
1999-11-04 / 1999-11-<br />
11<br />
SPOT 5 2.5m<br />
L<strong>and</strong>sat ETM<br />
15 m (resolution<br />
merge)<br />
1988-03-10 L<strong>and</strong>sat TM 30m<br />
Base mapping 2008<br />
78. Mapping started with the most recent satellite data with the highest spatial resolution<br />
(SPOT satellite image 2008 with 2.5 meter resolution). Technical procedures are based on<br />
automated object-based classification to detect specific l<strong>and</strong> cover elements, complemented<br />
by GIS-based post-processing <strong>and</strong> visual image interpretation to add additional l<strong>and</strong><br />
cover/use classes that need detailed on-screen investigation <strong>and</strong> verification. Additional<br />
31 Khatsu, P., v.Westen, C.J, (2005): Urban multi-hazard risk analysis using GIS <strong>and</strong> Remote Sensing: A case<br />
study from Kohima Town, Nagal<strong>and</strong>, India, ACRS Proceedings, p9.<br />
. http://www.aars-crs.org/acrs/proceeding/ACRS2005/Papers/URM1-2.pdf<br />
36


