

natural Hazards and Climate Change risks - GFDRR
natural Hazards and Climate Change risks - GFDRR
natural Hazards and Climate Change risks - GFDRR

You also want an ePaper? Increase the reach of your titles
YUMPU automatically turns print PDFs into web optimized ePapers that Google loves.
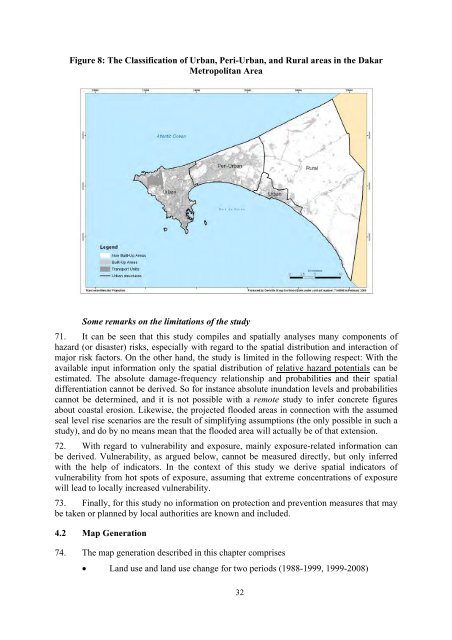
Figure 8: The Classification of Urban, Peri-Urban, <strong>and</strong> Rural areas in the Dakar<br />
Metropolitan Area<br />
Some remarks on the limitations of the study<br />
71. It can be seen that this study compiles <strong>and</strong> spatially analyses many components of<br />
hazard (or disaster) <strong>risks</strong>, especially with regard to the spatial distribution <strong>and</strong> interaction of<br />
major risk factors. On the other h<strong>and</strong>, the study is limited in the following respect: With the<br />
available input information only the spatial distribution of relative hazard potentials can be<br />
estimated. The absolute damage-frequency relationship <strong>and</strong> probabilities <strong>and</strong> their spatial<br />
differentiation cannot be derived. So for instance absolute inundation levels <strong>and</strong> probabilities<br />
cannot be determined, <strong>and</strong> it is not possible with a remote study to infer concrete figures<br />
about coastal erosion. Likewise, the projected flooded areas in connection with the assumed<br />
seal level rise scenarios are the result of simplifying assumptions (the only possible in such a<br />
study), <strong>and</strong> do by no means mean that the flooded area will actually be of that extension.<br />
72. With regard to vulnerability <strong>and</strong> exposure, mainly exposure-related information can<br />
be derived. Vulnerability, as argued below, cannot be measured directly, but only inferred<br />
with the help of indicators. In the context of this study we derive spatial indicators of<br />
vulnerability from hot spots of exposure, assuming that extreme concentrations of exposure<br />
will lead to locally increased vulnerability.<br />
73. Finally, for this study no information on protection <strong>and</strong> prevention measures that may<br />
be taken or planned by local authorities are known <strong>and</strong> included.<br />
4.2 Map Generation<br />
74. The map generation described in this chapter comprises<br />
L<strong>and</strong> use <strong>and</strong> l<strong>and</strong> use change for two periods (1988-1999, 1999-2008)<br />
32


