Biodiversity - a GRI Reporting Resource - Global Reporting Initiative
Biodiversity - a GRI Reporting Resource - Global Reporting Initiative
Biodiversity - a GRI Reporting Resource - Global Reporting Initiative

Create successful ePaper yourself
Turn your PDF publications into a flip-book with our unique Google optimized e-Paper software.
Box 1: Direct versus indirect impact<br />
Activities cannot be carried out by organizations without impacting biodiversity. They can cause:<br />
• A direct impact when an organization’s activities directly affect biodiversity. For example, when degraded land is converted for<br />
the benefit of production activities, surface water is used for irrigation purposes, toxic materials are released, or local species are<br />
disturbed through the noise and light produced at a processing site.<br />
• An indirect impact when the impact is caused by parties in an organization’s supply chain(s). For example, when an organization<br />
imports fruits and vegetables, produces cotton shirts, sells construction materials or publishes books, the production of the input<br />
for these goods will have direct impacts on biodiversity.<br />
Indirect impacts can also include impacts from activities that have been triggered by the organization’s operations. For example, a<br />
road constructed to transport products from a forestry operation can have the indirect effect of stimulating the migration of workers<br />
to an unsettled region and encouraging new commercial development alongside the road.<br />
Indirect impacts may be relatively difficult to predict and manage, but they can be as significant as direct impacts and can easily<br />
affect an organization. Impacts on biodiversity can be either negative (degrading the quality/quantity of biodiversity) or positive<br />
(creating a net contribution to the quality/quantity of biodiversity).<br />
1.2 The <strong>Biodiversity</strong> <strong>Resource</strong><br />
Document and the <strong>GRI</strong><br />
Indicators<br />
BIODIVERSITY PERFORMANCE<br />
INDICATORS AND THE BIODIVERSITY<br />
RESOURCE DOCUMENT<br />
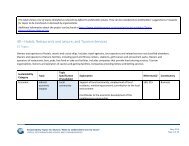
Table 1.1: Core and Additional Performance<br />
Indicators on biodiversity 3<br />
The <strong>GRI</strong>’s vision is for reporting on economic,<br />
environmental, and social performance<br />
by all organizations to be as routine and<br />
comparable as financial reporting.<br />
The <strong>GRI</strong> accomplishes this vision by<br />
developing, continuously improving and<br />
building capacity around the use of a<br />
Sustainability <strong>Reporting</strong> Framework, the<br />
core of which are the Sustainability <strong>Reporting</strong><br />
Guidelines (the ‘Guidelines’). Other<br />
components in the <strong>Reporting</strong> Framework<br />
are Sector Supplements and Protocols. This<br />
reporting guidance - in the form of principles<br />
and standard disclosures - is provided as a free<br />
public good. The <strong>GRI</strong> <strong>Reporting</strong> Framework is<br />
summarized in Annex 1.<br />
The Guidelines contain two categories<br />
of Performance Indicators: Core (relevant<br />
to most reporting organizations) and<br />
Additional (of interest to most stakeholders).<br />
Performance Indicators are structured according<br />
to a hierarchy of Category, Aspect,<br />
and Indicator 2 . One of the Aspects in the<br />
environmental category is biodiversity.<br />
Table 1.1 gives an overview of the Core<br />
and Additional <strong>Biodiversity</strong> Performance<br />
Indicators in the G3 Guidelines.<br />
Indicator Protocols have been developed<br />
by <strong>GRI</strong> to guide organizations on the<br />
interpretation of Indicators. Complementary<br />
to the Performance Indicators and their<br />
Indicator Protocols, this <strong>Resource</strong> Document<br />
is intended to offer an overview of biodiversity<br />
issues encountered in the context of<br />
reporting. Reading the <strong>Biodiversity</strong> <strong>Resource</strong><br />
Document may help organizations to better<br />
structure their biodiversity reporting by<br />
understanding the wider context of, and<br />
relationship between, their activities and<br />
biodiversity.<br />
Although the <strong>GRI</strong> <strong>Biodiversity</strong> Performance<br />
Indicators in the G3 Guidelines have been<br />
designed as a framework for organizations<br />
to report on biodiversity, the organization’s<br />
relationship with biodiversity might encompass<br />
more than has been captured by the G3<br />
Indicators. Some of the other most relevant<br />
G3 Indicators are summarized in Figure 3.3.<br />
Organizations using this <strong>Biodiversity</strong> <strong>Resource</strong><br />
Document are encouraged to take a<br />
broad view on biodiversity and translate this<br />
into their reporting.<br />
CO R E<br />
CO R E<br />
A D D<br />
A D D<br />
A D D<br />
EN11 Location and size of land<br />
owned, leased, managed in, or<br />
adjacent to, protected areas and<br />
areas of high biodiversity value<br />
outside protected areas.<br />
EN12 Description of significant<br />
impacts of activities, products,<br />
and services on biodiversity in<br />
protected areas and areas of<br />
high biodiversity value outside<br />
protected areas.<br />
EN13 Habitats protected or restored.<br />
EN14 Strategies, current actions,<br />
and future plans for managing<br />
impacts on biodiversity.<br />
EN15 Number of IUCN Red<br />
List species and national<br />
conservation list species with<br />
habitats in areas affected<br />
by operations, by level of<br />
extinction risk.<br />
2] The <strong>GRI</strong> Sustainability <strong>Reporting</strong> Guidelines<br />
can be found at www.globalreporting.org.<br />
3] EN11 refers to ‘Environamental Indicator<br />
number 11’.<br />
R e p o r t i n g o n B i o d i v e r s i t y<br />
9