Geological Survey of Denmark and Greenland Bulletin 26 ... - Geus
Geological Survey of Denmark and Greenland Bulletin 26 ... - Geus
Geological Survey of Denmark and Greenland Bulletin 26 ... - Geus

Create successful ePaper yourself
Turn your PDF publications into a flip-book with our unique Google optimized e-Paper software.
GEOLOGICAL SURVEY OF DENMARK AND GREENLAND BULLETIN <strong>26</strong> • 2012<br />
Review <strong>of</strong> <strong>Survey</strong> activities 2011<br />
Edited by<br />
Ole Bennike, Adam A. Garde <strong>and</strong> W. Stuart Watt<br />
GEOLOGICAL SURVEY OF DENMARK AND GREENLAND<br />
MINISTRY OF CLIMATE, ENERGY AND BUILDING<br />
1
<strong>Geological</strong> <strong>Survey</strong> <strong>of</strong> <strong>Denmark</strong> <strong>and</strong> Greenl<strong>and</strong> <strong>Bulletin</strong> <strong>26</strong><br />
Keywords<br />
<strong>Geological</strong> <strong>Survey</strong> <strong>of</strong> <strong>Denmark</strong> <strong>and</strong> Greenl<strong>and</strong>, survey organisations, current research, <strong>Denmark</strong>, Greenl<strong>and</strong>.<br />
Cover photographs from left to right<br />
1. Retrieving a sediment core in Sermilik fjord, South-East Greenl<strong>and</strong>. Photograph: Robert S. Fausto.<br />
2. Field work in Vietnam. Photograph: Flemming Larsen.<br />
3. This Danish beech forest on Fyn was farm l<strong>and</strong> during the Iron Age. Photograph: Ole Bennike.<br />
4. Small-scale miners in Nigeria. Worldwide, c. 100 million people depend on small-scale mining. Photograph: John Tychsen.<br />
Frontispiece: facing page<br />
In the summer <strong>of</strong> 2011, GEUS carried out extensive reconnaissance work in South-East Greenl<strong>and</strong>. The aim is to assess the mineral potential <strong>of</strong><br />
the region, which is one <strong>of</strong> the least known regions <strong>of</strong> Greenl<strong>and</strong>. The geologist is panning stream sediments in order to separate heavy minerals,<br />
possibly including gold. Photograph: Jakob Lautrup.<br />
Chief editor <strong>of</strong> this series: Adam A. Garde<br />
Editorial board <strong>of</strong> this series: John A. Korstgård, Department <strong>of</strong> Geoscience, Aarhus University; Minik Rosing, <strong>Geological</strong> Museum, University<br />
<strong>of</strong> Copenhagen; Finn Surlyk, Department <strong>of</strong> Geography <strong>and</strong> Geology, University <strong>of</strong> Copenhagen<br />
Scientific editors: Ole Bennike, Adam A. Garde <strong>and</strong> W. Stuart Watt<br />
Editorial secretaries: Jane Holst <strong>and</strong> Esben W. Glendal<br />
Referees: (numbers refer to first page <strong>of</strong> reviewed article): Johanna Anjar, SE (29); Anonymous (65), Niels Balling, DK (41); Stefan Bernstein,<br />
DK (57); Albertas Bitinas, LT (29); Lars Ole Boldreel, DK (81); Henrik Breuning, DK (85); Gregers Dam, DK (61); Margaret Dolan, NO<br />
(25); Ida Fabricius, DK (9); Tomas Feseker, DE (69); Kerstin Geitner, DK (25); Lawrence Gill, DK (65); Sam Holloway, UK (45); Michael<br />
Houmark-Nielsen, DK (17); Shfaqat Abbas Khan, DK (41); Poul-Henrik Larsen, DK (61); James Lawrence, UK (33); Clive Mitchell, UK<br />
(85); Farrokh Nadim, NO (33); Thomas Pape, DE (69); Heikki Papunen, FI (53); Asger Ken Pedersen, DK (57); Gunver Krarup Pedersen,<br />
DK (9); Stefan Piasecki, DK (13); Hans Plaat, NL (45); Manuel Pubellier, FR (81); Jan Audun Rasmussen, DK (13); Anders Schomacker,<br />
NO (17); Inga Sørensen, DK (37); Jette Sørensen, DK (37); Mathilde B. Sørensen, NO (77); Henrik Stendal, GL (53); Kristian Syberg, DK<br />
(49); Matti Tarvainen, FI (77); Henry Vallius, FI (21); Karen Vilholth, LK (49); Michiel van den Broecke, NL (73); Roy H. Wilkens, USA<br />
(21); Jacob Clement Yde, NO (73).<br />
Illustrations: Stefan Sølberg, Jette Halskov, Willy Weng, Frants v. Platen-Hallermund <strong>and</strong> Benny M. Schark<br />
Layout <strong>and</strong> graphic production: Kristian Rasmussen<br />
Printers: Rosendahls-Schultz Grafisk A/S, Albertslund, <strong>Denmark</strong><br />
Manuscripts received: 6 January 2012 – 8 May 2012<br />
Final versions approved: 13 February 2012 – 23 May 2012<br />
Printed: 10 July 2012<br />
ISSN 1604-8156<br />
ISBN 978-87-7871-339-1<br />
Citation <strong>of</strong> the name <strong>of</strong> this series<br />
It is recommended that the name <strong>of</strong> this series is cited in full, viz. <strong>Geological</strong> <strong>Survey</strong> <strong>of</strong> <strong>Denmark</strong> <strong>and</strong> Greenl<strong>and</strong> <strong>Bulletin</strong>.<br />
If abbreviation <strong>of</strong> the name <strong>of</strong> this volume is necessary, the following form is suggested: Geol. Surv. Den. Green. Bull. <strong>26</strong>, 88 pp.<br />
Available from<br />
<strong>Geological</strong> <strong>Survey</strong> <strong>of</strong> <strong>Denmark</strong> <strong>and</strong> Greenl<strong>and</strong> (GEUS)<br />
Øster Voldgade 10, DK-1350 Copenhagen K, <strong>Denmark</strong><br />
Phone: +45 38 14 20 00, fax: +45 38 14 20 50, e-mail: geus@geus.dk. See also www.geus.dk/publications/bull<br />
© De Nationale Geologiske Undersøgelser for Danmark og Grønl<strong>and</strong> (GEUS) 2012<br />
For the full text <strong>of</strong> the GEUS copyright clause, please refer to www.geus.dk/publications/bull<br />
2
Greenl<strong>and</strong><br />
<strong>Denmark</strong><br />
Mexico<br />
Nigeria<br />
Ghana<br />
Cameroun<br />
Ethiopia<br />
Kenya<br />
7 Review <strong>of</strong> <strong>Survey</strong> activities 2011<br />
F.G. Christiansen<br />
9 Nano-quartz in North Sea Danian chalk<br />
H. Lindgreen <strong>and</strong> F. Jakobsen<br />
Bolivia<br />
Brazil<br />
Zambia<br />
Botswana<br />
Namibia<br />
South Africa<br />
Tanzania<br />
Mozambique<br />
13 Geology <strong>of</strong> the Femern Bælt area between<br />
<strong>Denmark</strong> <strong>and</strong> Germany<br />
E. Sheldon, P. Gravesen <strong>and</strong> H. Nøhr-Hansen<br />
17 Rock-cored drumlins on Bornholm, <strong>Denmark</strong><br />
P.R. Jakobsen<br />
21 Methane distribution in Holocene marine sediments<br />
in the Bornholm Basin, southern Sc<strong>and</strong>inavia<br />
J.B. Jensen <strong>and</strong> R. Endler<br />
25 Natura 2000 habitat mapping in Kattegat, <strong>Denmark</strong>:<br />
an example from Læsø Trindel<br />
Z.K. Al-Hamdani <strong>and</strong> L.G. Addington<br />
29 Early Holocene sea-level changes in Øresund,<br />
southern Sc<strong>and</strong>inavia<br />
O. Bennike, M.S. Andreasen, J.B. Jensen, M. Moros <strong>and</strong><br />
N. Noe-Nygaard<br />
33 Cliff collapse at Stevns Klint, south-east <strong>Denmark</strong><br />
S.A.S. Pedersen <strong>and</strong> T. Damholt<br />
37 Shallow geothermal energy in <strong>Denmark</strong><br />
T. Vangkilde-Pedersen, C. Ditlefsen <strong>and</strong> A.L. Højberg<br />
41 Efforts to include geological <strong>and</strong> geodetic<br />
observations in the assessment <strong>of</strong> earthquake activity<br />
in <strong>Denmark</strong><br />
S. Gregersen <strong>and</strong> P.H. Voss<br />
45 Results <strong>of</strong> monitoring groundwater above the natural<br />
gas underground storage at Stenlille, <strong>Denmark</strong><br />
T. Laier<br />
49 Groundwater protection in <strong>Denmark</strong> <strong>and</strong> the role <strong>of</strong><br />
water supply companies<br />
J.D. Petersen <strong>and</strong> L.F. Jørgensen<br />
4
GEUS working areas 2011.<br />
Orange areas are covered in this volume.<br />
India<br />
Vietnam<br />
Thail<strong>and</strong><br />
The Philippines<br />
Indonesia<br />
69 Methane <strong>and</strong> possible gas hydrates in the Disko Bugt<br />
region, central West Greenl<strong>and</strong><br />
N. Mikkelsen, T. Laier, T. Nielsen, A. Kuijpers <strong>and</strong><br />
N. Nørgaard-Pedersen<br />
53 Anorthosites in Greenl<strong>and</strong>: a possible raw material<br />
for aluminium?<br />
C. Knudsen, J. Wanvik <strong>and</strong> H. Svahnberg<br />
57 From 3D mapping to 3D modelling: a case study<br />
from the Skaergaard intrusion, southern East<br />
Greenl<strong>and</strong><br />
K. Svennevig <strong>and</strong> P. Guarnieri<br />
61 <strong>Geological</strong> assessment <strong>of</strong> the East Greenl<strong>and</strong> margin<br />
M.B.W. Fyhn, T.M. Rasmussen, T. Dahl-Jensen, W.L. Weng,<br />
J.A. Bojesen-Koefoed <strong>and</strong> T. Nielsen<br />
65 New evidence for possible generation <strong>of</strong> oil<br />
<strong>of</strong>f south-western Greenl<strong>and</strong><br />
T. Laier <strong>and</strong> H.P. Nyt<strong>of</strong>t<br />
73 Ablation observations for 2008–2011 from the<br />
Programme for Monitoring <strong>of</strong> the Greenl<strong>and</strong> Ice<br />
Sheet (PROMICE)<br />
R.S. Fausto, D. van As <strong>and</strong> the PROMICE project team<br />
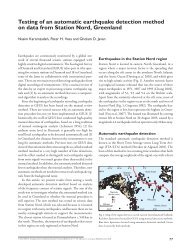
77 Testing <strong>of</strong> an automatic earthquake detection<br />
method on data from Station Nord, Greenl<strong>and</strong><br />
N. Karamzadeh, P.H. Voss <strong>and</strong> G.D. Javan<br />
81 The Cenozoic Song Hong <strong>and</strong> Beibuwan Basins,<br />
Vietnam<br />
M.B.W. Fyhn, H.I. Petersen, L.H. Nielsen, T.C. Giang,<br />
L.H. Nga, N.T.M. Hong, N.D. Nguyen <strong>and</strong> I. Abatzis<br />
85 Rock phosphate <strong>and</strong> lime for small-scale farming<br />
in Tanzania, East Africa<br />
P. Kalvig, N. Fold, J.B. Jønsson <strong>and</strong> E.E. Mshiu<br />
5
Review <strong>of</strong> <strong>Survey</strong> activities 2011<br />
Flemming G. Christiansen<br />
Deputy Director<br />
2011 was a good year for the <strong>Geological</strong> <strong>Survey</strong> <strong>of</strong> <strong>Denmark</strong><br />
<strong>and</strong> Greenl<strong>and</strong> (GEUS) with fruitful discussions <strong>of</strong> strategies,<br />
h<strong>and</strong>ling <strong>of</strong> challenges posed to our society that has<br />
strong needs for growth <strong>and</strong> investments, <strong>and</strong> consequently<br />
for developing new projects for the future within the many<br />
fields where GEUS is involved.<br />
GEUS has been through a long – but very constructive<br />
– process <strong>of</strong> putting together a new strategy that reflects<br />
the changes in society <strong>and</strong> new dem<strong>and</strong>s from many different<br />
stakeholders. This new strategy, ‘Geology for society –<br />
knowledge for growth <strong>and</strong> welfare’, covers the period up to<br />
2020 <strong>and</strong> is based on an analysis <strong>of</strong> key driving forces such as<br />
transition from fossil fuel to sustainable energy, adaptation<br />
to changing climate conditions, need for water resources locally<br />
<strong>and</strong> globally, <strong>and</strong> international competition for critical<br />
minerals. The strategy includes a number <strong>of</strong> specific strategic<br />
topics. As these topics have been discussed between scientists<br />
<strong>and</strong> management over a long period <strong>and</strong> in some cases are<br />
related to new <strong>and</strong> on-going <strong>Survey</strong> projects, these topics are<br />
reflected in many <strong>of</strong> the papers in this year’s issue <strong>of</strong> Review<br />
<strong>of</strong> <strong>Survey</strong> activities.<br />
The reader will find contributions covering several <strong>of</strong> our<br />
new strategic topics such as: ‘Past <strong>and</strong> future climate’, ‘Geology<br />
across l<strong>and</strong> <strong>and</strong> sea’, ‘Geology in the public arena’, ‘Water<br />
resources under pressure’, ‘Oil <strong>and</strong> gas supply <strong>and</strong> transition<br />
to green energy’ <strong>and</strong> ‘Geothermal energy <strong>and</strong> heat storage’,<br />
as well as papers on other subjects from GEUS’ very broad<br />
project portfolio. Some <strong>of</strong> them describe specific, short projects,<br />
<strong>and</strong> others focus on results from some <strong>of</strong> our long-term<br />
monitoring projects on for example groundwater, gas storage,<br />
ice <strong>and</strong> earthquakes.<br />
GEUS’ activities <strong>and</strong> research in <strong>Denmark</strong> cover many<br />
different subjects such as fossil fuel <strong>and</strong> renewable energy,<br />
water, climate history <strong>and</strong> monitoring <strong>and</strong> adaptation to climate<br />
changes, nature protection, input to large infrastructure<br />
projects <strong>and</strong> data management.<br />
Chalk is the main oil reservoir in the Danish part <strong>of</strong> the<br />
North Sea <strong>and</strong> underst<strong>and</strong>ing its mineralogy <strong>and</strong> diagenesis<br />
has crucial implications for production parameters. One<br />
paper proposes a new model for the formation <strong>of</strong> flint from<br />
studies <strong>of</strong> nano-quartz.<br />
As part <strong>of</strong> planning the fixed link across Femern Bælt<br />
between <strong>Denmark</strong> <strong>and</strong> Germany, GEUS has been involved<br />
in geological <strong>and</strong> geotechnical investigations. Results <strong>of</strong> a<br />
multidisciplinary biostratigraphic study <strong>of</strong> pre-Quaternary<br />
deposits (especially Paleocene <strong>and</strong> Eocene) are summarised<br />
here.<br />
Although the surface morphology <strong>of</strong> <strong>Denmark</strong> is well<br />
mapped <strong>and</strong> described in detail, there is still room for new<br />
observations <strong>and</strong> reinterpretation <strong>of</strong> some glacially formed<br />
features like rock-cored drumlins from Bornholm that are<br />
described for the first time.<br />
Underst<strong>and</strong>ing methane distribution in young marine<br />
sediments is important for long-term use <strong>and</strong> protection <strong>of</strong><br />
areas such as the Baltic Sea. GEUS has been partner in the<br />
Baltic Gas project with a key role to map the occurrence <strong>of</strong><br />
free gas, to quantify the flux <strong>of</strong> gas <strong>and</strong> to study the processes<br />
<strong>and</strong> parameters governing methane generation <strong>and</strong> consumption.<br />
Natura 2000 is a network <strong>of</strong> nature protection<br />
areas under the Habitats Directive <strong>of</strong> the European Union.<br />
Some results from mapping <strong>of</strong> a Natura 2000 area with bubbling<br />
reefs in the inner Danish waters are presented in this<br />
volume. Another paper describes how Øresund became a<br />
strait between 8000 <strong>and</strong> 9000 years ago due to sea-level rise<br />
after an earlier history <strong>of</strong> being dry l<strong>and</strong> with some bogs <strong>and</strong><br />
lakes, <strong>and</strong> later a fjord.<br />
The coastal cliff Stevns Klint is a classical locality for field<br />
trips, especially for studying the world’s best exposed Cretaceous–Tertiary<br />
boundary, but also for the beautiful scenery.<br />
For this reason an underst<strong>and</strong>ing <strong>of</strong> the risks <strong>of</strong> cliff collapse<br />
is crucial, <strong>and</strong> an analysis <strong>of</strong> the different collapse types including<br />
volumetric considerations based on photogrammetric<br />
studies is given in one <strong>of</strong> the papers.<br />
With a strong Danish ambition to reduce the dependence<br />
on fossil fuel by using renewable energy sources, shallow<br />
geothermal energy can be economically competitive. One<br />
paper introduces this concept with comments on exploitation,<br />
modelling <strong>and</strong> groundwater protection. The latter is<br />
very important in <strong>Denmark</strong> where almost all drinking water<br />
comes from groundwater. The Danish policy on this topic<br />
<strong>and</strong> the role <strong>of</strong> the authorities <strong>and</strong> water supply companies<br />
are discussed. GEUS is also involved in long-term monitor-<br />
© 2012 GEUS. <strong>Geological</strong> <strong>Survey</strong> <strong>of</strong> <strong>Denmark</strong> <strong>and</strong> Greenl<strong>and</strong> <strong>Bulletin</strong> <strong>26</strong>, 7–8. Open access: www.geus.dk/publications/bull<br />
7
ing <strong>of</strong> groundwater above the gas storage facility at Stenlille<br />
on Sjæll<strong>and</strong>. There has been no evidence <strong>of</strong> leakage through<br />
the geological barriers, <strong>and</strong> only one short incident with<br />
traces <strong>of</strong> gas from an injection well. Earthquake activity is<br />
low in an intra-plate region like <strong>Denmark</strong>, but prediction <strong>of</strong><br />
seismicity is important, <strong>and</strong> the question whether geological<br />
<strong>and</strong> geodetic observations should be included in the assessment<br />
is discussed.<br />
In 2011 there was a high level <strong>of</strong> field activities in Greenl<strong>and</strong><br />
with a major mapping <strong>and</strong> geochemical programme in<br />
South-East Greenl<strong>and</strong>, a large field <strong>and</strong> shallow-core drilling<br />
programme <strong>of</strong> poorly known Cretaceous sediments in<br />
North-East Greenl<strong>and</strong> <strong>and</strong> the EAGER cruise <strong>of</strong>fshore<br />
North-East Greenl<strong>and</strong>, which was part <strong>of</strong> the Danish Continental<br />
Shelf Project. Results from these large projects will<br />
be presented later; in this issue results from other completed<br />
<strong>and</strong> on-going projects are presented.<br />
This volume also contains a discussion <strong>of</strong> the possibility<br />
to use anorthosite from Greenl<strong>and</strong> as a future raw material<br />
for aluminium instead <strong>of</strong> bauxite. Based on regional knowledge<br />
<strong>and</strong> geochemical data, it is suggested that the Fiskenæsset<br />
complex is especially interesting. 3D mapping <strong>and</strong> modelling<br />
is high on the agenda in the new GEUS strategy in<br />
both <strong>Denmark</strong> <strong>and</strong> Greenl<strong>and</strong>. Different methods are used<br />
in the crystalline areas <strong>of</strong> Greenl<strong>and</strong>, for sedimentary basins<br />
or for Quaternary deposits in <strong>Denmark</strong>. A case study from<br />
the Skaergaard intrusion in southern East Greenl<strong>and</strong> is presented.<br />
In Greenl<strong>and</strong>, the Bureau <strong>of</strong> Minerals <strong>and</strong> Petroleum<br />
in Nuuk is preparing licensing rounds <strong>of</strong>fshore North-East<br />
Greenl<strong>and</strong> for 2012 <strong>and</strong> 2013, <strong>and</strong> part <strong>of</strong> the regional preparation<br />
for this work is described. There is a high level <strong>of</strong> exploration<br />
activities throughout the West Greenl<strong>and</strong> shelf<br />
in these years, <strong>and</strong> one paper brings a case study <strong>of</strong> bitumen<br />
from crystalline rocks in South Greenl<strong>and</strong>.<br />
Climate models predict a marked warming in the Arctic<br />
that may lead to the release <strong>of</strong> large amounts <strong>of</strong> methane<br />
bound in permafrost areas or in gas hydrates. The background<br />
<strong>of</strong> <strong>and</strong> some preliminary results from a scientific<br />
cruise to Disko Bugt in 2011 are related. The important<br />
monitoring programme <strong>of</strong> the Greenl<strong>and</strong> Ice Sheet (PROM-<br />
ICE) continues to develop, <strong>and</strong> a paper summarises the results<br />
<strong>of</strong> ablation observations from 2008 to 2011. GEUS<br />
takes part in operating many seismic stations in <strong>Denmark</strong> (5)<br />
<strong>and</strong> Greenl<strong>and</strong> (18), <strong>and</strong> it is very time-consuming to analyse<br />
all data manually. Test <strong>of</strong> an automatic method is described<br />
in another paper, <strong>and</strong> although the method is efficient, manual<br />
processing is still required to detect all earthquakes <strong>and</strong><br />
for quality control purposes.<br />
GEUS works in many different countries with many<br />
different types <strong>of</strong> projects. The last two papers in this issue<br />
are about Vietnam <strong>and</strong> Tanzania. GEUS has been active<br />
in Vietnam together with our sister organisation Vietnam<br />
Petroleum Institute <strong>and</strong> universities in Hanoi for almost<br />
twenty years. In Tanzania a Geocenter <strong>Denmark</strong> project has<br />
studied the possibilities <strong>of</strong> restoring soil fertility by using locally<br />
quarried rock phosphate <strong>and</strong> lime.<br />
8
Nano-quartz in North Sea Danian chalk<br />
Holger Lindgreen <strong>and</strong> Finn Jakobsen<br />
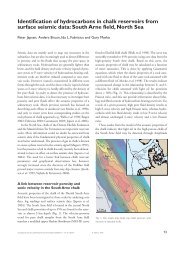
The main oil reservoir in the Central Graben in the North<br />
Sea is chalk <strong>of</strong> the Maastrichtian Tor Formation, which has<br />
high porosity <strong>and</strong> relatively high permeability. The chalk <strong>of</strong><br />
the Danian Ek<strong>of</strong>isk Formation is an additional reservoir, but<br />
with highly variable porosity <strong>and</strong> permeability. Whereas the<br />
Tor Formation is almost pure calcite primarily consisting <strong>of</strong><br />
coccolith debris, the Ek<strong>of</strong>isk Formation also comprises significant<br />
proportions <strong>of</strong> phyllosilicates (clay minerals) <strong>and</strong><br />
quartz in addition to coccolith debris. For decades the quartz<br />
was assumed to be a normal crystalline α-quartz such as is<br />
present in quartz s<strong>and</strong>, <strong>and</strong> the clay fraction was assumed to<br />
consist predominantly <strong>of</strong> phyllosilicates. However, Maliva<br />
& Dickson (1992) reported the presence <strong>of</strong> presumably authigenic<br />
submicron-size quartz crystals arranged in clusters,<br />
<strong>and</strong> suggested that these clusters were transformed opal-CT<br />
lepispheres. Investigations by nano-structural methods (Xray<br />
diffraction <strong>and</strong> atomic force microscopy (AFM)) revealed<br />
that the prevailing quartz component in the North Sea chalk<br />
comprises α-quartz appearing as nano-size quartz spheres<br />
(Jakobsen et al. 2000; Lindgreen et al. 2010). Nano-quartz<br />
spheres were first observed in indurated chalk in the Ek<strong>of</strong>isk<br />
Formation in the Ek<strong>of</strong>isk Field <strong>and</strong> later in the South Arne<br />
Field. Subsequent analyses <strong>of</strong> the Ek<strong>of</strong>isk Formation in different<br />
chalk fields showed that the content <strong>of</strong> nano-quartz<br />
varies throughout the chalk succession <strong>and</strong> to some degree<br />
reflects the cyclic development <strong>of</strong> the chalk. The proportion<br />
<strong>of</strong> dispersed nano-quartz in the chalk is highly variable, from<br />
10% to more than 80% in the Lower Danian (Lindgreen et<br />
al. 2010). This paper describes the nano-quartz, its formation<br />
<strong>and</strong> structure <strong>and</strong> presents a model for the formation <strong>of</strong><br />
flint from nano-quartz in the North Sea Ek<strong>of</strong>isk chalk.<br />
Scanning electron microscopy (SEM) is routinely used for<br />
investigations <strong>of</strong> chalk minerals <strong>and</strong> in special cases micronsized<br />
particles can be identified (Hjuler & Fabricius 2009).<br />
However, rock samples dominated by nano-sized quartz<br />
are at the limit <strong>of</strong> resolution in the SEM <strong>and</strong> generally give<br />
poor SEM images due to poor current transmission in the<br />
fine-grained matrix. We used X-ray diffraction <strong>and</strong> AFM<br />
to characterise the ultra-fine particles in the chalk, such as<br />
nano-quartz <strong>and</strong> clay minerals.<br />
X-ray diffraction scanning using 10 s/0.1 °2Θ was applied<br />
routinely to determine the mineralogical composition<br />
<strong>of</strong> both core piece samples <strong>and</strong> <strong>of</strong> non-calcite residues. High<br />
statistic scanning using 100 s/0.02 °2Θ was used to characterise<br />
the nano-quartz.<br />
AFM (Binnig et al. 1986) generates topographic images<br />
by scanning a sharp tip across a surface <strong>and</strong> can produce<br />
images at atomic resolution <strong>of</strong> both conductors <strong>and</strong> nonconductors.<br />
For AFM we used a Rasterscope 3000 instrument<br />
under room conditions with a force <strong>of</strong> 0.175 nN <strong>and</strong> a<br />
scanning speed <strong>of</strong> 500 nm/s. In the present investigation <strong>of</strong><br />
the topography <strong>of</strong> raw surfaces, AFM was run in non-contact<br />
25 km<br />
4°E<br />
Rigs-1<br />
SA-1<br />
Central<br />
Oil in chalk<br />
Gas in chalk<br />
Field at other level<br />
5°E<br />
Ringkøbing–Fyn High<br />
56°N<br />
Material <strong>and</strong> methods<br />
We have investigated core samples from the Ek<strong>of</strong>isk Formation<br />
in the South Arne Field wells SA-1 <strong>and</strong> Rigs-1, in the<br />
Halfdan Field wells Sif-1 <strong>and</strong> Nana-1 <strong>and</strong> in the Gorm Field<br />
well N-22 (Fig. 1). Most samples contained large amounts <strong>of</strong><br />
calcite, so calcite-free residues were prepared by dissolving<br />
the calcite in an acetate-acetic acid buffer at pH 4.5–5. In<br />
this buffer, non-calcite minerals <strong>and</strong> especially fine-grained<br />
nano-quartz <strong>and</strong> clay minerals are not corroded or dissolved.<br />
UK<br />
N<br />
NL<br />
G<br />
DK<br />
200 km<br />
Graben<br />
Sif-1<br />
N-22<br />
Nana-1<br />
National border<br />
Fig. 1. Map <strong>of</strong> the Danish Central Graben showing the locations <strong>of</strong> the<br />
investigated wells.<br />
© 2012 GEUS. <strong>Geological</strong> <strong>Survey</strong> <strong>of</strong> <strong>Denmark</strong> <strong>and</strong> Greenl<strong>and</strong> <strong>Bulletin</strong> <strong>26</strong>, 9–12. Open access: www.geus.dk/publications/bull<br />
9
A<br />
200 nm<br />
mode. Intact rock samples <strong>of</strong> small pieces <strong>of</strong> chalk or flint<br />
were glued onto gold-coated sample holders. In chalk samples,<br />
non-calcite minerals were identified <strong>and</strong> imaged from<br />
the insoluble residue. For such samples, the residue was dispersed<br />
ultrasonically in distilled water <strong>and</strong> the samples prepared<br />
by leaving a drop <strong>of</strong> the suspension to dry under room<br />
conditions on a block <strong>of</strong> highly oriented pyrolytic graphite.<br />
Structure <strong>of</strong> the nano-quartz particles<br />
AFM <strong>of</strong> non-calcite residues deposited on graphite showed<br />
that the nano-quartz consists predominantly <strong>of</strong> rather uniform,<br />
c. 600 Å large spherical particles (Fig. 2A). AFM images<br />
<strong>of</strong> intact flint surfaces showed that the flint consists <strong>of</strong><br />
similar spherical particles with a diameter <strong>of</strong> c. 500 Å or more<br />
B<br />
200 nm<br />
Fig. 2. Atomic force microscopy images <strong>of</strong> spherical grains <strong>of</strong> quartz. Noncontact<br />
mode, room conditions, force 0.175 nN, scanning speed 500 nm/s.<br />
A: Calcite-free residue deposited on graphite from well SA-1, 3344.15 m.<br />
B: Intact flint from Nana-1, 2135.7 m.<br />
(Fig. 2B) <strong>and</strong> some irregularly shaped particles. X-ray diffraction<br />
showed that the non-calcite residues <strong>and</strong> the flint <strong>and</strong><br />
quartz layers are composed <strong>of</strong> α-quartz having practically<br />
identical patterns <strong>and</strong> resembling the pattern <strong>of</strong> st<strong>and</strong>ard<br />
quartz (Fig. 3). It is remarkable that the quartz in all the examined<br />
samples <strong>of</strong> dispersed quartz <strong>and</strong> flint have almost<br />
identical unit cell a <strong>and</strong> c parameters <strong>and</strong> sizes <strong>of</strong> coherent<br />
scattering domains (Lindgreen et al. 2011).<br />
At high angles peak broadening was pronounced for<br />
the nano-quartz particles <strong>and</strong> careful recording revealed a<br />
broad <strong>and</strong> distorted pattern <strong>of</strong> the (212), (203) <strong>and</strong> (301) reflections<br />
compared to the reflection from st<strong>and</strong>ard quartz<br />
(Fig. 4). These distortions are due to larger a <strong>and</strong> c parameters<br />
compared to those <strong>of</strong> normal quartz (Lindgreen et al. 2011).<br />
The nano-quartz spheres had colloidal properties <strong>and</strong> flocculated<br />
in suspensions with sufficient ionic strength, such as<br />
sea water (Fig. 5).<br />
Formation <strong>of</strong> quartz particles<br />
The nano-quartz spheres are anticipated to be <strong>of</strong> a type that<br />
might crystallise in a marine environment which is slightly<br />
enriched in silicon (Williams & Crerar 1985). The source <strong>of</strong><br />
silicon was probably opal-A from radiolarians, which were<br />
the main silica-bearing organism in the chalk sea (Maliva<br />
& Dickson 1992). It is important that the non-crystalline<br />
Si in radiolarians will dissolve at the low concentration <strong>of</strong><br />
Si, which is sufficient to precipitate fine quartz, <strong>and</strong> that the<br />
quartz will be the first silica phase to crystallise.<br />
Si<br />
Si<br />
St<strong>and</strong>ard Merck quartz<br />
SA 3344.15 m quartz in matrix<br />
Nana 2135.7 m quartz in flint<br />
Si<br />
St<strong>and</strong>ard Merck quartz<br />
SA 3344.15 m quartz in matrix<br />
Nana 2135.7 m quartz in flint<br />
212α 1<br />
203α 1<br />
203α 2<br />
301α 1<br />
C<br />
A<br />
212α 2<br />
301α 2<br />
B<br />
B<br />
C<br />
A<br />
20 30 40 50 60 70 80 90<br />
°2Θ<br />
Fig. 3. A: X-ray diffraction pattern <strong>of</strong> st<strong>and</strong>ard Merck quartz. B: <strong>of</strong> calcitefree<br />
residue from chalk, South Arne Field, well SA-1, 3344.15 m, C: <strong>and</strong> <strong>of</strong><br />
flint layer in Halfdan Field, well Nana-1, 2135.7 m. Co-K α radiation, 5%<br />
Si added as internal st<strong>and</strong>ard.<br />
80 81<br />
°2Θ<br />
Fig. 4. X-ray diffraction patterns. A: Region <strong>of</strong> (212), (203) <strong>and</strong> (301) reflections<br />
<strong>of</strong> st<strong>and</strong>ard Merck quartz. B: The same region for calcite-free<br />
residue from chalk, South Arne Field, well SA-1, 3344.15 m. C: The same<br />
region for flint layer in Halfdan Field, well Nana-1, 2135.7 m. Co-K α radiation.<br />
82<br />
10
Dispersed in distilled water<br />
Dispersed in 0.2M CaCl2<br />
may be due to a decrease in pH which may cause coccoliths to<br />
be partly or totally dissolved in the water column.<br />
Such a decrease in pH requires significant amounts <strong>of</strong><br />
an acidifier. This acidifying agent was most probably atmospheric<br />
CO 2 , which by mixing with sea water has been found<br />
to decrease the calcification <strong>of</strong> marine plankton (Riebesell<br />
et al. 2000; Feely et al. 2004). CO 2 released in large quantities<br />
during volcanic eruptions (Holmes 1965; Zimmer &<br />
Erzinger 2003; Frondini et al. 2004; Schuiling 2004; Self et<br />
al. 2006) could be a cause <strong>of</strong> the dissolution <strong>of</strong> the coccoliths<br />
in parts <strong>of</strong> the Danian chalk deposits in the North Sea.<br />
Sensitivity analysis has indicated that only massive <strong>and</strong><br />
short-lived volcanism could cause the CaCO 3 undersaturation<br />
<strong>of</strong> seawater (Berner & Beerling 2007). Age determinations<br />
<strong>of</strong> lavas from the British Tertiary igneous province<br />
have yielded ages <strong>of</strong> 63–65 Ma (Saunders et al. 1997), corresponding<br />
to a Danian age. We therefore propose that the<br />
pronounced quartz enrichment in the Danian chalk <strong>of</strong> the<br />
North Sea was associated with frequent volcanic eruptions in<br />
this period at <strong>and</strong> after the Cretaceous–Tertiary boundary.<br />
Our model implicates that the degree <strong>of</strong> dissolution <strong>of</strong> the<br />
coccoliths in the sedimentary environment determines the<br />
proportion between calcite <strong>and</strong> nano-quartz in the chalk.<br />
Fig. 5. Flocculation <strong>of</strong> nano-quartz particles. Residue from well SA-1,<br />
3353.0 m. Left: quartz dispersed in distilled water. Right: quartz dispersed<br />
in 0.2 M CaCl 2 .<br />
Data from Williams et al. (1985) indicate that the c. 500<br />
Å diameter quartz spheres observed in the chalk <strong>and</strong> in the<br />
flint <strong>of</strong> the North Sea Danian chalk can form at SiO 2 concentrations<br />
<strong>of</strong> c. 12 ppm. The North Sea chalk is a deep water<br />
deposit <strong>and</strong> present-day deep sea water has a concentration<br />
<strong>of</strong> 1–10 ppm SiO 2 (Millot 1970; Calvert 1974). We think<br />
that only a minor increase in Si concentration would result in<br />
crystallisation <strong>of</strong> nano-quartz spheres. The colloidal quartz<br />
spheres could then have flocculated <strong>and</strong> been deposited on<br />
the sea floor mixed with coccolith ooze. Flocculation is important<br />
for sedimentation <strong>of</strong> silica <strong>and</strong> the rate <strong>of</strong> sedimentation<br />
for the formation <strong>of</strong> layers rich in quartz.<br />
Chemical environment in the<br />
water column<br />
As described above, we assume that silica was not deposited<br />
as biogenic opal-A. Therefore the variation in proportion<br />
<strong>of</strong> nano-quartz cannot be caused by changes in the supply<br />
<strong>of</strong> silicon to the sea as such changes would be reflected in<br />
changes in size <strong>and</strong> mineralogy <strong>of</strong> the silica. An alternative is<br />
variation in the sedimentation <strong>of</strong> coccoliths. Such variation<br />
Theories for flint formation<br />
The new theory for the formation <strong>of</strong> flint <strong>and</strong> dispersed nano-quartz<br />
in the North Sea by crystallisation <strong>of</strong> nano-quartz<br />
in the marine environment is totally different from the generally<br />
accepted theory for flint formation in chalk based on<br />
studies <strong>of</strong> chalk from onshore outcrops (Bromley & Ekdale<br />
1986; Clayton 1986; Zijlstra 1987; Madsen & Stemmerik<br />
2010). According to the current theory for flint formation,<br />
opaline tests <strong>and</strong> sponge spicules in the sediment are dissolved<br />
during burial <strong>and</strong> the Si is recrystallised as opal-CT<br />
<strong>and</strong> quartz in hollows <strong>and</strong> by replacement <strong>of</strong> calcite. However,<br />
the generally accepted theory does not agree with our<br />
results obtained for the silica in the investigated North Sea<br />
chalk. We support our point <strong>of</strong> view by observing that the<br />
type <strong>of</strong> α-quartz dispersed in chalk is identical with the type<br />
constituting the flint nodules <strong>and</strong> flint horizons <strong>and</strong> with<br />
the type constituting the α-quartz horizons in the chalk.<br />
We find it highly unlikely that the same size <strong>and</strong> shape <strong>of</strong><br />
particles will crystallise in the chalk <strong>and</strong> in the hollows during<br />
dissolution or reprecipitation, whereas the particles are<br />
<strong>of</strong> the type which can possibly crystallise in the marine environment<br />
that is slightly enriched in silicon (Williams &<br />
Crerar 1985). A sedimentary origin <strong>of</strong> the silica-rich chalk<br />
layers is supported by the presence <strong>of</strong> a flint bed in well<br />
N-22. The flint layer includes a calcite-filled burrow within<br />
11
a matrix comprising nano-quartz spheres. The occurrence <strong>of</strong><br />
a burrow in rather pure α-quartz sediment shows that the<br />
α-quartz was s<strong>of</strong>t when biological activity took place.<br />
A sedimentary origin <strong>of</strong> the flint fits well with our results<br />
for the North Sea Tertiary chalk, which is a deposit in relatively<br />
deep water. However, it cannot be generally applied to<br />
other areas <strong>and</strong> deposits in different settings without further<br />
investigations.<br />
Conclusions<br />
We have proposed a new model for the formation <strong>of</strong> flint in<br />
North Sea chalk: (1) The nano-quartz in the flint, like the<br />
nano-quartz in the chalk matrix, has crystallised in the marine<br />
chalk-sea environment. The colloidal quartz particles<br />
have then flocculated <strong>and</strong> have been deposited on the sea<br />
floor mixed with coccolith ooze. (2) Regional variations in<br />
the concentration <strong>of</strong> nano-quartz particles in the sediment<br />
reflect different degrees <strong>of</strong> acidification <strong>of</strong> the chalk sea. (3)<br />
This resulted in areas with a high concentration <strong>of</strong> nanoquartz<br />
spheres that could form flint layers. In areas with<br />
lower concentration <strong>of</strong> nano-quartz spheres, indurated chalk<br />
with abundant nano-quartz particles are now preserved. (4)<br />
The acidification may have been caused by enhanced atmospheric<br />
CO 2 linked to massive volcanic eruptions.<br />
References<br />
Berner R.A. & Beerling D.J. 2007: Volcanic degassing necessary to produce<br />
a CaCO 3<br />
undersaturated ocean at the Triassic–Jurassic boundary.<br />
Palaeogeography, Palaeoclimatology, Palaeoecology 244, 368–373.<br />
Binnig, G., Quate, C.F. & Gerber, Ch. 1986: Atomic force microscope.<br />
Physics Revue Letters 56, 930–933.<br />
Bromley R.G. & Ekdale, A.A. 1986: Flint <strong>and</strong> fabric in the European<br />
chalk. In: Sieveking, G.D.G. & Hart, M.B. (eds): The scientific study<br />
<strong>of</strong> flint <strong>and</strong> chert, 71–82. Cambridge: Cambridge University Press.<br />
Calvert S.E. 1974: Deposition <strong>and</strong> diagenesis <strong>of</strong> silica in marine sediments.<br />
International Association <strong>of</strong> Sedimentologists, Special Publication 1,<br />
273–300.<br />
Clayton C.J. 1986: The chemical environment <strong>of</strong> flint formation in Upper<br />
Cretaceous chalk. In: Sieveking, G.D.G. & Hart, M.B. (eds): The<br />
scientific study <strong>of</strong> flint <strong>and</strong> chert, 43–54. Cambridge: Cambridge University<br />
Press.<br />
Feely, R.A., Sabine C.L., Lee, K., Berelson, W., Kleypas, J., Fabry, V.J. &<br />
Millero, F. J. 2004: Impact <strong>of</strong> anthropogenic CO 2<br />
on the CaCO 3<br />
system<br />
in the oceans. Science 305, 362–366.<br />
Frondini, F., Chiodini, G., Caliro, S., Cardellini, C., Granieri, D. & Ventura,<br />
G. 2004: Diffuse CO 2<br />
degassing at Vesuvio, Italy. <strong>Bulletin</strong> <strong>of</strong> Volcanology<br />
66, 642–651.<br />
Hjuler, M.L. & Fabricius, I.L. 2009: Engineering properties <strong>of</strong> chalk related<br />
to diagenetic variations <strong>of</strong> Upper Cretaceous onshore <strong>and</strong> <strong>of</strong>fshore<br />
chalk in the North Sea area. Journal <strong>of</strong> Petroleum Science <strong>and</strong> Engineering<br />
68, 151-170.<br />
Holmes, A. 1965: Principles <strong>of</strong> physical geology, 1288 pp. London: Nelson.<br />
Jakobsen, F., Lindgreen, H. & Springer, N. 2000: Precipitation <strong>and</strong> flocculation<br />
<strong>of</strong> spherical nano silica in North Sea chalk. Clay Minerals 35,<br />
175–184.<br />
Lindgreen, H., Jakobsen, F. & Springer, N. 2010: Nano-size quartz accumulation<br />
in reservoir chalk, Ek<strong>of</strong>isk Formation, South Arne Field,<br />
North Sea. Clay Minerals 45, 171–182.<br />
Lindgreen, H., Drits, V.A., Salyn, A.L., Jakobsen, F. & Springer, N. 2011:<br />
Formation <strong>of</strong> flint horizons in North Sea chalk through marine sedimentation<br />
<strong>of</strong> nano-quartz. Clay Minerals 46, 525-537.<br />
Madsen, H.B. & Stemmerik, L. 2010: Diagenesis <strong>of</strong> flint <strong>and</strong> porcellanite<br />
in the Maastrichtian chalk at Stevns Klint, <strong>Denmark</strong>. Journal <strong>of</strong> Sedimentary<br />
Research 80, 578–588.<br />
Maliva, R.G. & Dickson, J.A.D. 1992: Micr<strong>of</strong>acies <strong>and</strong> diagenetic controls<br />
<strong>of</strong> porosity in Cretaceous/Tertiary chalks, Eldfisk Field, Norwegian<br />
North Sea. AAPG <strong>Bulletin</strong> 76, 1825–1838.<br />
Millot, G. 1970: Geology <strong>of</strong> clays, 429 pp. New York: Springer.<br />
Riebesell, U., Zondervan, I., Rost, B., Tortell, P.D., Zeebe, R.E. & Morel,<br />
F.M.M. 2000: Reduced calcification <strong>of</strong> marine plankton in response to<br />
increase atmospheric CO 2<br />
. Nature 407, 364–367.<br />
Saunders, A.D., Fitton, J.G., Kerr, A.C., Norry, M.J. & Kent, R.W. 1997:<br />
The North Atlantic Igneous Province. In: Mahoney, J.J. & C<strong>of</strong>fin,<br />
M.F. (eds): Large igneous provinces. Geophysical Monograph Series<br />
100, 45–97.<br />
Schuiling, R.D. 2004: Thermal effects <strong>of</strong> massive CO 2<br />
emissions associated<br />
with subduction volcanism. Comptes Rendus Geoscience 336,<br />
1053–1059.<br />
Self, S., Widdowson, M., Thordarson, T. & Jay, A.E. 2006: Volatile fluxes<br />
during flood basalt eruptions <strong>and</strong> potential effects on the global environment:<br />
a Deccan perspective. Earth <strong>and</strong> Planetary Science Letters<br />
248, 518–532.<br />
Williams, L.A. & Crerar, D.A. 1985: Silica diagenesis, II. General mechanisms.<br />
Journal <strong>of</strong> Sedimentary Petrology 55, 312–321.<br />
Williams, L.A., Parks, G.A. & Crerar, D.A. 1985: Silica diagenesis, I. Solubility<br />
controls. Journal <strong>of</strong> Sedimentary Petrology 55, 301–311.<br />
Zijlstra, H.J.P. 1987: Early diagenetic silica precipitation, in relation to redox<br />
boundaries <strong>and</strong> bacterial metabolism, in Late Cretaceous chalk <strong>of</strong><br />
the Maastrichtian type locality. Geologie en Mijnbouw 66, 343–355.<br />
Zimmer, M. & Erzinger, J. 2003: Continuous H 2<br />
O, CO 2<br />
, 222 Rn <strong>and</strong> temperature<br />
measurements on Merapi Volcano, Indonesia. Journal <strong>of</strong> Volcanology<br />
<strong>and</strong> Geothermal Research 125, 25–38.<br />
Authors’ address<br />
<strong>Geological</strong> <strong>Survey</strong> <strong>of</strong> <strong>Denmark</strong> <strong>and</strong> Greenl<strong>and</strong>, Øster Voldgade 10, DK-1350 Copenhagen K, <strong>Denmark</strong>. E-mail: hl@geus.dk<br />
12
Geology <strong>of</strong> the Femern Bælt area between <strong>Denmark</strong><br />
<strong>and</strong> Germany<br />
Emma Sheldon, Peter Gravesen <strong>and</strong> Henrik Nøhr-Hansen<br />
<strong>Geological</strong> <strong>and</strong> geotechnical investigations in the Femern<br />
Bælt area were undertaken from 1995 to 2010 (Rambøll<br />
Arup JV 2011) in preparation for the fixed link between Loll<strong>and</strong><br />
in <strong>Denmark</strong> <strong>and</strong> Fehmarn in Germany. As a result, new<br />
data have been acquired on the stratigraphy <strong>and</strong> distribution<br />
<strong>of</strong> the deposits <strong>and</strong> the major structures <strong>and</strong> tectonic influence<br />
on the layers close to the surface. Previous investigations<br />
<strong>of</strong> Cretaceous–Palaeogene deposits on southern Loll<strong>and</strong><br />
(Fig. 1) were limited due to lack <strong>of</strong> outcrops <strong>and</strong> borehole<br />
data. Two deep boreholes <strong>and</strong> geophysical surveys (1952–<br />
1953) revealed: (1) the presence <strong>of</strong> a salt diapir at Rødbyhavn,<br />
(2) upper Maastrichtian chalk 29–143 m below Quaternary<br />
deposits <strong>and</strong> (3) an erosional window in the Palaeogene cover.<br />
Boreholes to the east <strong>of</strong> Rødbyhavn (1992–1994) revealed<br />
the sediment distribution on southern Loll<strong>and</strong> <strong>and</strong> showed<br />
that Cretaceous <strong>and</strong> Palaeogene deposits are cut by several<br />
NW–SE-orientated faults. This paper presents a summary<br />
<strong>of</strong> lithostratigraphic <strong>and</strong> biostratigraphic investigations <strong>and</strong><br />
a brief description <strong>of</strong> the geological development in the area.<br />
Methods<br />
A multidisciplinary biostratigraphic study was undertaken<br />
<strong>of</strong> 170 samples from 46 wells drilled in 2009–2010 in the<br />
Femern Bælt region. The wells were drilled to depths <strong>of</strong> 50–<br />
100 m <strong>and</strong> were fully cored in the pre-Quaternary deposits.<br />
Norway<br />
55°<br />
Danish Basin<br />
<strong>Denmark</strong><br />
Ringkøbing–Fyn High<br />
German<br />
Basin<br />
Germany<br />
14°E<br />
Sweden<br />
100 km<br />
A<br />
57°N<br />
Femern<br />
Bælt<br />
Loll<strong>and</strong><br />
DGU 241.213<br />
Fehmarn<br />
Eocene<br />
Paleocene (without Danian)<br />
Danian<br />
Upper Cretaceous<br />
Rødbyhavn<br />
Fig. 1. A: Map <strong>of</strong> <strong>Denmark</strong> <strong>and</strong> northern Germany showing the proposed<br />
location <strong>of</strong> the fixed link across the Femern Bælt. B: <strong>Geological</strong> map <strong>of</strong> the<br />
Femern Bælt region (after Håkansson & Pedersen 1992).<br />
B<br />
One to ten samples from each well were selected for biostratigraphic<br />
analysis by Rambøll Arup JV. Nann<strong>of</strong>ossil analysis<br />
was carried out on all samples. Supplementary analyses were<br />
carried out using micr<strong>of</strong>ossils <strong>and</strong> din<strong>of</strong>lagellate cysts (dinocysts)<br />
when necessary. Nann<strong>of</strong>ossils are particularly useful<br />
for dating chalk <strong>and</strong> clay, micr<strong>of</strong>ossils for chalk, s<strong>and</strong> <strong>and</strong><br />
clay <strong>and</strong> dinocysts for clay. The use <strong>of</strong> three fossil groups allowed<br />
for well-constrained <strong>and</strong> reliable dating <strong>and</strong> formation<br />
identification (Sheldon & Nøhr-Hansen 2010). In addition,<br />
13 samples from DGU core 241.213, a water well from 2011<br />
on Loll<strong>and</strong>, were analysed.<br />
Biostratigraphy <strong>and</strong> lithostratigraphy<br />
A chronostratigraphic, biostratigraphic <strong>and</strong> lithostratigraphic<br />
correlation is presented in Fig. 2. The lithologies <strong>and</strong> selected<br />
marker fossils reported in this article are as follows (see<br />
also Fig. 3):<br />
Tor Formation equivalent (Campanian–Maastrichtian)<br />
– The Tor Formation <strong>of</strong> the North Sea was originally described<br />
by Deegan & Scull (1977) as homogeneous white or<br />
grey chalk, bioturbated pelagic chalk, laminated chalk <strong>and</strong><br />
redeposited chalk. The Femern Bælt area chalk is slightly indurated,<br />
with
Age (Ma)<br />
50<br />
55<br />
60<br />
Series<br />
Eocene<br />
Paleocene<br />
Berggren<br />
et al. (1995)<br />
Lower Middle<br />
Upper<br />
Lower<br />
Stage<br />
Lutetian<br />
49.0<br />
Ypresian<br />
54.5<br />
Sparnacian<br />
55.5<br />
Thanetian<br />
57.9<br />
Sel<strong>and</strong>ian<br />
60.0<br />
Danian<br />
St<strong>and</strong>ard<br />
biozones<br />
Martini<br />
(1971)<br />
Calcareous<br />
nann<strong>of</strong>ossils<br />
NP15<br />
(pars)<br />
NP14<br />
NP13<br />
NP12<br />
NP11<br />
NP10<br />
NP9<br />
NP8<br />
NP7<br />
NP6<br />
NP5<br />
NP4<br />
NP3<br />
NP2<br />
North Sea<br />
biozones<br />
Varol<br />
(1998)<br />
Burnett<br />
(1998)<br />
Calcareous<br />
nann<strong>of</strong>ossils<br />
NNTe 8<br />
(pars)<br />
NNTe 7<br />
6<br />
5<br />
4<br />
3<br />
NNTe 2<br />
NNTe 1<br />
NOT ZONED<br />
NNTp 10<br />
NNTp 9<br />
8<br />
7<br />
6<br />
5<br />
NNTp 4<br />
NNTp 3<br />
NNTp 2<br />
Chronostratigraphy<br />
Lithostrat.<br />
<strong>Denmark</strong><br />
onshore<br />
Lillebælt<br />
Clay Fm<br />
L2<br />
L1<br />
R6<br />
Røsnæs<br />
Clay Røsnæs Fm<br />
Clay R5/R6 Fm<br />
R5/R4<br />
R1 D7a<br />
Knudsh. Mb. D6a / D6b<br />
Fur Ølst<br />
Fm Fm<br />
Stolle<br />
Klint Clay<br />
Østerrende<br />
Clay<br />
Holmehus<br />
Fm<br />
Æbelø<br />
Fm<br />
Kerteminde<br />
Marl<br />
Lellinge<br />
Greens<strong>and</strong><br />
Danish<br />
biozones<br />
Heilmann-<br />
Clausen &<br />
Costa (1989)<br />
upper D9<br />
lower D9<br />
D8<br />
D7b<br />
D5b<br />
D5a<br />
D4<br />
Danian<br />
Limestone<br />
Heilmann-<br />
Clausen (1985)<br />
Din<strong>of</strong>lagellate<br />
cysts<br />
Viborg<br />
zone 7<br />
Viborg<br />
zone 6<br />
Viborg<br />
zone 5<br />
Viborg<br />
zone 4<br />
Viborg<br />
zone 3<br />
Viborg<br />
zone 2<br />
rina edita, Globoconusa daubjergensis <strong>and</strong> Cibicidoides succedens<br />
(foraminifera).<br />
Lellinge Greens<strong>and</strong> (lower Sel<strong>and</strong>ian) – In DGU core<br />
241.213, Lellinge Greens<strong>and</strong> (originally described by Gry<br />
1935) comprises olive-grey, glauconitic, s<strong>and</strong>y, hard limestone<br />
intercalated with fine-grained clay with brown phosphate<br />
nodules <strong>and</strong> pyrite. Lellinge Greens<strong>and</strong> is also encountered<br />
in a number <strong>of</strong> Femern Bælt boreholes.<br />
Biostratigraphic marker fossils: common Neochiastozygus<br />
perfectus <strong>and</strong> Prinsius martinii (nann<strong>of</strong>ossils), Globanomalina<br />
ehrenbergi, Bulimina trigonalis (common) <strong>and</strong> Gavelinella<br />
danica (foraminifera) with reworked Danian <strong>and</strong> Upper<br />
Cretaceous nanno- <strong>and</strong> micr<strong>of</strong>ossils (Danian limestone <strong>and</strong><br />
Tor Formation equivalent) <strong>and</strong> macr<strong>of</strong>ossil debris.<br />
Æbelø Formation (middle Sel<strong>and</strong>ian) – The Æbelø Formation<br />
(Heilmann-Clausen et al. 1985) comprises slightly calcareous<br />
to non-calcareous, silty – very silty, grey clay.<br />
Biostratigraphic marker fossils: Chiasmolithus edentulus,<br />
Chiasmolithus eogr<strong>and</strong>is (nann<strong>of</strong>ossils), Isabelidinium? viborgense<br />
<strong>and</strong> Palaeoperidinium pyrophorum (dinocysts).<br />
Holmehus Formation (Sel<strong>and</strong>ian–Thanetian) – The Holmehus<br />
Formation (Heilmann-Clausen et al. 1985) consists <strong>of</strong><br />
non-calcareous, greenish, brownish <strong>and</strong> reddish, very finegrained<br />
clay with minor s<strong>and</strong> <strong>and</strong> phosphatic or sideritic<br />
concretions.<br />
Biostratigraphic marker fossils: Transversopontis pulcheroides,<br />
Zygodiscus adamas, Neococcolithes protenus (nann<strong>of</strong>ossils),<br />
Cyclammina amplectens, (foraminifera), Alisocysta sp. 1<br />
Heilmann-Clausen 1985 <strong>and</strong> Cerodinium medcalfii (dinocysts).<br />
Ølst Formation (lower Ypresian) – The Ølst Formation<br />
(Heilmann-Clausen et al. 1985) is a grey to almost black,<br />
s<strong>and</strong>y, silty <strong>and</strong> mainly non-calcareous clay, interbedded<br />
with layers <strong>and</strong> laminae <strong>of</strong> black or grey volcanic ash.<br />
Biostratigraphic marker fossils: Sphenolithus editus, Tribrachiatus<br />
orthostylus, Lophodolithus nascens (nann<strong>of</strong>ossils),<br />
Fenestrella antiqua, Coscinodiscus morsianus moelleri, Triceratium<br />
spp. (diatoms), Apectodinium hyperacanthum <strong>and</strong><br />
Defl<strong>and</strong>rea oebisfeldensis (dinocysts).<br />
65 65.0<br />
Campanian/<br />
Maastrichtian<br />
Cret.<br />
U.<br />
NP1<br />
NNTp 1<br />
UC16–20<br />
Tor Fm<br />
equiv.<br />
Fig. 2. Chrono-, bio- <strong>and</strong> lithostratigraphy <strong>of</strong> the Campanian–Eocene in<br />
<strong>Denmark</strong>. Note, not all formations have been found in the investigated<br />
area.<br />
Røsnæs Clay Formation (middle Ypresian) – The Røsnæs<br />
Clay Formation (Dinesen et al. 1977; Heilmann-Clausen et<br />
al. 1985) comprises red, brown <strong>and</strong> yellow-brown, very finegrained,<br />
plastic marine clay with glauconitic beds at the base<br />
<strong>and</strong> greenish volcanic ash layers throughout.<br />
14
Biostratigraphic marker fossils: Discoaster kuepperi, Imperiaster<br />
obscurus, Toweius occulatus, Rhabdosphaera pinguis,<br />
Discoaster lodoensis (nann<strong>of</strong>ossils), Turrilina brevispira,<br />
Clavulina anglica, Pseudohastigerina wilcoxensis, Gaudryina<br />
hiltermanni, Subbotina patagonica (foraminifera), Dracodinium?<br />
condylos, Ochetodinium romanum, Wetzeliella astra,<br />
Dracodinium solidum, Eatonicysta ursulae <strong>and</strong> Dracodinium<br />
varielongitudum (dinocysts).<br />
Lillebælt Clay Formation (upper Ypresian – lower Lutetian)<br />
– The Lillebælt Clay Formation is a green-grey, non-calcareous,<br />
very fine-grained plastic clay containing concretions,<br />
with red-brown clay beds in the lower part (Dinesen et al.<br />
1977; Heilmann-Clausen et al. 1985).<br />
Biostratigraphic marker fossils: Vaginulinopsis decoratus<br />
(foraminifera), Membranilarnacia compressa, Charlesdowniea<br />
columna <strong>and</strong> Eatonicysta furensis (dinocysts).<br />
<strong>and</strong> erosion dominated again during the late early Sel<strong>and</strong>ian.<br />
These two erosional episodes may have resulted in sediment<br />
removal, but it is also possible that the area was subaerial<br />
during part <strong>of</strong> the Danian–Sel<strong>and</strong>ian. Continued erosion or<br />
nondeposition characterised the upper Sel<strong>and</strong>ian <strong>and</strong> therefore<br />
deposits from the Kerteminde Marl Formation (up to<br />
100 m thick on Sjæll<strong>and</strong>) are not found in the area, probably<br />
due to uplift during this time.<br />
Clastic marine sedimentation resumed during the upper<br />
Sel<strong>and</strong>ian sea-level rise, <strong>and</strong> the North Sea, <strong>Denmark</strong><br />
A B C D<br />
5 μm 5 μm<br />
5 μm<br />
E F G H<br />
5 μm<br />
<strong>Geological</strong> development<br />
Loll<strong>and</strong> is located to the south <strong>of</strong> the Ringkøbing–Fyn High,<br />
in the German Basin. During the Late Cretaceaous, fully<br />
marine conditions characterised the Danish area including<br />
the northern highs <strong>and</strong> chalk <strong>of</strong> the Campanian – upper<br />
Maastrichtian Tor Formation equivalent was deposited. Danian<br />
limestone <strong>and</strong> Lellinge Greens<strong>and</strong> have recently been<br />
found in situ on southern Loll<strong>and</strong> <strong>and</strong> are documented here<br />
for the first time. The Danian limestone is c. 2 m thick. Danian<br />
nann<strong>of</strong>osssils <strong>and</strong> micr<strong>of</strong>ossils are also found in small<br />
limestone clasts within the Sel<strong>and</strong>ian deposits, indicating<br />
that Danian sediments were eroded <strong>and</strong> partially redeposited<br />
at the end <strong>of</strong> the Danian <strong>and</strong> probably also in the earliest<br />
Sel<strong>and</strong>ian.<br />
The lower Sel<strong>and</strong>ian glauconitic <strong>and</strong> conglomeratic deposits<br />
<strong>of</strong> the Lellinge Greens<strong>and</strong> rest on Danian sediments<br />
on Sjæll<strong>and</strong>, especially in the Copenhagen area (Stouge et al.<br />
2000). Clasts, micr<strong>of</strong>ossils <strong>and</strong> nann<strong>of</strong>ossils from the lower<br />
Sel<strong>and</strong>ian also indicate deposits from the Lellinge Greens<strong>and</strong><br />
in the Femern Bælt area. The Lellinge Greens<strong>and</strong> is at least<br />
12–13 m thick; the top is eroded <strong>and</strong> covered by Quaternary<br />
deposits. In DGU core 241.213 the Lellinge Greens<strong>and</strong> is<br />
found 138 m below ground surface. The encountered glauconitic<br />
deposits from the Lelllinge Greens<strong>and</strong> rest on Danian<br />
limestone in a small subsided fault block, demonstrating that<br />
the lowermost Sel<strong>and</strong>ian was probably deposited in the area<br />
<strong>and</strong> subsequently eroded.<br />
The early–middle Paleocene sea was more restricted than<br />
in the Cretaceous <strong>and</strong> several highs bordered the marine<br />
area (Clausen & Huuse 2002). The Danian was dominated<br />
by erosion, rising sea level characterised the early Sel<strong>and</strong>ian<br />
5 μm<br />
I J K L M<br />
0.2 mm<br />
N O P Q R S<br />
T U V W 20 μm X<br />
20 μm 20 μm<br />
0.2 mm 0.5 mm<br />
10 μm 5 μm 5 μm<br />
20 μm<br />
Y 20 μm Z Æ 20 μm Ø Å<br />
20 μm 20 μm<br />
0.2 mm 0.2 mm<br />
0.2 mm 0.2 mm 0.2 mm 0.2 mm 0.2 mm 0.2 mm<br />
20 μm<br />
20 μm<br />
Fig. 3. Selected important nann<strong>of</strong>ossils (A–H), micr<strong>of</strong>ossils (I–S) <strong>and</strong><br />
dinocysts (T–Å). A: Discoaster kuepperi, B: Tribrachiatus orthostylus, C:<br />
Lophodolithus nascens, D: Neococcolithes protenus, E: Toweius occulatus, F:<br />
Imperiaster obscurus, G: Eiffellithus turriseiffelii, H: Prediscosphaera spinosa,<br />
I: Subbotina patagonica, J: Clavulina anglica, K: Gaudryina hiltermanni,<br />
L: Fenestrella antiqua, M: Coscinodiscus morsianus moelleri, N:<br />
Triceratium spp., O: Bolivina incrassata, P: Bolivinoides laevigatus, Q:<br />
Reusella szajnochae szajnochae, R: Stensioeina pommerana, S: Praebulimina<br />
levis, T: Eatonicysta furensis, U: Dracodinium? condylos, V: Ochetodinium<br />
romanum, W: Apectodinium hyperacanthum, X: Defl<strong>and</strong>rea oebisfeldensis,<br />
Y: Cerodinium medcalfii, Z: Isabelidinium? viborgense, Æ: Cannosphaeropsis<br />
utinensis, Ø: Xenascus wetzelii, Å: Palaeoperidinium pyrophorum.<br />
15
m<br />
0<br />
50<br />
100<br />
150<br />
Fehmarn<br />
Quaternary deposits<br />
Folded <strong>and</strong> faulted Palaeogene clays<br />
Loll<strong>and</strong><br />
3 km<br />
Palaeogene formations<br />
Cretaceous<br />
Fig. 4. Simplified geological cross-section across the Femern Bælt. The folding<br />
shown in the Palaeogene clay is for illustrative purposes only; the real<br />
nature <strong>of</strong> the disturbance (folding <strong>and</strong> faulting) is much more intense <strong>and</strong><br />
complicated than shown (modified after Rambøll Arup JV 2011).<br />
<strong>and</strong> the German Basin formed a partly enclosed shelf area.<br />
The remainder <strong>of</strong> the Palaeogene (Æbelø, Holmehus, Ølst,<br />
Røsnæs Clay <strong>and</strong> Lillebælt Clay) formations mainly consist<br />
<strong>of</strong> fine-grained, plastic clay but there were many lithological<br />
shifts during this time. Deposition occurred in a relatively<br />
deep marine basin, although proximal to the shore. The<br />
changes in depositional conditions were related to changing<br />
circulation patterns in the North Sea <strong>and</strong> shifts in clay mineral<br />
provenance <strong>and</strong> periods <strong>of</strong> regression <strong>and</strong> non-deposition also<br />
occurred (Heilmann-Clausen et al. 1985). Intense volcanic activity<br />
caused by the opening <strong>of</strong> the North Atlantic resulted in<br />
ash deposition during the late Paleocene <strong>and</strong> Eocene.<br />
Quaternary glacial activity eroded, faulted <strong>and</strong> folded the<br />
Palaeogene sediments resulting in their present distribution<br />
(Fig. 4). The new biostratigraphic studies indicate that the<br />
Røsnæs Clay Formation is strongly folded with repeated stratigraphy,<br />
indicating movements along faults. The youngest<br />
formation in the area, the Lillebælt Clay Formation, occurs<br />
only as floes in the glacial sediments. On l<strong>and</strong>, the Palaeogene<br />
clay seems to be undisturbed towards the north whereas<br />
disturbances increase towards the south.<br />
Conclusions<br />
The recent biostratigraphic study has provided important<br />
information about the pre-Quaternary deposits under the c.<br />
18 km wide Femern Bælt, imperative to planning the construction<br />
<strong>of</strong> the Femern Bælt fixed link. The Cretaceous–<br />
Palaeogene Tor Formation equivalent, Danian limestone,<br />
Lellinge Greens<strong>and</strong>, Æbelø, Holmehus, Ølst, Røsnæs <strong>and</strong><br />
Lillebælt Formations have been identified in multiple boreholes<br />
using multidisciplinary biostratigraphy. This information,<br />
coupled with physical rock properties (Rambøll Arup<br />
JV 2011) allows a geological cross-section <strong>of</strong> the Femern<br />
Bælt to be established <strong>and</strong> demonstrates the complex nature<br />
<strong>of</strong> the depositional <strong>and</strong> structural history <strong>of</strong> the area. In<br />
addition, in situ Danian limestone has been discovered for<br />
the first time, along with Lellinge Greens<strong>and</strong> on Loll<strong>and</strong> in<br />
DGU core 241.213. The new data from >500 m fully cored<br />
boreholes provide an excellent basis for future detailed biostratigraphic,<br />
sedimentological <strong>and</strong> basin analysis <strong>of</strong> the Palaeogene<br />
deposits in the area.<br />
References<br />
Berggren, W.A., Kent, D.V., Swischer III, C.C. & Aubry, M.-P. 1995: A<br />
revised Cenozoic geochronology <strong>and</strong> chronostratigraphy. In: Berggren,<br />
W.A. et al. (eds): Geochronology, time scale <strong>and</strong> global stratigraphic<br />
correlation. Society for Sedimentary Geology (SEPM) Special Publication<br />
54, 129–212.<br />
Burnett, J.A. 1998: Upper Cretaceous. In: Bown, P.R. (ed.): Calcareous nann<strong>of</strong>ossil<br />
biostratigraphy. British Micropalaeontological Society Series,<br />
132–199.<br />
Clausen, O.R. & Huuse, M. 2002: Mid-Paleocene palaeogeograhpy <strong>of</strong> the<br />
Danish area. <strong>Bulletin</strong> <strong>of</strong> the Geologocal Society <strong>of</strong> <strong>Denmark</strong> 49, 171–186.<br />
Deegan, C.E. & Scull, B.J. 1977: A st<strong>and</strong>ard lithostratigraphical nomenclature<br />
for the central <strong>and</strong> northern North Sea. The Institute <strong>of</strong> <strong>Geological</strong><br />
Sciences Report 77/25, 36 pp.<br />
Dinesen, A., Michelsen, O. & Lieberkind, K. 1977: A survey <strong>of</strong> the Paleocene<br />
<strong>and</strong> Eocene deposits <strong>of</strong> Jyll<strong>and</strong> <strong>and</strong> Fyn. Danmarks Geologiske<br />
Undersøgelse Serie B1, 15 pp.<br />
Gry, H. 1935: Petrology <strong>of</strong> the Paleocene sedimentary rocks <strong>of</strong> <strong>Denmark</strong>.<br />
Danmarks Geologiske Undersøgelse II. Række 61, 180 pp.<br />
Heilmann-Clausen, C. 1985: Din<strong>of</strong>lagellate stratigraphy <strong>of</strong> the uppermost<br />
Danian to Ypresian in the Viborg 1 borehole, central Jyll<strong>and</strong>,<br />
<strong>Denmark</strong>. Danmarks Geologiske Undersøgelse Serie A7, 69 pp.<br />
Heilmann-Clausen, C., Nielsen, O.B. & Gersner, F. 1985: Lithostratigraphy<br />
<strong>and</strong> depositional environments in the Upper Paleocene <strong>and</strong> Eocene <strong>of</strong><br />
<strong>Denmark</strong>. <strong>Bulletin</strong> <strong>of</strong> the <strong>Geological</strong> Society <strong>of</strong> <strong>Denmark</strong> 33, 287–323.<br />
Heilmann-Clausen, C. & Costa, L.I. 1989: Din<strong>of</strong>lagellate Zonation <strong>of</strong> the<br />
Uppermost Paleocene? to lower Miocene in the Würsterheide Research<br />
Well, northwest Germany. Geologisches Jahrbuch A111, 431–521.<br />
Håkansson, E., & Pedersen, S.S. 1992: Kort over den danske undergrund.<br />
København: Varv (map sheet).<br />
Martini, E. 1971: St<strong>and</strong>ard Tertiary <strong>and</strong> Quaternary calcareous nannoplankton<br />
zonation. In: Farinacci, A. (ed.): Proceedings <strong>of</strong> the Second<br />
Planktonic Conference Roma. Edizioni Tecnoscienza, Rome 2, 739–785.<br />
Rambøll Arup JV 2011: Summary <strong>of</strong> geological conditions. Geotechnical<br />
Data Report 01.3-002, 53 pp. Virum: Femern A/S.<br />
Sheldon, E. & Nøhr-Hansen, H. 2010: Fehmarn Belt fixed link pre-Quaternary<br />
biostratigraphy – a final status report for Rambøll Arup Joint<br />
Venture. Danmarks og Grønl<strong>and</strong>s Geologiske Undersøgelse Rapport<br />
2010/134, 53 pp.<br />
Stouge, S., Hjortkjær, B.F., Rasmussen, J.A., Roncaglia, L. & Sheldon, E.<br />
2000: Micro- <strong>and</strong> nann<strong>of</strong>ossil biostratigraphy across the Danian/Sel<strong>and</strong>ian<br />
(Paleocene) stage boundary at Gemmas Allé, Copenhagen, <strong>Denmark</strong>.<br />
GFF 122, 161–162. Stockholm: <strong>Geological</strong> Society <strong>of</strong> Sweden.<br />
Varol, O. 1998: Palaeogene. In: Bown, P.R. (ed.): Calcareous Nann<strong>of</strong>ossil<br />
Biostratigraphy. British Micropalaeontological Society Series, 200–224.<br />
Authors’ address<br />
<strong>Geological</strong> <strong>Survey</strong> <strong>of</strong> <strong>Denmark</strong> <strong>and</strong> Greenl<strong>and</strong>, Øster Voldgade 10, DK-1350 Copenhagen K, <strong>Denmark</strong>. E-mail: es@geus.dk<br />
16
Rock-cored drumlins on Bornholm, <strong>Denmark</strong><br />
Peter Roll Jakobsen<br />
The surface morphology <strong>of</strong> <strong>Denmark</strong> is predominantly <strong>of</strong><br />
glacial origin, created in depositional, deformational <strong>and</strong> erosional<br />
environments. In addition, postglacial marine, freshwater<br />
<strong>and</strong> aeolian processes have formed a variety <strong>of</strong> l<strong>and</strong>forms.<br />
Overviews <strong>of</strong> the Danish l<strong>and</strong>scape were published as<br />
geomorphological maps (Milthers 1948; Schou 1949; Smed<br />
1981), <strong>and</strong> a new one is currently in preparation. On Bornholm,<br />
the morphology differs from the rest <strong>of</strong> the country<br />
because bedrock is present at or near the surface. This paper<br />
describes drumlins formed on bedrock on Bornholm, which<br />
have not previously been recognised.<br />
New geomorphological map <strong>of</strong> <strong>Denmark</strong><br />
1:200 000<br />
The purpose is to create a map based on the Geographical<br />
Information Systems (GIS). To draw the boundaries <strong>of</strong> the<br />
different l<strong>and</strong>form types as precisely as possible, the morphology<br />
was re-interpreted on the basis <strong>of</strong> topographical<br />
maps, LiDAR (light detection <strong>and</strong> ranging) data, geological<br />
maps as well as available literature. The scale <strong>of</strong> the new<br />
map is 1:200 000, but it is compiled at 1:100 000 <strong>and</strong> will<br />
be published in both a printed <strong>and</strong> a digital version, the former<br />
in four map sheets (Jacobsen in press): (1) northern Jyll<strong>and</strong>,<br />
(2) central Jyll<strong>and</strong>, (3) southern Jyll<strong>and</strong> <strong>and</strong> Fyn <strong>and</strong><br />
(4) Sjæll<strong>and</strong>, surrounding isl<strong>and</strong>s <strong>and</strong> Bornholm. So far, a<br />
preliminary version <strong>of</strong> southern Jyll<strong>and</strong> has been published<br />
(Gravesen et al. 2004), <strong>and</strong> the map sheet covering Sjæll<strong>and</strong>,<br />
the surrounding isl<strong>and</strong>s <strong>and</strong> Bornholm is completed.<br />
Most <strong>of</strong> the surface features have already been described<br />
(Milthers 1948; Schou 1949; Smed 1981). However, the<br />
morphological elements shown on these maps vary to some<br />
degree. The new geomorphological map <strong>of</strong> <strong>Denmark</strong> also<br />
differs significantly from older maps, <strong>and</strong> some surface elements<br />
are re-interpreted. New elements include mega-scale<br />
glacial lineations <strong>and</strong> Rogen moraines, <strong>and</strong> on Loll<strong>and</strong> a valley<br />
formerly classified as a tunnel valley is re-interpreted as a<br />
fracture valley.<br />
Bornholm<br />
Large parts <strong>of</strong> Bornholm consist <strong>of</strong> pre-Quaternary crystalline<br />
bedrock with a discontinuous, thin cover <strong>of</strong> Quaternary<br />
sediments <strong>and</strong> is classified as glacially scoured bedrock on<br />
the geomorphological map (Fig. 1). During the Quaternary<br />
glaciations, the bedrock was affected by overriding glaciers.<br />
It mainly shows erosional features such as fracture valleys<br />
<strong>and</strong> mega-scale glacial lineations, but also smaller features,<br />
not shown on the map, such as roches moutonnées <strong>and</strong> glacial<br />
striae (Grönwall & Milthers 1916; Gravesen 1996).<br />
One <strong>of</strong> the most pronounced terrain features on Bornholm<br />
is fracture valleys, which are subglacially eroded faults<br />
<strong>and</strong> fracture zones within the basement rocks. These valleys<br />
outline the fault systems from multiple deformation phases<br />
in the Sorgenfrei–Tornquist Zone (Grönwall & Milthers<br />
1916; Graversen 2009). The main orientations <strong>of</strong> the fracture<br />
valleys are N–S, NNE–SSW <strong>and</strong> NE–SW. A few are<br />
oriented NW–SE.<br />
On Bornholm, the orientations <strong>of</strong> glacial striae show<br />
two general directions: NE–SW <strong>and</strong> ESE–WNW (Fig. 2;<br />
Grönwall & Milthers 1916). Mega-scale glacial lineations<br />
within the glacially scoured bedrock terrain are parallel with<br />
the measured glacial striae, <strong>and</strong> most <strong>of</strong> them are oriented<br />
NE–SW.<br />
In general, the two populations <strong>of</strong> glacial striae on Bornholm<br />
occur in two different groups <strong>of</strong> pre-Quaternary rocks.<br />
In the southern part <strong>of</strong> Bornholm, the pre-Quaternary geology<br />
is dominated by s<strong>and</strong>stone, shale <strong>and</strong> unconsolidated<br />
or poorly consolidated sediments, which are s<strong>of</strong>ter than the<br />
granites <strong>and</strong> gneisses in the rest <strong>of</strong> the isl<strong>and</strong>. The southern<br />
part <strong>of</strong> Bornholm is dominated by a till plain. Mega-lineations<br />
in this till plain show a slightly curved ESE–WNW<br />
trend <strong>and</strong> are parallel to the dominant orientation <strong>of</strong> glacial<br />
striae in the area (Figs 1, 2).<br />
Marginal moraines are not as distinct as in other parts<br />
<strong>of</strong> <strong>Denmark</strong>. They occur as scattered s<strong>and</strong>y <strong>and</strong> gravelly<br />
hills, <strong>and</strong> outline three ice marginal stages in the central <strong>and</strong><br />
northern parts <strong>of</strong> Bornholm (Fig. 2). A N–S-trending ridge<br />
in the south-eastern part <strong>of</strong> Bornholm, associated with a<br />
kame, is also interpreted as a marginal moraine (Fig. 1). It is<br />
a low ridge that separates a till plain with mega-lineations to<br />
the west from a smooth till plain to the east. A few small outwash<br />
plains are found in south-western Bornholm. Raised<br />
beaches <strong>and</strong> beach ridges from the Baltic Ice Lake are found<br />
along the coast at different levels, especially towards the east<br />
<strong>and</strong> north (Fig. 1).<br />
© 2012 GEUS. <strong>Geological</strong> <strong>Survey</strong> <strong>of</strong> <strong>Denmark</strong> <strong>and</strong> Greenl<strong>and</strong> <strong>Bulletin</strong> <strong>26</strong>, 17–20. Open access: www.geus.dk/publications/bull<br />
17
Rock-cored drumlins<br />
In the northernmost part <strong>of</strong> Bornholm, within the glacially<br />
scoured bedrock terrain, there are ten elongated hills with<br />
typical drumlin shapes (Figs 1, 3). Drumlins are subglacial<br />
bedforms that were generated by the activity <strong>of</strong> overriding<br />
ice. Drumlins are oval-shaped hills that formed beneath an<br />
ice sheet <strong>and</strong> aligned in the direction <strong>of</strong> ice flow, <strong>and</strong> they<br />
are common <strong>and</strong> widespread in formerly glaciated regions.<br />
The formation <strong>of</strong> drumlins has been widely discussed, <strong>and</strong><br />
they are one <strong>of</strong> the most studied glacial l<strong>and</strong>forms on Earth<br />
(Clark et al. 2009; Johnson et al. 2010). On Bornholm, Li-<br />
DAR data have been invaluable in recognising these features<br />
(Fig. 3). Like other drumlins, those on Bornholm are oval,<br />
<strong>and</strong> the surface has smooth contours with gradual fall to all<br />
14°58´E<br />
10° 14°E<br />
57°N<br />
Sweden<br />
55°15´N<br />
55°15´N<br />
Jyll<strong>and</strong><br />
<strong>Denmark</strong><br />
56°<br />
Fyn<br />
Sjæll<strong>and</strong><br />
Bornholm<br />
Germany<br />
50 km<br />
Till plain<br />
Drumlin<br />
Esker<br />
Mega-scale glacial lineation<br />
Kame<br />
Marginal moraine<br />
Outwash plain<br />
Glacial lake plain<br />
Valley system<br />
Bog<br />
Fracture valley<br />
Glacially scoured bedrock<br />
Raised beach plain (Baltic Ice Lake)<br />
Raised beach ridge (Baltic Ice Lake)<br />
Marine plain<br />
Beach ridge<br />
Dune<br />
Aeolian plain<br />
Township<br />
5 km<br />
14°58´E<br />
Fig. 1. Geomorphological map <strong>of</strong> Bornholm.<br />
18
N<br />
50 km<br />
Pre-Quaternary geology<br />
Granite <strong>and</strong> gneiss<br />
S<strong>and</strong>stone, shale <strong>and</strong> sediments<br />
Ice marginal stage<br />
Glacial striae<br />
Fig. 2. Map <strong>of</strong> Bornholm showing orientation <strong>of</strong> glacial striae on bedrock,<br />
the distribution <strong>of</strong> crystalline <strong>and</strong> sedimentary bedrock types <strong>and</strong> ice marginal<br />
stages (after Grönwall & Milthers 1916; Hansen & Poulsen 1977).<br />
sides. The length <strong>of</strong> the drumlins varies from 140 m to a little<br />
more than 600 m <strong>and</strong> their heights from 5 m to 31 m (Table<br />
1). Their length to width ratio varies from 1.6 to 2.9 with<br />
an average <strong>of</strong> 2.3. The orientation <strong>of</strong> the hills is NE–SW,<br />
with an average <strong>of</strong> 50°.<br />
The drumlins have a core <strong>of</strong> granite <strong>and</strong> are more or less<br />
covered by till (Fig. 3) that has predominantly been deposited<br />
towards the south-west on the lee side <strong>of</strong> the drumlins. The<br />
ice movement direction, indicated by glacial striae, is from<br />
the north-east (Grönwall & Milthers 1916), <strong>and</strong> the till cover<br />
is thickest on the south-western lee side <strong>of</strong> the drumlins.<br />
Table 1. Dimensions <strong>of</strong> the drumlins on Bornholm<br />
Number/ Length Width Height L:W Orientation<br />
Name (m) (m) (m) ratio (°)<br />
1 Langebjerg 612 211 31 2.9 60<br />
2 Kælderbakke 140 67 7 2.1 65<br />
3 Høje Meder 177 102 25 1.7 46<br />
4 Kajbjerg 332 160 10 2.1 48<br />
5 Byggehøj 532 205 8 2.6 46<br />
6 Hestenshøj 330 145 10 2.3 56<br />
7 Blåholtshus 395 137 10 2.9 51<br />
8 Brogård 225 98 5 2.3 47<br />
9 Blåholtsgård 391 148 10 2.6 43<br />
10 Hammershus 389 239 25 1.6 39<br />
Discussion<br />
In the northern part <strong>of</strong> Bornholm, the drumlins <strong>and</strong> glacial<br />
striae indicate an ice-movement direction from the north-east<br />
to the south-west <strong>and</strong> are developed on crystalline bedrock.<br />
A few glacial striations have an E–W orientation (Fig. 2). In<br />
the southern part <strong>of</strong> Bornholm, only ice-movement directions<br />
from E to W are seen within the s<strong>of</strong>ter bedrock. These<br />
E–W erosional features were formed during a subsequent<br />
ice-stream event, which erased earlier NE–SW features in<br />
the southern part, but did not have the capacity to erode<br />
the harder crystalline bedrock. It appears that the subglacial<br />
conditions during the ice advances from the north-east were<br />
suitable for erosion <strong>of</strong> the granites on the northern part <strong>of</strong><br />
Bornholm.<br />
As indicated by the fracture valleys, the fault pattern is<br />
in N–S, NNE–SSW <strong>and</strong> NE–SW directions in this part <strong>of</strong><br />
Bornholm, which is probably also true for the joint pattern.<br />
This joint <strong>and</strong> fault pattern could also favour formation <strong>of</strong><br />
the elongated hills in this NE–SW direction, <strong>and</strong> would result<br />
in a preferred direction <strong>of</strong> erosional features by the ice<br />
advances from the north-east.<br />
The orientations <strong>of</strong> the erosional features range from 39°<br />
to 65° <strong>and</strong> could reflect several ice advances, although they<br />
cannot clearly be separated into two or more directions.<br />
Investigations <strong>of</strong> drumlins in Sweden (Hättestr<strong>and</strong> et al.<br />
2004) show that rock-cored drumlins are formed by successive<br />
phases <strong>of</strong> erosion. If this also holds for the drumlins <strong>of</strong><br />
Bornholm, then they may have been formed during several<br />
ice advances or even ice ages, <strong>and</strong> only by glaciers advancing<br />
from the north-east.<br />
Conclusions<br />
On the northern part <strong>of</strong> Bornholm, ten bedrock-cored drumlins<br />
are recognised <strong>and</strong> are included in the new digital, geomorphological<br />
map <strong>of</strong> <strong>Denmark</strong> at a 1:200 000 scale. The<br />
LiDAR data were <strong>of</strong> great value in recognising them, although<br />
they are also recognisable from the contours <strong>of</strong> the<br />
topographic maps. The drumlins have a core <strong>of</strong> granite <strong>and</strong><br />
are more or less covered with till that was predominantly deposited<br />
towards the south-west on the lee side <strong>of</strong> the drumlins.<br />
The lengths vary from 140 m to 612 m, <strong>and</strong> the height<br />
from 5 m to 31 m.<br />
The orientation <strong>of</strong> the drumlins is NE–SW, with an average<br />
strike <strong>of</strong> 50° formed by subglacial processes during one<br />
or several ice advances from the north-east. The orientation<br />
<strong>of</strong> the fracture valleys could very well intensify the preferred<br />
erosional orientation parallel to the drumlins, <strong>and</strong> thus be an<br />
important factor in the drumlin formation.<br />
19
A B<br />
Granite<br />
Clay till<br />
Meltwater s<strong>and</strong><br />
Outwash s<strong>and</strong><br />
Peat<br />
Aeolian s<strong>and</strong><br />
Beach deposits from<br />
the Baltic Ice Lake<br />
2<br />
3<br />
1<br />
N<br />
4<br />
5<br />
N<br />
10<br />
6<br />
500 m 500 m<br />
7<br />
8<br />
9<br />
Fig. 3. A: LiDAR map <strong>of</strong> the northernmost part <strong>of</strong> Bornholm. The elevation varies from sea level to 118 m, <strong>and</strong> the highest parts are shown in white. The<br />
drumlins are indicated with red lines. The numbers refer to Table 1. B: <strong>Geological</strong> map <strong>of</strong> the same area.<br />
References<br />
Clark, C.D., Hughes, A.L.C., Greenwood, S.L., Spagnolo, M. & Ng,<br />
F.S.L. 2009: Size <strong>and</strong> shape characteristics <strong>of</strong> drumlins, derived from a<br />
large sample, <strong>and</strong> associated scaling laws. Quaternary Science Reviews<br />
28, 677–692.<br />
Gravesen, P. 1996: Geologisk set – Bornholm. En beskrivelse af områder<br />
af national geologisk interesse, 208 pp. København: Miljøministeriet,<br />
Skov- og Naturstyrelsen og Danmarks og Grønl<strong>and</strong>s Geologiske Undersøgelse.<br />
Gravesen P., Jakobsen, P.R., Binderup, M. & Rasmussen, E.S. 2004: Geologisk<br />
set – Det sydlige Jyll<strong>and</strong>. En beskrivelse af områder af national<br />
geologisk interesse, 188 pp. København: Miljøministeriet, Skov- og<br />
Naturstyrelsen og Danmarks og Grønl<strong>and</strong>s Geologiske Undersøgelse.<br />
Graversen, O. 2009: Structural analysis <strong>of</strong> superimposed fault systems <strong>of</strong><br />
the Bornholm horst block, Tornquist Zone, <strong>Denmark</strong>. <strong>Bulletin</strong> <strong>of</strong> the<br />
<strong>Geological</strong> Society <strong>of</strong> <strong>Denmark</strong> 57, 25–49.<br />
Grönwall, K.A. & Milthers, V. 1916: Beskrivelse til geologisk Kort over<br />
Danmark i Maalestok 1:100 000, Kortbladet Bornholm. Danmarks<br />
Geologiske Undersøgelse I. Række 13, 281 pp. + atlas.<br />
Hansen, M. & Poulsen, V. (eds) 1977: Geologi på Bornholm, 96 pp. Varv<br />
ekskursionsfører 1. København: Tidsskriftet Varv.<br />
Hättestr<strong>and</strong>, C., Götz, S., Näslund, J.O., Fabel, D. & Stroeven, A.P. 2004:<br />
Drumlin formation time: evidence from northern <strong>and</strong> central Sweden.<br />
Geografiska Annaler 86A, 155–167.<br />
Jakobsen, P.R. in press: Geomorphological map <strong>of</strong> <strong>Denmark</strong>, 1:200 000,<br />
4 map sheets. Copenhagen: <strong>Geological</strong> <strong>Survey</strong> <strong>of</strong> <strong>Denmark</strong> <strong>and</strong> Greenl<strong>and</strong>.<br />
Johnson, M.D., Schomacker, A., Benediktsson, Í.Ö., Geiger, A.J., Ferguson,<br />
A. & Ingólfsson, Ó. 2010: Active drumlin field revealed at the margin<br />
<strong>of</strong> Múlajökull, Icel<strong>and</strong>: a surge-type glacier. Geology 38, 943–946.<br />
Milthers, V. 1948: Det danske Istidsl<strong>and</strong>skabs Terrænformer og deres<br />
Opstaaen. Danmarks Geologiske Undersøgelse III. Række 28, 233 pp.<br />
Schou, A. 1949: Atlas <strong>of</strong> <strong>Denmark</strong>, I, L<strong>and</strong>scapes, 160 pp. + atlas. Copenhagen:<br />
Det Kongelige Danske Geografiske Selskab.<br />
Smed, P. 1981: L<strong>and</strong>skabskort over Danmark, sheet 4, Sjæll<strong>and</strong>, Loll<strong>and</strong>,<br />
Falster, Bornholm. Brenderup: Geografforlaget.<br />
Author’s address<br />
<strong>Geological</strong> <strong>Survey</strong> <strong>of</strong> <strong>Denmark</strong> <strong>and</strong> Greenl<strong>and</strong>, Øster Voldgade 10, DK-1350 Copenhagen K, <strong>Denmark</strong>. E-mail: prj@geus.dk<br />
20
Methane distribution in Holocene marine sediments in<br />
the Bornholm Basin, southern Sc<strong>and</strong>inavia<br />
Jørn Bo Jensen <strong>and</strong> Rudolf Endler<br />
The Baltic Sea is an ideal natural laboratory to study the<br />
methane cycle in the framework <strong>of</strong> diagenetic processes. In<br />
this paper we present preliminary geological mapping results<br />
from project Baltic Gas, a research project with the overall<br />
aim to contribute to the development <strong>of</strong> a scientific basis for<br />
long term sustainable use <strong>and</strong> protection <strong>of</strong> the Baltic Sea<br />
ecosystem. The Baltic Sea is a marginal sea with a strong<br />
permanent haline stratification, which leads to oxygen-poor<br />
bottom waters, <strong>and</strong> which is sometimes interrupted by oxygen-rich<br />
saltwater flowing in from the North Sea. The history<br />
<strong>of</strong> the Baltic Sea has resulted in deposition <strong>of</strong> organic-rich<br />
Holocene marine sediments that overlie glacial, late-glacial<br />
<strong>and</strong> early Holocene organic-poor sediments.<br />
The aims <strong>of</strong> Baltic Gas, a project within the BONUS-169<br />
Joint Baltic Sea Research Programme running from 2009 to<br />
2011, were (1) to map the occurrence <strong>of</strong> free shallow gas in<br />
Holocene sediments, (2) to quantify methane fluxes through<br />
the sediments <strong>and</strong> into the water column <strong>and</strong> the atmosphere,<br />
<strong>and</strong> (3) to investigate the processes <strong>and</strong> parameters governing<br />
methane generation <strong>and</strong> consumption. The contribution by<br />
the <strong>Geological</strong> <strong>Survey</strong> <strong>of</strong> <strong>Denmark</strong> <strong>and</strong> Greenl<strong>and</strong>, reported<br />
here, was to map the thickness <strong>and</strong> structure <strong>of</strong> organicrich<br />
marine deposits <strong>and</strong> the distribution <strong>of</strong> gas-bearing<br />
sediments in co-operation with partners. The authors have<br />
also compiled acoustic data which were used to select sites<br />
for a comprehensive coring programme. The sediment cores<br />
were used for physical characterisation <strong>of</strong> the gas-bearing<br />
sediments <strong>and</strong> for biogeochemical analyses. These included<br />
measurements <strong>of</strong> the concentrations <strong>of</strong> methane, sulphide,<br />
sulphate, iron <strong>and</strong> other elements <strong>and</strong> compounds. Here we<br />
present data from the Bornholm Basin, one <strong>of</strong> several key<br />
study areas (Fig. 1).<br />
Methods<br />
On shallow seismic pr<strong>of</strong>iles, the acoustic return signal is reduced<br />
in areas rich in gas-bearing sediments. The most pronounced<br />
reduction is seen when the frequency used during<br />
the seismic survey is near the resonance <strong>of</strong> the gas bubbles.<br />
Their size controls the resonance frequency, <strong>and</strong> multi-frequency<br />
data from the project show maximum bubble resonance<br />
close to 4.2 kHz, which indicates gas bubbles with a<br />
radius <strong>of</strong> 0.5–2 mm. Many <strong>of</strong> the acoustic/gas relationships<br />
were established by Anderson & Hampton (1980a, b).<br />
Acoustic data acquired during the project comprised<br />
swath bathymetry data, multibeam backscatter data, multi-<br />
Norway<br />
Sweden<br />
15°E<br />
Seismic line<br />
Pr<strong>of</strong>ile in Fig. 5<br />
Fault<br />
North<br />
Sea<br />
<strong>Denmark</strong><br />
Baltic<br />
Sea<br />
3<br />
55°10´N<br />
1 2<br />
Pol<strong>and</strong><br />
10 km<br />
500 km<br />
Fig. 1. Map <strong>of</strong> the Baltic Sea region showing the location <strong>of</strong> the project<br />
Baltic Gas in the Bornholm Basin (red rectangle) <strong>and</strong> the location <strong>of</strong> other<br />
place names mentioned in the text. 1: Eckernförder Bucht, 2: Mecklenburger<br />
Bucht, 3: Arkona Basin.<br />
Fig. 2. Map <strong>of</strong> the Bornholm Basin showing the distribution <strong>of</strong> shallow<br />
seismic lines <strong>and</strong> deep faults. The location <strong>of</strong> the seismic pr<strong>of</strong>ile <strong>of</strong> Fig. 5<br />
is shown in green.<br />
© 2012 GEUS. <strong>Geological</strong> <strong>Survey</strong> <strong>of</strong> <strong>Denmark</strong> <strong>and</strong> Greenl<strong>and</strong> <strong>Bulletin</strong> <strong>26</strong>, 21–24. Open access: www.geus.dk/publications/bull<br />
21
Border fault<br />
Footwall uplift<br />
Fig. 3. Model <strong>of</strong> syn-sedimentary infill in a half-graben.<br />
10 km<br />
Fault scarp<br />
Basin<br />
Sediment layers<br />
Rivers<br />
Bottom <strong>of</strong> basin<br />
Fig.4. Map <strong>of</strong> the Bornholm Basin showing the bathymetry <strong>and</strong> deep<br />
faults (black stippled lines). The red arrows show inflow channels.<br />
Edge <strong>of</strong> basin<br />
Depth (m)<br />
100<br />
frequency single beam data (5–100 kHz), echo sounder data<br />
as well as high frequency seismic data. Sediment acoustic<br />
work using a 5–100 kHz signal was mainly carried out in<br />
areas known to be rich in gas at shallow depths in Mecklenburger<br />
Bucht, the Arkona Basin <strong>and</strong> the Bornholm Basin in<br />
the western Baltic. Data from Parasound <strong>and</strong> an Innomar<br />
sediment echo sounder were acquired simultaneously for all<br />
acoustic lines. Extensive seismic data were acquired from the<br />
gas-rich part <strong>of</strong> the Bornholm Basin (Figs 1, 2). The sediment<br />
acoustic records were used to select places for collection<br />
<strong>of</strong> water-column data <strong>and</strong> bottom sediments during the<br />
cruises. The simultaneous recording with different devices<br />
allowed comparison <strong>of</strong> the different responses to the occurrence<br />
<strong>of</strong> gas at shallow depths.<br />
The new seismic field data collected during project Baltic<br />
Gas was loaded onto a seismic work station <strong>and</strong> combined<br />
with seismic archive data from the same area. The seismic<br />
dataset was interpreted <strong>and</strong> combined with physical characteristics<br />
<strong>of</strong> the sediments plus additional seabed data to compile<br />
a map <strong>of</strong> the gas distribution in the Baltic Sea. Multisensor<br />
core logging <strong>of</strong> 6–12 m long gravity cores were used<br />
for estimating the basic physical properties <strong>of</strong> sediments with<br />
<strong>and</strong> without gas bubbles. Split cores were used for core description,<br />
sub-sampling <strong>and</strong> sedimentological analyses.<br />
Gas distribution mapping in the<br />
Bornholm Basin<br />
As stated in the introduction, the main aim <strong>of</strong> the project<br />
was to produce a map <strong>of</strong> the seabed gas distribution in the<br />
SW<br />
NE<br />
Free<br />
gas<br />
Glacial deposits<br />
Littorina Sea mud<br />
Ancylus Lake clay<br />
Yoldia Sea clay<br />
Baltic Ice Lake clay<br />
10 m<br />
Bedrock<br />
5 km<br />
Fig 5. Seismic pr<strong>of</strong>ile 2005-06222 obtained by an Innomar sediment echo sounder (10 kHz). The pr<strong>of</strong>ile crosses the Bornholm Basin (for location see Fig.<br />
2). Deposits from the Baltic Ice Lake, the Yoldia Sea <strong>and</strong> the Ancylus Lake drape the glacial basin surface whereas mud from the Littorina Sea shows asymmetrical<br />
infill. Acoustic blanking due to free gas occurs where the thickness <strong>of</strong> the organic-rich Littorina mud exceeds 6–8 m.<br />
22
Baltic Sea. Such a map shows only the general pattern, so in<br />
order to underst<strong>and</strong> the mechanism <strong>of</strong> gas production below<br />
the seabed it was necessary to make detailed studies in a few<br />
key areas. The Bornholm Basin was selected as one <strong>of</strong> these<br />
key areas, because it is well known for gas-rich sediments <strong>and</strong><br />
because seismic data from previous surveys together with the<br />
new data made it possible to get a full coverage <strong>of</strong> the basin<br />
with limited supplementary work during the cruises (Fig. 2).<br />
The Bornholm Basin is located north-east <strong>of</strong> the isl<strong>and</strong><br />
<strong>of</strong> Bornholm in an area that has been influenced by block<br />
faulting. It is possible that faulting continued into the Holocene.<br />
The Bornholm Basin is bounded by major faults <strong>and</strong><br />
has been interpreted as a half-graben (Fig. 3; Vejbæk 1985;<br />
Wannäs & Flodén 1994; Sviridov et al. 1995) in which thick<br />
packages <strong>of</strong> late glacial <strong>and</strong> Holocene sediments have been<br />
deposited. In spite <strong>of</strong> the post-half-graben sedimentation history,<br />
the present bathymetry clearly reflects the deeper structures<br />
(Fig. 4). Two inflow channels are found in the southeastern<br />
part <strong>of</strong> the basin.<br />
It is a characteristic feature <strong>of</strong> the basin that late glacial<br />
<strong>and</strong> early Holocene clay deposits drape the glacial surface,<br />
whereas the marine Holocene mud sediments form a wedgelike<br />
sediment body (Fig. 5). This difference reflects different<br />
sedimentation mechanisms, from vertical settling <strong>of</strong> sediment<br />
particles to settling influenced by inflowing currents<br />
during the marine Littorina Sea stage.<br />
A map showing the thickness <strong>of</strong> the Holocene marine mud<br />
based on the depth <strong>of</strong> the seabed <strong>and</strong> the bottom <strong>of</strong> the Holocene<br />
marine mud is shown in Fig. 6. A clear connection between<br />
the thickness <strong>of</strong> the mud <strong>and</strong> the down-faulted blocks<br />
is seen; the mud reaches a thickness <strong>of</strong> more than 12 m in the<br />
vicinity <strong>of</strong> the fault scarp <strong>of</strong> the half-graben, but only a few<br />
metres in the deepest, central part <strong>of</strong> the Bornholm Basin.<br />
Acoustic blanking is seen in many seismic pr<strong>of</strong>iles. This is<br />
caused by scattering due to gas bubbles in the sediment. A gas<br />
distribution map has been compiled showing the depth from<br />
the seabed to the top <strong>of</strong> the acoustic gas front (Fig. 7). Experience<br />
tells us that a critical thickness <strong>of</strong> organic-rich Holocene<br />
marine mud must be reached before free gas bubbles form. In<br />
the Bornholm Basin where water depths in the order <strong>of</strong> 90<br />
m are found, acoustic blanking starts where the Holocene<br />
organic-rich mud reaches a thickness <strong>of</strong> 6–8 m. The depth<br />
from the seabed to the top <strong>of</strong> the acoustic gas front is an important<br />
parameter in modelling methane fluxes. Our study<br />
shows that in the Bornholm Basin the gas front is located<br />
less than 0.5 m below the seabed, in areas with the highest<br />
sedimentation rates <strong>of</strong> organic-rich mud.<br />
Acoustic properties <strong>and</strong> physical<br />
characteristics <strong>of</strong> gas-charged sediments<br />
The data acquired from multi-sensor core logging <strong>and</strong> sedimentological<br />
analyses were used for geo-acoustic models <strong>and</strong><br />
interpretation <strong>of</strong> the seismo-acoustic records. The physical<br />
properties <strong>and</strong> the geo-acoustical data were used to investigate<br />
the influence <strong>of</strong> gas bubbles on the acoustic properties<br />
<strong>and</strong> the strength <strong>of</strong> the muddy sediments.<br />
The acoustic properties such as sound velocity <strong>and</strong> attenuation<br />
are strongly influenced by gas bubbles in the sediments,<br />
as illustrated in the sediment echo sounder <strong>and</strong> seismic records<br />
(Fig. 5). The behaviour <strong>of</strong> acoustic signals is very complex<br />
<strong>and</strong> controlled by environmental parameters including<br />
pressure <strong>and</strong> temperature, the sound frequency <strong>and</strong> the<br />
physical properties <strong>of</strong> the different sedimentary components<br />
(solid grains, water <strong>and</strong> gas bubbles). The physical properties<br />
determined on sediment cores or samples from sediment<br />
Thickness (m)<br />
0–2<br />
2–4<br />
4–6<br />
6–8<br />
8–10<br />
10–12<br />
>12<br />
Depth (m)<br />
0.0–0.5<br />
0.5–1.0<br />
1.0–1.5<br />
1.5–2.0<br />
2.0–2.5<br />
2.5–3.0<br />
3.0–3.5<br />
3.5–4.0<br />
4.0–4.5<br />
4.5–5.0<br />
>5<br />
10 km<br />
10 km<br />
Fig. 6. Map <strong>of</strong> the Bormholm Basin showing the thickness <strong>of</strong> Holocene<br />
marine mud. Deeper structures are represented by the faults (black stippled<br />
lines).<br />
Fig. 7. Mapped areas with acoustic blanks caused by scattering due to<br />
gas bubbles in the sediment. The depth from the seabed to the top <strong>of</strong> the<br />
acoustic gas front is shown.<br />
23
samples (wet bulk density, porosity, gravimetric bulk water<br />
content, loss on ignition <strong>and</strong> vane shear strength) showed<br />
no significant differences between gas-charged <strong>and</strong> gas-free<br />
mud. The reason may be that gas bubbles only constitute<br />
a small part <strong>of</strong> the sediment <strong>and</strong> hence do not change the<br />
bulk properties significantly. Similar results were reported by<br />
Wilkens & Richardson (1998) for Eckernförder Bucht where<br />
the gas volume ranged from 0 to 2%, with bubble diameters<br />
<strong>of</strong> 0.6–1 mm.<br />
5. Comparisons <strong>of</strong> gas-charged <strong>and</strong> gas-free mud show no<br />
significant difference in bulk properties <strong>of</strong> various basic<br />
physical parameters determined in the sediment. This<br />
may reflect that gas bubbles only constitute 0–5% <strong>of</strong><br />
the Holocene muddy sediments.<br />
Acknowledgement<br />
Project Baltic Gas was funded by The Baltic Organisations Network<br />
(BONUS).<br />
Concluding remarks<br />
Ma pping <strong>of</strong> the methane distribution in the Baltic Sea surface<br />
sediments <strong>and</strong> sediment analyses have led to a number<br />
<strong>of</strong> conclusions:<br />
1. Acoustic blanking in seismic pr<strong>of</strong>iles is caused by scattering<br />
due to gas bubbles in the sediment. The bubble<br />
size controls the resonance frequency, <strong>and</strong> the results<br />
indicate a maximum bubble resonance close to 4.2 kHz,<br />
corresponding to bubble diameters in the order <strong>of</strong> 1–4<br />
mm.<br />
2. Accumulations <strong>of</strong> near-surface gas in the Baltic Sea in<br />
general are restricted to near-shore archipelagos <strong>and</strong><br />
geologically controlled sediment traps with high sedimentation<br />
rates.<br />
3. A direct link between the occurrence <strong>of</strong> near-surface<br />
gas <strong>and</strong> a minimum thickness <strong>of</strong> Holocene marine<br />
organic-rich sediments is seen. A characteristic feature<br />
for the Bornholm Basin is that acoustic blanks are seen<br />
where the organic-rich mud reaches a thickness <strong>of</strong> more<br />
than 6–8 m.<br />
4. The acoustic properties <strong>of</strong> gas-free <strong>and</strong> gas-charged<br />
sediments are very different, as demonstrated by soundvelocity<br />
changes <strong>and</strong> attenuation in the seismic records.<br />
The behaviour <strong>of</strong> acoustic signals is extremely complex<br />
<strong>and</strong> influenced by environmental parameters such as<br />
pressure <strong>and</strong> temperature.<br />
References<br />
Anderson, A.L. & Hampton, L.D. 1980a: Acoustics <strong>of</strong> gas-bearing sediments<br />
I. Background. Journal <strong>of</strong> the Acoustical Society <strong>of</strong> America 67,<br />
1865–1889.<br />
Anderson, A.L. & Hampton, L.D. 1980b: Acoustics <strong>of</strong> gas-bearing sediments<br />
II. Measurements <strong>and</strong> models. Journal <strong>of</strong> the Acoustical Society<br />
<strong>of</strong> America 67, 1890–1903.<br />
Sviridov, N.I., Fr<strong>and</strong>sen, J.V., Larsen, T.H., Friis-Christensen, V., Madsen,<br />
K.E. & Lykke-Andersen, H. 1995: The geology <strong>of</strong> Bornholm Basin.<br />
Aarhus Geoscience 5, 15–35.<br />
Vejbæk, O.V. 1985: Seismic stratigraphy <strong>and</strong> tectonics <strong>of</strong> sedimentary basins<br />
around Bornholm southern Baltic. Danmarks Geologiske Undersøgelse,<br />
Serie A 8, 30 pp.<br />
Wannäs, K.O. & Flodén, T. 1994: Tectonic framework <strong>of</strong> the Hanö Bay<br />
area, southern Baltic Sea. Technical Report: Svensk Kärnbränslehante<br />
ring AB, 1994, 50 pp., http://www.skb.se/upload/publications/pdf/<br />
TR94-09webb.pdf<br />
Wilkens, R.H. & Richardson, M.D. 1998: The influence <strong>of</strong> gas bubbles<br />
on sediment acoustic properties: in situ, laboratory, <strong>and</strong> theoretical results<br />
from Eckernförde Bay, Baltic sea. Continental Shelf Research 18,<br />
1859–1892.<br />
Authors’ addresses<br />
J.B.J., <strong>Geological</strong> <strong>Survey</strong> <strong>of</strong> <strong>Denmark</strong> <strong>and</strong> Greenl<strong>and</strong>, Øster Voldgade 10, DK-1350 Copenhagen K, <strong>Denmark</strong>. E-mail: jbj@geus.dk<br />
R.E., The Leibniz Institute for Baltic Sea Research, Seestrasse 15, Warnemünde, D-18119 Rostock, Germany.<br />
24
Natura 2000 habitat mapping in Kattegat, <strong>Denmark</strong>:<br />
an example from Læsø Trindel<br />
Zyad K. Al-Hamdani <strong>and</strong> Laura G. Addington<br />
Natura 2000 is a network <strong>of</strong> nature protection areas established<br />
by the European Union under the Habitats Directive<br />
(European Union 1992). The aim is to assure long-term survival<br />
<strong>of</strong> the most valuable <strong>and</strong> endangered species <strong>and</strong> habitats<br />
in Europe. The network comprises special areas <strong>of</strong> conservation<br />
<strong>and</strong> protection designated by the member states<br />
under, respectively, the Habitats Directive <strong>and</strong> the Birds Directive.<br />
The establishment <strong>of</strong> the network <strong>of</strong> protected areas<br />
also fulfils a community obligation under the Convention <strong>of</strong><br />
Biological Diversity <strong>of</strong> the United Nations.<br />
The member states <strong>of</strong> the European Union are obliged<br />
to ensure full compliance with Natura 2000 legislation <strong>and</strong><br />
must work out a management plan for each Natura 2000<br />
area. In the marine environment, detailed information on<br />
the Natura 2000 areas is necessary to make informed management<br />
plans in fulfilment <strong>of</strong> national <strong>and</strong> international<br />
obligations <strong>and</strong> regulate human activities. The data may<br />
come from geophysical mapping or from biological sampling<br />
or from both.<br />
This paper presents some <strong>of</strong> the results <strong>of</strong> a habitat mapping<br />
project performed in 2011 covering almost all Natura<br />
2000 areas <strong>and</strong> pre-designated, aggregate extraction areas in<br />
the inner Danish waters. Due to time <strong>and</strong> resource limitations,<br />
the Natura 2000 areas in Danish waters were mapped<br />
by geophysical methods to produce seabed sediment maps,<br />
followed by biological sampling at selected stations. This is a<br />
fast <strong>and</strong> reliable method for producing a broad-scale habitat<br />
map <strong>of</strong> large areas in a limited time.<br />
The areas were mapped <strong>and</strong> classified according to the<br />
Habitats Directive (European Union 1992; European Commission<br />
2007). The mapping was also conducted to conform<br />
to the Marine Strategy Framework Directive, which requires<br />
the member states to provide an initial assessment <strong>of</strong> their<br />
marine waters by July 2012 (European Union 2008).<br />
The <strong>Geological</strong> <strong>Survey</strong> <strong>of</strong> <strong>Denmark</strong> <strong>and</strong> Greenl<strong>and</strong><br />
(GEUS) carried out the geological <strong>and</strong> geophysical work, <strong>and</strong><br />
Orbicon A/S undertook the biological investigations in 18<br />
Natura 2000 areas in Kattegat <strong>and</strong> the southern Baltic Sea<br />
(Fig. 1). Læsø Trindel is a Natura 2000 area with a significant<br />
biodiversity <strong>and</strong> a wide range <strong>of</strong> habitat types <strong>of</strong> which three<br />
are <strong>of</strong> special interest: (1) boulder reefs, (2) s<strong>and</strong>banks <strong>and</strong> (3)<br />
‘bubbling reefs’ which are structures formed by leaking gas.<br />
<strong>Geological</strong> setting<br />
Læsø Trindel is located north-east <strong>of</strong> Læsø, the largest isl<strong>and</strong><br />
in Kattegat. The Læsø Trindel area is located in the NW–<br />
SE-trending Fennosc<strong>and</strong>ian Border Zone <strong>and</strong> has been affected<br />
by neotectonic deformation (Hansen 1995). In this<br />
area there is a succession <strong>of</strong> Weichselian clay <strong>and</strong> silt with<br />
scattered stones <strong>and</strong> boulders, locally overlain by till. After<br />
isostatic rebound <strong>and</strong> erosion <strong>of</strong> the sediments in the Holocene,<br />
a widespread residual layer <strong>of</strong> boulders or patches <strong>of</strong><br />
boulders has been left. Hermansen & Jensen (2000) produced<br />
a regional (1:500 000 scale) seabed sediment map <strong>of</strong><br />
the Danish waters, which shows the presence <strong>of</strong> till deposits<br />
in the area on <strong>and</strong> around Læsø Trindel. However, at that<br />
time there were insufficient data for a detailed sediment map<br />
<strong>of</strong> the area.<br />
10°E 12°E<br />
Læsø<br />
Trindel<br />
56°N<br />
Læsø<br />
Kattegat<br />
<strong>Denmark</strong><br />
57.44°<br />
2 km<br />
11.2°<br />
Natura 2000 areas<br />
Aggregate extraction areas<br />
Sailing lines: current project<br />
Sailing lines: 2005 project<br />
Baltic Sea<br />
14°E<br />
50 km<br />
Fig. 1. Map <strong>of</strong> inner waters in <strong>Denmark</strong> showing the locations <strong>of</strong> the Natura<br />
2000 <strong>and</strong> the aggregate extraction areas mapped in 2011. Inset: 2005<br />
<strong>and</strong> 2011 sailing lines in the Læsø Trindel area.<br />
© 2012 GEUS. <strong>Geological</strong> <strong>Survey</strong> <strong>of</strong> <strong>Denmark</strong> <strong>and</strong> Greenl<strong>and</strong> <strong>Bulletin</strong> <strong>26</strong>, 25–28. Open access: www.geus.dk/publications/bull<br />
25
A<br />
57.44°N<br />
2 km<br />
11.2°E<br />
A more recent study undertaken by GEUS in 2005 yielded<br />
echo sounder, side-scan sonar <strong>and</strong> ground truth data from<br />
the central part <strong>of</strong> Læsø Trindel (Fig. 1; Leth & Al-Hamdani<br />
2008) showing that it consists <strong>of</strong> a 2 × 2 km shallow platform<br />
with water depths <strong>of</strong> 4 to 13 m. In the eastern <strong>and</strong> south-eastern<br />
parts <strong>of</strong> the survey area, the water depth increases to 45 m<br />
(Fig. 2A). The platform consists mainly <strong>of</strong> till with boulders<br />
<strong>and</strong> cobbles that vary in size <strong>and</strong> distribution throughout the<br />
area. Its central part shows the highest density <strong>of</strong> cobbles <strong>and</strong><br />
boulders, <strong>and</strong> this is the main boulder reef <strong>of</strong> the region. The<br />
surrounding part is characterised by gravelly s<strong>and</strong> <strong>and</strong> s<strong>and</strong><br />
patches with scattered boulders.<br />
0 6 8 10 13 16 19 22 25 28 31 40 50<br />
Water depth (m)<br />
B<br />
C<br />
Methods<br />
Field work in 2011 was carried out in two phases: In phase<br />
one, bathymetry data were collected with a single-beam echo<br />
sounder, <strong>and</strong> overlapping seabed backscatter images were obtained<br />
using side-scan sonar with 100 <strong>and</strong> 400 kHz frequencies.<br />
Information on the sub-bottom layers was obtained<br />
with a chirp pr<strong>of</strong>iler (1–10 kHz; providing high resolution<br />
but low penetration) <strong>and</strong> a sparker (1 kHz; providing deeper<br />
penetration but lower resolution). The area was surveyed<br />
with 100 m line spacing to ensure full seabed coverage. Cross<br />
lines with 4 km spacing were surveyed for cross-verification<br />
(Fig. 1).<br />
In phase two, which succeeded preliminary interpretation<br />
<strong>of</strong> the acoustic data, areas <strong>of</strong> special interest were video<br />
filmed with a camera mounted on a remotely operated vehicle,<br />
<strong>and</strong> surface sediment samples were collected with a Van<br />
Veen grab sampler. Finally, sediment cores were collected<br />
with a 6 m long vibrocorer. The acoustic data, the video films<br />
<strong>and</strong> the grab <strong>and</strong> core samples were used together with older<br />
data for the final interpretation <strong>and</strong> habitat mapping .<br />
Natura 2000 area<br />
Substrate type 1a<br />
Substrate type 1b<br />
Substrate type 2<br />
Substrate type 3<br />
Substrate type 4<br />
’Bubbling reef’: current project<br />
’Bubbling reef’: 2005 project<br />
Fig. 2. The Læsø Trindel Natura 2000 area. A: Bathymetry. B: Side-scan<br />
sonar mosaic. The grey scale reflects hard (dark) to s<strong>of</strong>t (light) sediments.<br />
C: Interpreted distribution <strong>of</strong> substrate types <strong>and</strong> Natura 2000 habitats.<br />
Results <strong>and</strong> discussion<br />
The data from 2005 <strong>and</strong> 2011 cover almost the entire Læsø<br />
Trindel Natura 2000 area (Fig. 1) <strong>and</strong> were used to map th e<br />
bathymetry along the sailing lines, to compile a side-scan<br />
mosaic <strong>and</strong> to map the distribution <strong>of</strong> various substrates <strong>and</strong><br />
nature types. The depth data from 2011 compare well with<br />
the depth data from 2005 which were acquired with a highly<br />
accurate multibeam echo sounder (Fig. 2A).<br />
The side-scan backscatter mosaic image shows variation<br />
in substrate reflectivity due to the different signatures <strong>of</strong> the<br />
different sediments (Fig. 2B). The interpretation <strong>of</strong> the image<br />
was carried out by dividing the image into 50 × 50 m<br />
blocks <strong>and</strong> manually classifying the sediments in each block.<br />
<strong>26</strong>
Interpretation <strong>of</strong> the side-scan images together with<br />
ground truth samples allowed us to produce a map that<br />
shows the distribution <strong>of</strong> substrate types <strong>and</strong> the occurrence<br />
<strong>of</strong> Natura 2000 habitat types, using the classification categories<br />
suggested by the Danish Nature Agency (Table 1; Fig.<br />
2C). The chirp pr<strong>of</strong>iles were also used for the interpretation.<br />
The different types <strong>of</strong> sediments give different seismic signals<br />
that enhance the final seabed sediment interpretation<br />
significantly.<br />
Boulder reefs (substrate type 4) cover c. 38% <strong>of</strong> the Na<br />
tura 2000 area. Between these, substrate type 2 with s<strong>and</strong><br />
<strong>and</strong> scattered boulders dominates. The deeper south-eastern<br />
parts <strong>of</strong> the surveyed area are dominated by s<strong>of</strong>t sediment.<br />
S<strong>and</strong>banks are not well defined in the Læsø Trindel area, but<br />
Substrate Description<br />
type<br />
Table 1. Substrate classification<br />
1a S<strong>of</strong>t bottom sediment with silt <strong>and</strong> mud<br />
1b S<strong>and</strong>, including s<strong>and</strong>banks<br />
2 S<strong>and</strong>, gravel <strong>and</strong> small stones 10 cm that cover 10 cm with >25% coverage; also with s<strong>and</strong>,<br />
gravel <strong>and</strong> scattered, small stones<br />
25 m 25 m<br />
A<br />
B<br />
100 m 7.5 m<br />
100 m 7.5 m<br />
C<br />
Fig. 3. Examples <strong>of</strong> ‘bubbling reefs’. A: On side-scan images ‘bubbling reefs’ appear as small areas with lowered reflectivity (arrows). B: Shallow seismic<br />
sparker pr<strong>of</strong>iles with sites where the water column is disturbed by gas seeping out from the sediments (arrows). C: Snapshots from a video film taken with a<br />
camera mounted on a remotely operated vehicle. Gas bubbles are seen in the water column above the ‘bubbling reefs’ (arrows). The reefs have a rich epiflora<br />
<strong>and</strong> epifauna.<br />
27
some s<strong>and</strong> accumulations (substrate type 1b) are found in the<br />
eastern <strong>and</strong> southern parts.<br />
‘Bubbling reefs’ form at sites where methane gas seeping<br />
up from Eemian <strong>and</strong> early Weichselian marine deposits has<br />
led to carbonate cementation <strong>of</strong> s<strong>and</strong> in the methane oxidation<br />
zone (Jensen et al. 1992; Laier et al. 1992). In some areas,<br />
cemented s<strong>and</strong> slabs have been exposed by subsequent erosion<br />
producing a hard substrate, which can be colonised by plants<br />
<strong>and</strong> animals that form a rich epiflora <strong>and</strong> epifauna. The geology,<br />
geochemistry <strong>and</strong> biology <strong>of</strong> the ‘bubbling reefs’ have<br />
been intensively studied, <strong>and</strong> their structure, origin <strong>and</strong> formation<br />
have been described by Jørgensen (1989), Jensen et al.<br />
(1992) <strong>and</strong> Laier & Jensen (2007).<br />
‘Bubbling reefs’ are fairly common in the Læsø Trindel region<br />
where they were discovered by chance by fishermen <strong>and</strong><br />
sport divers. Some ‘bubbling reefs’ were recorded on sidescan<br />
images during previous surveys (Leth & Al-Hamdani<br />
2008), <strong>and</strong> additional occurrences <strong>of</strong> these structures were<br />
recorded in the side-scan data from 2011 (Fig. 2C). They are<br />
distinctive on the side-scan images (Fig. 3A), but can also<br />
be detected on shallow seismic pr<strong>of</strong>iles (Fig. 3B) where gasprone<br />
structures can be mapped, <strong>and</strong> sometimes gas bubbles<br />
can be seen in the water column. The ‘bubbling reefs’ occur<br />
mainly in areas with s<strong>and</strong>y seabed (substrate type 1b). The<br />
reefs support benthic communities rich in species (Fig. 3C)<br />
<strong>and</strong> have many cavities where animals can find shelter.<br />
Concluding remarks<br />
1. Habitat mapping using geophysical methods in combination<br />
with ground truth observations <strong>and</strong> sampling is<br />
a cost-effective means <strong>of</strong> mapping large seabed areas in<br />
a relatively short time.<br />
2. Some Natura 2000 habitats such as the ‘bubbling reefs’<br />
were originally discovered by chance by fishermen <strong>and</strong><br />
sport divers. Side-scan surveying is an effective way to<br />
map this habitat type over larger areas.<br />
3. The results obtained during this project provide information<br />
on the physical features <strong>and</strong> the habitat types<br />
<strong>of</strong> Læsø Trindel. These two elements are important<br />
to assess the current environmental status <strong>of</strong> marine<br />
waters as required by the Marine Strategy Framework<br />
Directive (table 1 in annex III).<br />
4. Management <strong>of</strong> human activities in the marine environment<br />
requires a management plan that ensures habitat<br />
protection <strong>and</strong> at the same time enhances sustainable<br />
economic growth <strong>of</strong> the region. This project provides<br />
information on Natura 2000 areas for decision makers<br />
in <strong>Denmark</strong>.<br />
Acknowledgements<br />
The Danish Nature Agency is thanked for financing the project <strong>and</strong> for<br />
permission to publish the results. We also thank Orbicon A/S for ground<br />
truth samples <strong>and</strong> films, <strong>and</strong> the captain <strong>and</strong> the crew <strong>of</strong> R/V Laura for<br />
help during the cruises.<br />
References<br />
European Commission 2007: Interpretation manual <strong>of</strong> European Union<br />
habitat, 142 pp. Brussels: European Commission, http://ec.europa.eu/<br />
environment/nature/legislation/habitatsdirective/docs/2007_07_im.pdf<br />
European Union 1992: Council directive 92/43/EEC <strong>of</strong> 21 May 1992 on<br />
the conservation <strong>of</strong> natural habitats <strong>and</strong> <strong>of</strong> wild fauna <strong>and</strong> flora (Habitat<br />
Directive). Official Journal <strong>of</strong> the European Union L 206, 7–92,<br />
http://eur-lex.europa.eu/LexUriServ/LexUriServ.do?uri=OJ:L:1992:<br />
206:0007:0050:EN:pdf<br />
European Union 2008: Directive 2008/56/EC <strong>of</strong> the European Parliament<br />
<strong>and</strong> <strong>of</strong> the Council establishing a framework <strong>of</strong> community action<br />
in the field <strong>of</strong> marine environment policy (Marine Strategy Framework<br />
Directive). Official Journal <strong>of</strong> the European Union L 164, 19–40,<br />
http://eur-lex.europa.eu/LexUriServ/LexUriServ.do?uri=OJ:L:2008:<br />
164:0019:0040:EN:pdf<br />
Hansen, J.M. 1995: En ø’s opståen, kystdannelse og vegetationsudvikling:<br />
Naturlige og menneskeskabte l<strong>and</strong>skaber på Læsø. Geologisk Tidsskrift<br />
2, 1–74.<br />
Hermansen, B. & Jensen, J.B. 2000: Digitalt kort over havbundssedimenter<br />
omkring Danmark 1:500.000. Danmarks og Grønl<strong>and</strong>s Geologiske<br />
Undersøgelse Rapport 2000/68 (CD-ROM).<br />
Jensen, P., Aagaard, I., Burke Jr., R.A., D<strong>and</strong>o, P.R., Jørgensen, N.O., Kuijpers,<br />
A., Laier, T., O´Hara, S.C.M. & Schmaljohann, R. 1992: ‘Bubbling<br />
reefs’ in Kattegat: Submarine l<strong>and</strong>scapes <strong>of</strong> carbonate-cemented<br />
rocks support a diverse ecosystem at methane seeps. Marine Ecology<br />
Progress Series 83, 103–112.<br />
Jørgensen, N.O. 1989: Holocene methane-derived, dolomite cemented<br />
s<strong>and</strong>stone pillars from the Kattegat, <strong>Denmark</strong>. Marine Geology 88,<br />
71–81.<br />
Laier, T. & Jensen, J.B. 2007: Shallow gas depth-contour <strong>of</strong> Skagerrak –<br />
western Baltic Sea region. Geo-Marine Letters 27, 127–141.<br />
Laier, T., Jørgensen, N.O., Buchardt, B., Cederberg, T. & Kuijpers, A.<br />
1992: Accumulation <strong>and</strong> seepages biogenic gas in northern <strong>Denmark</strong>.<br />
Continental Shelf Research 12, 1173–1186.<br />
Leth, J.O. & Al-Hamdani, Z. 2008: Mapping <strong>of</strong> the Natura 2000 Annex 1<br />
habitats 1170 <strong>and</strong> 1180 in N Kattegat, combining acoustic <strong>and</strong> ground<br />
truth methods. In: Dinesen, G.E. (ed.): Mapping <strong>and</strong> modelling <strong>of</strong> marine<br />
habitats in the Baltic Sea region. BALANCE Interim Report 27,<br />
75–89.<br />
Authors’ address<br />
<strong>Geological</strong> <strong>Survey</strong> <strong>of</strong> <strong>Denmark</strong> <strong>and</strong> Greenl<strong>and</strong>, Øster Voldgade 10, DK-1350 Copenhagen K, <strong>Denmark</strong>. E-mail: azk@geus.dk<br />
28
Early Holocene sea-level changes in Øresund,<br />
southern Sc<strong>and</strong>inavia<br />
Ole Bennike, Martin Skov Andreasen, Jørn Bo Jensen, Matthias Moros <strong>and</strong> Nanna Noe-Nygaard<br />
The Baltic Sea <strong>and</strong> Kattegat are connected via three straits:<br />
Storebælt, Lillebælt <strong>and</strong> Øresund (Fig. 1). Øresund is the<br />
shallowest with a threshold around 7 m deep <strong>and</strong> increasing<br />
water depths to the north (Fig. 2). In the early Holocene,<br />
global sea-level rise led to reflooding <strong>of</strong> Øresund. It started<br />
in northern Øresund which was transformed into a fjord.<br />
However, so far the timing <strong>of</strong> the transgression has not been<br />
well determined, but sediment cores collected north <strong>of</strong> the<br />
threshold, at water depths <strong>of</strong> 12 to 20 m, <strong>and</strong> a new series <strong>of</strong><br />
radiocarbon ages help to constrain this. As the relative sea<br />
level continued to rise, the threshold in Øresund was also<br />
flooded, <strong>and</strong> Øresund became a strait. In mid-Holocene<br />
time, the relative sea level rose until it was 4–5 m higher<br />
than at present, <strong>and</strong> low-lying areas around Øresund became<br />
small fjords. During the late Holocene, the relative sea level<br />
fell again. Part <strong>of</strong> the data set discussed here was presented by<br />
Andreasen (2005).<br />
Active glacier ice disappeared from the region around 17<br />
cal. ka BP (calibrated kilo-years before present; Houmark-<br />
Nielsen & Kjær 2003). During deglaciation, the ice margin<br />
receded southwards <strong>and</strong> huge amounts <strong>of</strong> meltwater flowed<br />
northwards <strong>and</strong> formed deep holes <strong>and</strong> channels.<br />
Shortly after the deglaciation <strong>of</strong> the region, marine waters<br />
inundated Øresund <strong>and</strong> remains <strong>of</strong> Arctic species such as<br />
polar cod (Boreogadus saida ) <strong>and</strong> ringed seal (Phoca hispida)<br />
have been found <strong>and</strong> dated to around 16 <strong>and</strong> 17.6 cal. ka BP<br />
(Lagerlund & Houmark-Nielsen 1993). During this time,<br />
the relative sea level must have been high, reflecting the loading<br />
<strong>of</strong> the Fennosc<strong>and</strong>ian Ice Sheet during the Last Glacial<br />
Maximum.<br />
Somewhat later Øresund played an important role in<br />
draining the Baltic Ice Lake, <strong>and</strong> a major delta formed north<br />
<strong>of</strong> Øresund. Radiocarbon dating <strong>of</strong> marine mollusc shells<br />
from the delta has given ages between 16.3 <strong>and</strong> 11.8 cal. ka<br />
BP. Following isostatic rebound the relative sea level fell, <strong>and</strong><br />
major parts <strong>of</strong> Øresund became dry l<strong>and</strong> with forests, lakes<br />
<strong>and</strong> peat bogs. Submarine lake <strong>and</strong> peat deposits from the<br />
Younger Dryas <strong>and</strong> the early Holocene have been reported<br />
(Jessen 1923). Several now submarine former settlements<br />
have been reported from Øresund (Fischer 1993), which can<br />
be referred to the Mesolithic based on artefacts <strong>and</strong> radiocarbon<br />
dating.<br />
Methods<br />
Sediment coring was carried out with a 10 cm diameter<br />
vibrocorer from R/V Alex<strong>and</strong>er von Humboldt <strong>and</strong> R/V<br />
Water depth<br />
(m)<br />
57°N<br />
Jyll<strong>and</strong><br />
10°E 14°E<br />
Kattegat<br />
<strong>Denmark</strong><br />
Sweden<br />
Fig. 2<br />
Øresund<br />
56°N<br />
Sjæll<strong>and</strong><br />
246250<br />
246280<br />
255150<br />
348240<br />
246230<br />
246240<br />
Skåne<br />
348180<br />
0–5<br />
5–10<br />
10–15<br />
15–20<br />
20–25<br />
25–30<br />
30–35<br />
35–40<br />
55°N<br />
Storebælt<br />
Lillebælt<br />
Germany<br />
Fyn<br />
Femern<br />
Bælt<br />
Skåne<br />
Baltic Sea<br />
50 km<br />
55°N 13°30´E<br />
T<br />
T T<br />
13°E<br />
40–45<br />
45–50<br />
>50<br />
10 km<br />
Fig. 1. Map <strong>of</strong> <strong>Denmark</strong> <strong>and</strong> the surrounding area showing the location <strong>of</strong><br />
Øresund <strong>and</strong> other place names mentioned in the text.<br />
Fig. 2. Map <strong>of</strong> the Øresund region showing the bathymetry <strong>and</strong> the location<br />
<strong>of</strong> vibrocores. T: Threshold.<br />
© 2012 GEUS. <strong>Geological</strong> <strong>Survey</strong> <strong>of</strong> <strong>Denmark</strong> <strong>and</strong> Greenl<strong>and</strong> <strong>Bulletin</strong> <strong>26</strong>, 29–32. Open access: www.geus.dk/publications/bull<br />
29
Table 1. Selected radiocarbon ages from Øresund<br />
Core/ N. lat. W. long. Lab. no. Material Depth Depth Age ( 14C Calibrated<br />
locality no. bct* (cm) b.s.l. (m) years BP) age (years BP) †<br />
246230 55°46.801´ 12°44.461´ AAR-8284 Mytilus edulis 105–115 21.2 8310 ± 70<br />
246230 55°46.801´ 12°44.461´ AAR-8285 Mytilus edulis 542 25.5 9155 ± 70<br />
246230 55°46.801´ 12°44.461´ AAR-8286 Phragmites australis 560–570 25.7 9445 ± 70<br />
246240 55°46.440´ 12°44.392´ AAR-8287 Macoma balthica 120–130 18.0 9200 ± 70<br />
246240 55°46.440´ 12°44.392´ AAR-8288 Macoma balthica 380–390 20.6 9380 ± 80<br />
246250 55°57.811´ 12°36.327´ AAR-86<strong>26</strong> Littorina littorea 58–60 16.4 8455 ± 35<br />
246250 55°57.811´ 12°36.327´ AAR-8627 Littorina littorea 64–70 16.5 8565 ± 40<br />
246250 55°57.811´ 12°36.327´ AAR-8603 Macoma balthica 270–280 18.7 9475 ± 35<br />
246250 55°57.811´ 12°36.327´ AAR-8601 Woody plant roots 300–310 18.9 8820 ± 40<br />
246280 55°56.104´ 12°36.696´ AAR-8628 Cerastoderma edulis 203–207 18.4 9270 ± 45<br />
246280 55°56.104´ 12°36.696´ AAR-8630 Wood 215–223 18.6 8940 ± 40<br />
246280 55°56.104´ 12°36.696´ AAR-8604 Phragmites australis 220–230 18.6 8975 ± 50<br />
246280 55°56.104´ 12°36.696´ AAR-8631 Corylus avellana 352–356 19.9 8740 ± 35<br />
255150 55°56.144´ 12°37.247´ AAR-8632 Scirpus spp. 190–200 20.3 8765 ± 40<br />
348180 55°40.883´ 12°51.410´ Poz-42496 Cladium mariscus 365–370 15.7 8660 ± 50<br />
348240 55°49.398´ 12°42.976´ Poz-42497 Phragmites australis 400 <strong>26</strong>.0 9240 ± 50<br />
Pilhaken AAR-1225 Corylus avellana 7.8 8120 ± 90<br />
Pilhaken T-10667 Quercus sp. 7.8 7945 ± 75<br />
Svalerumpen K-6036 Tree root 5.9 7680 ± 115<br />
Svalerumpen T-10665 Pinus sylvestris 6.5 8225 ± 95<br />
8765–8981<br />
9840–10 101<br />
10 569–10 781<br />
9907–10 129<br />
10 147–10 333<br />
9003–9109<br />
9113–9301<br />
10 253–10 372<br />
9740–10 115<br />
10 039–10 189<br />
9941–10 193<br />
9951–10 228<br />
9606–9772 ‡<br />
9686–9887<br />
9546–9662<br />
10 298–10 498<br />
8980–9259 $<br />
8649–8977 $<br />
8386–8586 $<br />
9031–9300 $<br />
* Below core top. † Calibration is according to the INTCAL09 data (terrestrial samples) <strong>and</strong> the Marine09 data (marine samples). ‡ Too<br />
young compared with the other dates from the core. $ Fisher (1993).<br />
Pr<strong>of</strong>essor Penck. Coring positions were selected from highresolution<br />
shallow seismic pr<strong>of</strong>iles. The seismic equipment<br />
comprised a boomer, an X-star <strong>and</strong> a sediment echosounder.<br />
Differential GPS was used for navigation. The cores were<br />
split <strong>and</strong> described in the laboratory, <strong>and</strong> selected cores were<br />
subsampled for palaeoecological analyses. The samples were<br />
wet sieved on 0.4, 0.2 <strong>and</strong> 0.1 mm sieves, <strong>and</strong> the residue<br />
left on the sieves was analysed with a dissecting microscope.<br />
Macr<strong>of</strong>ossils were identified using a reference collection. Remains<br />
<strong>of</strong> terrestrial plants <strong>and</strong> marine molluscs were used for<br />
accelerator mass spectrometry (AMS) radiocarbon age determination<br />
(Table 1).<br />
Results<br />
Most <strong>of</strong> the cores consisted <strong>of</strong> Holocene marine clayey <strong>and</strong><br />
silty mud, sometimes with marine s<strong>and</strong> in the upper part.<br />
One core (348180) contained rootlet-peat overlain by sediment<br />
with numerous fruits <strong>of</strong> Cladium mariscus <strong>and</strong> shells<br />
<strong>of</strong> l<strong>and</strong> gastropods. Core 348240 contained sediment with<br />
in situ rootlets tentatively identified as Phragmites australis.<br />
Figure 3 shows an example <strong>of</strong> a macr<strong>of</strong>ossil diagram. A<br />
total <strong>of</strong> 74 taxa were noted, but only 17 <strong>of</strong> them are shown in<br />
the simplified diagram. The sequence coarsens upwards; this<br />
is interpreted as an increased energy level as the sea level rose<br />
<strong>and</strong> the basin was transformed to a fjord. Common remains<br />
<strong>of</strong> tree birch (Betula sect. Albae) <strong>and</strong> pine (Pinus sylvetris, not<br />
shown) as well as rare remains <strong>of</strong> aspen (Populus tremula) indicate<br />
that the shore was not far away.<br />
The lower part <strong>of</strong> the sequence is dominated by lacustrine<br />
taxa, such as the leach Erpobdella sp. <strong>and</strong> the bryozoan<br />
Cristatella mucedo. Shells <strong>and</strong> head shields <strong>of</strong> freshwater<br />
fleas (Cladocera) are also abundant. Macrolimnophytes are<br />
represented by, for example, Najas minor <strong>and</strong> Zannichellia<br />
palustris. Both can tolerate some brackish water influence,<br />
<strong>and</strong> the sediments contain rare remains <strong>of</strong> Hydroidea <strong>and</strong><br />
the ostracode Cythoromorpha fuscata, implying a weak influence<br />
<strong>of</strong> brackish water. The presence <strong>of</strong> Najas minor seeds<br />
indicates that summer temperatures were slightly higher<br />
than at present (Bennike et al. 2001). This may be confirmed<br />
by the common presence <strong>of</strong> Cladium mariscus fruits in core<br />
348180, but this plant is calciphilous <strong>and</strong> its abundance in<br />
early Holocene deposits may reflect that leaching <strong>of</strong> the soils<br />
was not as far advanced as today.<br />
In the middle part <strong>of</strong> the sequence a marked peak in Scirpus<br />
spp. (mainly Scirpus tabernaemontani) fruits is seen, <strong>and</strong><br />
at about the same level Phragmites australis seeds also show<br />
a maximum. This may imply erosion <strong>of</strong> reed beds as the sea<br />
level rose.<br />
At around 220 cm depth Hydrobia ulvae <strong>and</strong> at around<br />
180 cm depth Ruppia sp., Potamogeton pectinatus <strong>and</strong> Littorina<br />
littorea appear, indicating increased salinity, followed<br />
by Nucula nucleus, Corbula gibba <strong>and</strong> other marine species<br />
that indicate a salinity similar to present values.<br />
30
Depth (cm)<br />
0<br />
50<br />
Lithology<br />
Terrestrial Telmatic Lacustrine Brackish Marine<br />
clay<br />
silt<br />
Betula sect. Albae<br />
Phragmites australis<br />
Scirpus spp.<br />
Alisma plantago-aquatica<br />
Najas minor<br />
Erpobdella sp.<br />
Othotrichia sp.<br />
Cristatella mucedo<br />
Zanichellia palustris<br />
Cytheromorpha fuscata<br />
Hydroidea indet.<br />
Potamogeton pectinatus<br />
Ruppia sp.<br />
Hydrobia ulvae<br />
Littorina littorea<br />
Nucula nucleus<br />
Corbula gibba<br />
100<br />
150<br />
200<br />
250<br />
300<br />
350<br />
9.8 ka<br />
20 20 200 2 4 4 10 50 100 4 20 200 5 2 5<br />
Fig. 3. Strongly simplified macr<strong>of</strong>ossil concentration diagram <strong>of</strong> core 255150 from Øresund. The core consists <strong>of</strong> a lower unit <strong>of</strong> horizontally layered clay<br />
<strong>and</strong> silt <strong>and</strong> an upper unit <strong>of</strong> homogenous silty mud. A single sample has been dated to 9686–9887 cal. years BP (Table 1). The red bars show remains that<br />
were not counted.<br />
Sea-level changes<br />
Figure 4 shows a plot <strong>of</strong> the ages <strong>of</strong> radiocarbon dated samples<br />
against depth. We have included a few samples from archaeological<br />
sites (Table 1; Fisher 1993). The full black line<br />
shows relative sea-level changes during the mid-Holocene<br />
according to Christensen (2001), when a number <strong>of</strong> small<br />
transgressions <strong>and</strong> regressions occurred. A similar picture<br />
may have characterised the late Holocene, but due to lack<br />
<strong>of</strong> data we have drawn a straight, stippled line for this time<br />
period.<br />
We have also drawn a straight line for the early Holocene.<br />
We consider this unlikely, but the data do not allow us to<br />
draw a more elaborate line. The marine <strong>and</strong> terrestrial samples<br />
should fall respectively below <strong>and</strong> above the line. However,<br />
it is not possible to draw the line so that this is fulfilled.<br />
This means that some <strong>of</strong> the ages are not correct. Several<br />
explanations for this can be <strong>of</strong>fered. One factor to consider<br />
is differential isostatic rebound. The samples come from a<br />
fairly large region, but most <strong>of</strong> the isostatic rebound occurred<br />
prior to the Holocene, <strong>and</strong> the marine limit only falls from c.<br />
5.5 to c. 4 m from north to south (Christensen 2001). Hence<br />
we suggest that the depth <strong>of</strong> the dated samples should be<br />
moved by only 1–2 m, which does not change the picture.<br />
We consider two other factors more important. One is<br />
the marine reservoir effect, for which a value <strong>of</strong> 400 years<br />
was used, which is common for the region. However, large<br />
variations are seen from place to place, <strong>and</strong> in closed fjords it<br />
can be several hundred years greater than the regional value.<br />
Variations <strong>of</strong> several hundred years may also take place over<br />
time (Olsen et al. 2009). The other factor is that some mollusc<br />
species, such as Macoma balthica used in this study, can<br />
take up old carbon from the sediment, <strong>and</strong> dating <strong>of</strong> such<br />
species may therefore also produce ages that are several hundred<br />
years older than contemporaneous terrestrial samples<br />
(Mangerud et al. 2006).<br />
Dating <strong>of</strong> terrestrial samples can also be problematic,<br />
<strong>and</strong> here we have excluded an age determination <strong>of</strong> a hazel<br />
(Corylus avellana) nut fragment that appears to be too<br />
young. An explanation for this could be contamination by<br />
modern carbon in the laboratory. We consider the other ages<br />
Depth (m)<br />
0<br />
10<br />
20<br />
30<br />
Age (cal. ka BP)<br />
12 10 8 6 4 2 0<br />
Christensen (2001)<br />
This study<br />
Lambeck (1999; model)<br />
Marine<br />
Brackish<br />
Terrestrial<br />
Fig. 4. Tentative curve showing relative sea-level changes in Øresund during<br />
the Holocene, based on radiocarbon dated samples. The curve is compared<br />
with a curve based on numerical, geophysical modelling by Lambeck<br />
(1999). ka: kilo-annum (one thous<strong>and</strong> years).<br />
31
<strong>of</strong> terrestrial material to be reliable <strong>and</strong> have drawn the curve<br />
so that the terrestrial samples fall above it. According to the<br />
curve, the relative sea level rose c. 25 m to the present level<br />
from 10 to 8 ka BP. We have compared the curve with a curve<br />
constructed by Lambeck (1999), using numerical modelling,<br />
which shows a good fit (Fig. 4).<br />
Discussion <strong>and</strong> conclusions<br />
During the earliest Holocene, large parts <strong>of</strong> Øresund were<br />
dry l<strong>and</strong>, but local lakes <strong>and</strong> bogs existed in depressions. The<br />
shore level <strong>of</strong> the southern Baltic Sea <strong>and</strong> Kattegat reached<br />
a lowst<strong>and</strong> (Björck 1995). As the water level in Kattegat began<br />
to rise, a fjord with brackish water <strong>and</strong> limited water exchange<br />
formed in northern Øresund.<br />
Later, the ongoing eustatic sea-level rise led to increased<br />
salinity, <strong>and</strong> the fjord became larger. At the same time, the<br />
water level in the Baltic Basin also increased (Jensen et al.<br />
1999). The threshold in Øresund was flooded between 9 <strong>and</strong><br />
8 ka, <strong>and</strong> Øresund developed into a strait.<br />
The oldest dated marine shell from Øresund gave an age<br />
<strong>of</strong> 10.3–10.4 cal. ka BP, but we suggest that this is somewhat<br />
too old, <strong>and</strong> marine water probably did not reach a level <strong>of</strong><br />
around 25 m b.s.l. until c. 10 ka. However, at the entrance to<br />
Øresund where the water depth is 35–40 m, marine waters<br />
may have begun to enter several millennia earlier according<br />
to Lambeck’s model (Fig. 4). In Storebælt, the oldest dated<br />
marine shell gave an age <strong>of</strong> c. 8100 cal. years BP (Bennike<br />
et al. 2004), in the Lillebælt the oldest shell date is c. 7700<br />
cal. years BP (Bennike & Jensen 2010) <strong>and</strong> in Mecklenburger<br />
Bucht, the oldest reported shell date is c. 7600 cal. years BP<br />
(Bennike & Jensen 1998). These differences partly reflect<br />
different threshold levels. However, freshwater drainage<br />
from the Baltic Basin through Storebælt may also have inhibited<br />
marine bivalves from entering this strait for centuries<br />
or millennia.<br />
Acknowledgements<br />
The captain <strong>and</strong> crew <strong>of</strong> the former R/V Alex<strong>and</strong>er von Humboldt <strong>and</strong><br />
R/V Pr<strong>of</strong>essor Penck <strong>of</strong> the Institut für Ostseeforschung in Warnemünde<br />
are thanked for their help during marine cruises.<br />
References<br />
Andreasen, M.S. 2005: Træk af Øresunds udviklingshistorie gennem<br />
tidlig Holocæn, 151 pp. Unpublished c<strong>and</strong>. scient. thesis, Københavns<br />
Universitet, Danmark.<br />
Bennike, O. & Jensen, J.B. 1998: Late- <strong>and</strong> postglacial shore level changes<br />
in the southwestern Baltic Sea. <strong>Bulletin</strong> <strong>of</strong> the <strong>Geological</strong> Society <strong>of</strong><br />
<strong>Denmark</strong> 45, 27–38.<br />
Bennike, O. & Jensen, J.B. 2010: Postglacial, relative shore-level changes<br />
in Lillebælt, <strong>Denmark</strong>. <strong>Geological</strong> <strong>Survey</strong> <strong>of</strong> <strong>Denmark</strong> <strong>and</strong> Greenl<strong>and</strong><br />
<strong>Bulletin</strong> 23, 37–40.<br />
Bennike, O., Jensen, J.B. & Lemke, W. 2001: Late Quaternary records <strong>of</strong><br />
Najas spp. (Najadaceae) from <strong>Denmark</strong> <strong>and</strong> surroundings. Review <strong>of</strong><br />
Palaeobotany <strong>and</strong> Palynology 114, 259–<strong>26</strong>7.<br />
Bennike, O., Jensen, J.B., Lemke, W., Kuijpers, A. & Lomholt, S. 2004:<br />
Late- <strong>and</strong> postglacial history <strong>of</strong> the Great Belt, <strong>Denmark</strong>. Boreas 33,<br />
18–33.<br />
Björck, S. 1995: A review <strong>of</strong> the history <strong>of</strong> the Baltic Sea, 13.0–8.0 ka BP.<br />
Quaternary International 27, 19–40.<br />
Christensen, C. 2001: Kystbosættelse og havniveauændringer i stenalderen.<br />
In: Jensen, O.L., Sørensen, S.A. & Hansen, K.M. (eds): Danmarks<br />
jægerstenalder – status og perspektiver, 183–193. Hørsholm:<br />
Hørsholm Egns Museum.<br />
Fischer, A. 1993: Stenalderbopladser på bunden af Øresund. Del 1, det<br />
centrale Øresund, 103 pp. Copenhagen: Miljø- og Energiministeriet,<br />
Skov- og Naturstyrelsen.<br />
Houmark-Nielsen, M. & Kjær, K.H. 2003: Southwest Sc<strong>and</strong>inavia, 40–15<br />
kyr BP: palaeogeography <strong>and</strong> environmental change. Journal <strong>of</strong> Quaternary<br />
Science 18, 769–786.<br />
Jensen, J.B., Bennike, O., Witkowski, A., Lemke, W. & Kuijpers, A. 1999:<br />
Early Holocene history <strong>of</strong> the southwestern Baltic Sea: the Ancylus<br />
Lake stage. Boreas 29, 437–453.<br />
Jessen, K. 1923: En undersøisk Mose i Rungsted Havn og de senglaciale<br />
Niveaufor<strong>and</strong>ringer i Øresund. Danmarks Geologiske Undersøgelse<br />
IV. Række 1(18), 18 pp.<br />
Lagerlund, E. & Houmark-Nielsen, M. 1993: Timing <strong>and</strong> pattern <strong>of</strong> the<br />
last deglaciation in the Kattegat region, southwest Sc<strong>and</strong>inavia. Boreas<br />
22, 337–347.<br />
Lambeck, K. 1999: Shoreline displacements in southern-central Sweden<br />
<strong>and</strong> the evolution <strong>of</strong> the Baltic Sea since the last maximum glaciation.<br />
Journal <strong>of</strong> the <strong>Geological</strong> Society (London) 156, 465–486.<br />
Mangerud, J., Bondevik, S., Gulliksen, S., Hufthammer, A.K. & Høisæter,<br />
T. 2006: Marine 14 C reservoir ages for the 19th century whales <strong>and</strong><br />
molluscs from the North Atlantic. Quaternary Science Reviews 25,<br />
3228–3245.<br />
Olsen, J., Rasmussen, P. & Heinemeier, J. 2009: Holocene temporal <strong>and</strong><br />
spatial variation in the radiocarbon reservoir age. Boreas 38, 458–470.<br />
Authors’ addresses<br />
O.B. & J.B.J., <strong>Geological</strong> <strong>Survey</strong> <strong>of</strong> <strong>Denmark</strong> <strong>and</strong> Greenl<strong>and</strong>, Øster Voldgade 10, DK-1350 Copenhagen K, <strong>Denmark</strong>. E-mail: obe@geus.dk<br />
M.S.A. & N.N.N., Department <strong>of</strong> Geography <strong>and</strong> Geology, University <strong>of</strong> Copenhagen, Øster Voldgade 10, DK-1350 Copenhagen K, <strong>Denmark</strong>.<br />
M.M., The Leibniz Institute for Baltic Sea Research, Seestrasse 15, Warnemünde, D-18119 Rostock , Germany.<br />
32
Cliff collapse at Stevns Klint, south-east <strong>Denmark</strong><br />
Stig A. Schack Pedersen <strong>and</strong> Tove Damholt<br />
The scenic coastal cliff <strong>of</strong> Stevns Klint is a classical study locality<br />
that stretches for 15 km along the east coast <strong>of</strong> Sjæll<strong>and</strong><br />
<strong>and</strong> it holds arguably the best exposed Cretaceous−Tertiary<br />
boundary in the world (Fig. 1; Damholt & Surlyk 2012). The<br />
famous boundary separates the s<strong>of</strong>t Cretaceous chalk from<br />
the harder overlying Tertiary bryozoan limestone (Fig. 2),<br />
<strong>and</strong> the difference between the two rock types controls the<br />
character <strong>of</strong> the frequent cliff falls. The relatively s<strong>of</strong>t chalk<br />
at the base is eroded by storm waves <strong>and</strong> is subject to general<br />
debris shedding. The overlying bryozoan limestone, with<br />
its hardgrounds <strong>and</strong> flint layers, is more resistant to erosion<br />
<strong>and</strong> is strong enough to form overhanging projections <strong>of</strong> the<br />
coastal cliff that result in large <strong>and</strong> small recurring collapses.<br />
The position <strong>of</strong> the Cretaceous−Tertiary boundary varies<br />
in altitude along the cliff from about 5 m below sea level in<br />
the southern part <strong>of</strong> the cliff to c. 35 m above sea level in the<br />
northern part. Hence the southern part <strong>of</strong> the cliff mainly<br />
consists <strong>of</strong> hard bryozoan limestone whereas the central <strong>and</strong><br />
northern parts consist <strong>of</strong> s<strong>of</strong>t chalk overlain by bryozoan<br />
limestone. Throughout the entire length <strong>of</strong> the cliff the carbonate<br />
rock is overlain by a few metres <strong>of</strong> glacial till.<br />
Stevns Klint has recently been proposed for inclusion on<br />
the World Heritage Site List (Damholt & Surlyk 2012) <strong>and</strong><br />
as part <strong>of</strong> the nomination process a risk assessment <strong>of</strong> the frequency<br />
<strong>of</strong> cliff collapse was conducted. This paper describes<br />
the analysis <strong>of</strong> erosion <strong>and</strong> rockfall that formed the background<br />
<strong>of</strong> the risk assessment.<br />
Cliff-collapse analysis <strong>of</strong> Stevns Klint<br />
The evaluation <strong>of</strong> the cliff-collapse risk at Stevns Klint included<br />
an analysis <strong>of</strong> the size <strong>and</strong> character <strong>of</strong> the present<br />
overhang, the vulnerability <strong>of</strong> the cliff to erosion <strong>and</strong> rockfall<br />
dimensions. The analysis was based on a photogrammetric<br />
investigation using a series <strong>of</strong> oblique photographs taken<br />
in April 2011. The cliff section was mapped in segments <strong>and</strong><br />
detailed photogrammetric measurements were made using<br />
the s<strong>of</strong>tware SocketSet in the photogrammetric laboratory<br />
at the <strong>Geological</strong> <strong>Survey</strong> <strong>of</strong> <strong>Denmark</strong> <strong>and</strong> Greenl<strong>and</strong>. The<br />
result was stored in a GIS database using the ArcGis format<br />
(Pedersen & Strunck 2011).<br />
Results from a previous photogrammetric investigation<br />
using oblique photographs taken in 1992 (Surlyk et al. 2006)<br />
were compared with our results to describe the changes in<br />
the cliff pr<strong>of</strong>ile over the past 20 years. The general conditions<br />
<strong>of</strong> cliff erosion are described <strong>and</strong> the rockfall dynamics for<br />
the various types <strong>of</strong> cliff collapse are characterised.<br />
1<br />
12°25´E<br />
Hårlev<br />
Hellested<br />
<strong>Denmark</strong><br />
Karise<br />
Sjæll<strong>and</strong><br />
2<br />
3<br />
50 km<br />
Holtug<br />
56°10´N<br />
Lilledal<br />
Storedal<br />
Tommestrup<br />
Stevns Fyr<br />
Kirkevig<br />
Højerup gamle Kirke<br />
Knøsen<br />
Harvig<br />
Stevnsfort<br />
Boesdal<br />
Korsnæb<br />
2 km<br />
Till<br />
Limestone<br />
Clay<br />
Chalk<br />
10 m<br />
Overhang<br />
Talus<br />
Beach<br />
Sea<br />
Fig. 1. Map <strong>of</strong> the Stevns Klint region showing place names mentioned in<br />
the text. The inset map shows the distribution <strong>of</strong> localities with major l<strong>and</strong>slides<br />
in <strong>Denmark</strong>. Red trinangles: the most hazardous slides. Yellow triangles:<br />
clayey l<strong>and</strong>slides. 1: Lønstrup Klint, 2: Stevns Klint, 3: Møns Klint.<br />
Fig. 2. Block diagram illustrating the morphology <strong>and</strong> rock types present<br />
in the Stevns Klint exposures. The succession consists <strong>of</strong> Maastrichtian<br />
chalkish clay, with the famous Cretaceous–Tertiary boundary at the base,<br />
Danian bryozoan limestone <strong>and</strong> Weichselian glacial till.<br />
© 2012 GEUS. <strong>Geological</strong> <strong>Survey</strong> <strong>of</strong> <strong>Denmark</strong> <strong>and</strong> Greenl<strong>and</strong> <strong>Bulletin</strong> <strong>26</strong>, 33–36. Open access: www.geus.dk/publications/bull<br />
33
General erosion conditions at Stevns Klint<br />
The rate <strong>of</strong> erosion is an essential factor for the assessment<br />
<strong>of</strong> cliff collapse. We estimated the average rate <strong>of</strong> coastal erosion<br />
at Stevns Klint to be 15 cm/year, based on comparisons<br />
<strong>of</strong> the position <strong>of</strong> the coastline in 1891 with that in 2010,<br />
provided by the National <strong>Survey</strong> <strong>and</strong> Cadastre. The highest<br />
rate (c. 35 cm/year) was found in the northern part <strong>of</strong> the<br />
cliff between Storedal <strong>and</strong> Lilledal (Fig. 1). In some places,<br />
progradation <strong>of</strong> the coastline occurs where beach ridges form<br />
or where old cliff slides act as wave breakers. Beach ridges are<br />
especially found at Korsnæb in the south (Fig. 1), where the<br />
accumulation rate amounts to 12 cm/year. A l<strong>and</strong>slide north<br />
<strong>of</strong> Kirkevig <strong>and</strong> south <strong>of</strong> Storedal (Fig. 1) has resulted in a<br />
coastline progradation <strong>of</strong> 7–9 cm/year.<br />
Limestone quarrying over the past few hundred years has<br />
also altered the cliff pr<strong>of</strong>ile. Numerous small quarries were<br />
established directly on the cliff with quarry walls inclined<br />
towards the base <strong>of</strong> the limestone <strong>and</strong> resulted in considerable<br />
overhang. The quarries can contribute to cliff points<br />
projecting above the beach.<br />
The erosion rate at Stevns Klint is modest when compared<br />
with the highest rate <strong>of</strong> coastal erosion in <strong>Denmark</strong>, which is<br />
1.25 m/year at Lønstrup Klint that is formed in Quaternary<br />
sediments (Fig. 1; Pedersen 1986).<br />
Types <strong>of</strong> cliff collapses at Stevns Klint<br />
The largest type <strong>of</strong> cliff collapse at Stevns Klint can be called<br />
cliff slides (Fig. 3). This type <strong>of</strong> slide includes a major part <strong>of</strong><br />
the cliff for several tens <strong>of</strong> metres along the coastline which<br />
slide simultaneously. In general a cliff slide takes place along<br />
a steeply dipping surface <strong>and</strong> it involves a volume <strong>of</strong> 5000 to<br />
10 000 m 3 . Prior to a cliff-slide a whole section <strong>of</strong> the chalk<br />
has been eroded away at sea level, creating an undercut below<br />
the limestone <strong>and</strong> resulting in a considerable overhang. The<br />
size <strong>of</strong> the overhang has to be around 10–12 m <strong>and</strong> the thickness<br />
<strong>of</strong> the limestone <strong>and</strong> till in the overhang around 15–18 m<br />
before it becomes unstable.<br />
The most famous event at Stevns Klint occurred in 1928,<br />
when a large cliff slide dramatically tore away the choir <strong>of</strong><br />
Cliff slide<br />
Cliff fall<br />
Cliff with<br />
overhang<br />
before collapse<br />
40 m<br />
Cliff slide<br />
after collapse<br />
A projecting<br />
cliff above overhang<br />
before collapse<br />
40 m<br />
Cliff slide<br />
after collapse<br />
Rockfall<br />
Cliff with<br />
projection overhang<br />
before collapse<br />
Rockfall<br />
Collapse <strong>of</strong> thin overhang<br />
constituting the floor <strong>of</strong> an old<br />
limestone pit<br />
25 m<br />
40 m<br />
Rockfall<br />
after collapse<br />
Rock-bedding<br />
exfoliation<br />
Drop <strong>of</strong> cliff fragments<br />
due to exfoliation erosion<br />
<strong>of</strong> the ro<strong>of</strong> in breakers caves<br />
30 m<br />
20 m<br />
Rockfall<br />
after collapse<br />
Debris<br />
shedding<br />
Talus cones<br />
with accumulation<br />
<strong>of</strong> fragments due to<br />
seasonal exfoliation erosion<br />
Fig. 3. Cliff-collapse types at Stevns Klint. The<br />
most hazardous type is the cliff slide involving<br />
volumes <strong>of</strong> 5000–10 000 m 3 . The volume <strong>of</strong><br />
a cliff fall amounts only to 500–1500 m 3 , but<br />
still a cliff fall is an impressive sight with the<br />
bedding completely preserved in a displaced cliff<br />
fragment. The rockfall is the general type <strong>of</strong> cliff<br />
collapse <strong>and</strong> is illustrated by two examples, <strong>of</strong><br />
which the plate-like overhang corresponds to a<br />
recent cliff collapse at Knøsen. The rock-bedding<br />
exfoliation generates platy 1–10 m 3 limestone<br />
blocks, which drop from the underside <strong>of</strong> the<br />
overhang. The main erosion <strong>of</strong> the cliff is caused<br />
by debris shedding, which produces the talus at<br />
the foot <strong>of</strong> the cliff.<br />
34
Fig. 4. Aerial photograph <strong>of</strong> the cliff section at Højerup gamle Kirke (medieval<br />
church).<br />
Højerup gamle Kirke (a medieval church) that rested on a<br />
15 m thick overhang. The slide continued several tens <strong>of</strong> metres<br />
out into the sea (Fig. 4). Shortly after the incident the<br />
cliff was protected by wave breakers to inhibit wave erosion<br />
<strong>and</strong> to secure the rest <strong>of</strong> the old church. Prior to the spectacular<br />
slide, the undercutting erosion had lasted for 160 years<br />
following an earlier slide in 1767 (Rasmussen 1967). Before<br />
the cliff collapse in 1928, the overhang amounted to c. 12 m<br />
measured perpendicularly to the orientation <strong>of</strong> the cliff <strong>and</strong> a<br />
similar overhang size is estimated for the collapse in 1767. An<br />
overhang <strong>of</strong> c. 12 m is thus regarded as a critical size for cliff<br />
slides where the overhang thickness is c. 15 m.<br />
A significant cliff slide has occurred at Tommestrup (Figs<br />
1, 5A) <strong>and</strong> another one in the inner part <strong>of</strong> Harvig. At both<br />
sites cliff-slide deposits will protect the cliff from erosion for<br />
the next decades.<br />
In order <strong>of</strong> decreasing size, the next type <strong>of</strong> large collapse<br />
is the cliff fall (Fig. 3). Cliff falls only involve isolated projecting<br />
parts <strong>of</strong> the cliff with a considerable overhang <strong>and</strong> their<br />
volumes are 500–1500 m 3 . The cliff fall is a simple drop <strong>of</strong><br />
part <strong>of</strong> the cliff where the bedding <strong>of</strong> the fallen block is preserved<br />
after the fall. The average relation between thickness<br />
<strong>and</strong> depth <strong>of</strong> the overhanging limestone prior to cliff fall is<br />
3 to 2 as illustrated in the cliff fall below the lighthouse <strong>of</strong><br />
Stevns Fyr (Figs 1, 5B).<br />
The third type <strong>of</strong> collapse is classified as rockfalls (Fig. 3),<br />
which in this analysis varies in size from 1 to 500 m 3 . This<br />
type may occur together with block slides, in which bigger<br />
blocks are displaced together with finer-grained material such<br />
as clayey till <strong>and</strong> s<strong>and</strong>. The resulting aggradation <strong>of</strong> material<br />
on the shore after a rockfall is a chaotic breccia. In general,<br />
rockfalls leave a concave escarpment in the cliff <strong>and</strong> the aggradation<br />
<strong>of</strong> debris results in a cone exp<strong>and</strong>ing out into the sea.<br />
Platy rockfall, caused by rock-bedding exfoliation, involves<br />
rock volumes <strong>of</strong> around 1 m 3 <strong>and</strong> is a significant type<br />
<strong>of</strong> collapse at Stevns Klint (Fig. 3). Rock-bedding exfoliation<br />
occurs in caves eroded by storm waves in the lower part <strong>of</strong><br />
the cliff. Layers are peeled <strong>of</strong>f from the ro<strong>of</strong>s <strong>of</strong> the cave due<br />
to exfoliation, <strong>and</strong> dish-shaped fragments <strong>of</strong> rock drop to the<br />
cave floor. Caves are prominent north <strong>of</strong> Boesdal (Fig. 1) <strong>and</strong><br />
A<br />
B<br />
Fig. 5. Cliff sections showing various types <strong>of</strong> rockfalls at Stevns Klint. A: Cliff slide at Tommestrup. B: Cliff fall at the lighthouse <strong>of</strong> Stevns Fyr.<br />
35
Fig. 6. The cliff collapse at Knøsen, which occurred in November 2011.<br />
The weight <strong>of</strong> fill deposited on top <strong>of</strong> the section added to the load <strong>of</strong> the<br />
overhang.<br />
north <strong>of</strong> Stevnsfort where they are formed in limestone <strong>and</strong><br />
extend up to 9 m into the cliff. Caves formed in chalk occur<br />
south <strong>of</strong> Storedal <strong>and</strong> at Holtug.<br />
Finally, fragments <strong>of</strong> rock may fall from the cliff due to<br />
general shedding <strong>of</strong> debris (Fig. 3). In general, the material resulting<br />
from debris shedding is pebbles <strong>and</strong> cobbles, whereas<br />
clasts <strong>of</strong> boulder-size are loosened only occasionally from the<br />
cliff surface. The result is seen as an apron <strong>of</strong> talus along the<br />
foot <strong>of</strong> the cliff, typically with irregular conical shapes. Debris<br />
shedding results from contraction <strong>and</strong> expansion due to<br />
seasonal variation <strong>of</strong> frost <strong>and</strong> thaw in winter time <strong>and</strong> desiccation<br />
during the summer. The rate <strong>of</strong> erosion due to debris<br />
shedding is equal to the average rate <strong>of</strong> erosion, i.e. 15 cm/year.<br />
Assessment <strong>of</strong> cliff collapse hazards at<br />
Stevns Klint<br />
The size <strong>of</strong> the overhang is considered to be the most important<br />
factor in the assessment analysis <strong>of</strong> rockfall hazards at<br />
Stevns Klint. However, the likelihood <strong>of</strong> a collapse also depends<br />
on the thickness <strong>of</strong> the overhang. The shear strength<br />
<strong>of</strong> a rock increases with increasing normal pressure, which<br />
increases with the thickness <strong>of</strong> the rock. Therefore an overhang<br />
with a thickness <strong>of</strong> 20 m is more stable than one with<br />
a thickness <strong>of</strong> 10 m. The degree <strong>of</strong> exposure to the sea is also<br />
important, primarily because the exposed parts <strong>of</strong> the cliff<br />
are affected by wave erosion <strong>and</strong> secondly because the s<strong>of</strong>tness<br />
<strong>of</strong> chalk increases by salt water spray (Mortimore et al.<br />
2004). Finally, the assessment <strong>of</strong> risk is proportional to the<br />
number <strong>of</strong> visitors. A more detailed description <strong>of</strong> the assessment<br />
is provided in a full report (Pedersen & Strunck 2011).<br />
After our analysis, a rockfall <strong>of</strong> c. 300 m 3 occurred at<br />
Knøsen (Fig. 1). The rockfall was discovered on 6 November<br />
2011. It was caused by the collapse <strong>of</strong> a 5 m overhang<br />
with a thickness <strong>of</strong> 2 m that constituted the floor <strong>of</strong> an old<br />
limestone quarry (Figs 3, 6). The floor carried the weight<br />
<strong>of</strong> removed overburden, in the form <strong>of</strong> clayey till <strong>and</strong> chertrich<br />
limestone rubble. The collapse shows that an overhang<br />
with a thickness <strong>of</strong> just 2 m can become unstable even if the<br />
overhang is only 5 m. In other instances an overhang with<br />
a thickness <strong>of</strong> 15 m can be stable even with an undercut <strong>of</strong><br />
more than 10 m.<br />
Discussion <strong>and</strong> conclusions<br />
Our cliff-collapse hazard assessment <strong>of</strong> Stevns Klint is<br />
based on an investigation <strong>of</strong> cliff collapse processes along the<br />
cliff. Five types <strong>of</strong> cliff collapse are recognised: cliff slides,<br />
cliff fall, rockfall, platy rockfall caused by rock-bedding<br />
exfoliation <strong>and</strong> debris shedding. The cliff slides have large<br />
volumes <strong>and</strong> occur at low frequencies (1/100 years) whereas<br />
debris shedding <strong>of</strong> low volume occurs at high frequencies<br />
(seasonal). The resulting average rate <strong>of</strong> erosion is 15 cm/<br />
year. Rockfalls may be initiated by cycles <strong>of</strong> frost <strong>and</strong> thaw,<br />
saturation <strong>of</strong> cracks following rainy periods or desiccation<br />
after dry periods, but actual prediction <strong>of</strong> cliff collapses is<br />
not possible at present.<br />
References<br />
Damholt, T. & Surlyk, F. 2012: Nomination <strong>of</strong> Stevns Klint for inclusion<br />
in the World Heritage List, 159 pp. St. Heddinge: Østsjæll<strong>and</strong>s Museum.<br />
Mortimore, R.N., Stone, K.J., Lawrence, J. & Duperret, A. 2004: Chalk<br />
physical properties <strong>and</strong> cliff stability. In: Mortimore, R.N. & Duperret<br />
(eds): Coastal chalk cliff instability. <strong>Geological</strong> Society (London),<br />
Engineering Geology Special Publications 20, 75–88.<br />
Pedersen, S.A.S. 1986: Rubjerg klint, Rubjerg klit, årsag og virkning. Varv<br />
3, 84–98.<br />
Pedersen, S.A.S. & Strunck, M.N. 2011: Vurdering af fjeldskredsrisiko på<br />
Stevns Klint. Danmarks og Grønl<strong>and</strong>s Geologiske Undersøgelse Rapport<br />
2011/93, 100 pp.<br />
Rasmussen, H.W. 1967: Skrivekridtet og kalkstenene. In: Nørvang, A. &<br />
Meyer, T.J. (eds): Danmarks Natur 1, L<strong>and</strong>skabets opståen, 131–160.<br />
Copenhagen: Politikens Forlag.<br />
Surlyk, F., Damholt, T. & Bjerager, M. 2006: Stevns Klint: Uppermost<br />
Maastrichtian chalk, Cretaceous–Tertiary boundary, <strong>and</strong> lower Danian<br />
bryozoan mound complex. <strong>Bulletin</strong> <strong>of</strong> the <strong>Geological</strong> Society <strong>of</strong><br />
<strong>Denmark</strong> 54, 1–48.<br />
Authors’ addresses<br />
S.A.S.P., <strong>Geological</strong> <strong>Survey</strong> <strong>of</strong> <strong>Denmark</strong> <strong>and</strong> Greenl<strong>and</strong>, Øster Voldgade 10, DK-1350 Copenhagen K, <strong>Denmark</strong>. E-mail: sasp@geus.dk<br />
T.D., Østsjæll<strong>and</strong>s Museum, Højerup Bygade 38, DK-4660 St. Heddinge, <strong>Denmark</strong>.<br />
36
Mean annual temperature<br />
Shallow geothermal energy in <strong>Denmark</strong><br />
Thomas Vangkilde-Pedersen, Claus Ditlefsen <strong>and</strong> Anker Lajer Højberg<br />
The use <strong>of</strong> shallow geothermal energy instead <strong>of</strong> fossil fuels<br />
can lead to substantial reductions in CO 2 emissions. However,<br />
the use <strong>of</strong> shallow geothermal energy in <strong>Denmark</strong> is<br />
limited compared to, e.g. Sweden <strong>and</strong> Germany <strong>and</strong> we still<br />
lack know-how <strong>and</strong> experience with its use in <strong>Denmark</strong>. In<br />
co-operation with research <strong>and</strong> industry partners, the <strong>Geological</strong><br />
<strong>Survey</strong> <strong>of</strong> <strong>Denmark</strong> <strong>and</strong> Greenl<strong>and</strong> is conducting a<br />
three-year project GeoEnergy, Tools for ground-source heating<br />
<strong>and</strong> cooling based on closed-loop boreholes (www.geoenergi.org).<br />
The objective <strong>of</strong> the project is to acquire knowledge <strong>and</strong> develop<br />
tools <strong>and</strong> best practice for the design <strong>and</strong> installation<br />
<strong>of</strong> shallow geothermal energy systems.<br />
Exploitation <strong>of</strong> shallow geothermal energy<br />
In the shallow subsurface, solar energy absorbed <strong>and</strong> stored<br />
in the ground determines the temperature, whereas the temperature<br />
gradient is determined by the heat flux from the<br />
interior <strong>of</strong> the Earth. In <strong>Denmark</strong> the net insolation is c.<br />
400 kWh/m 2 /year <strong>and</strong> in the upper few hundred metres, the<br />
heat flux from the interior is c. 0.20 to 0.35 kWh/m 2 /year<br />
(Balling et al. 1992). The geothermal gradient in <strong>Denmark</strong><br />
is 25–30°C per kilometre (Mathiesen et al. 2009) with an<br />
upper zone <strong>of</strong> seasonal variations. The thickness <strong>of</strong> this zone<br />
has not been investigated in detail in <strong>Denmark</strong>, but a general<br />
thickness <strong>of</strong> 10–20 m may be expected (Fig. 1; Banks 2008).<br />
The shallow geothermal energy is exploited in combination<br />
with heat pumps bringing the temperature to the desired<br />
operating temperature <strong>of</strong> the heating (or cooling) system. A<br />
ground-source heat pump, however, requires energy in the<br />
form <strong>of</strong> heat or cold from the ground as well as electricity for<br />
the operation <strong>of</strong> the pump itself.<br />
The energy extraction from the ground can be based on either<br />
open-loop systems or closed-loop systems. In open-loop<br />
systems, groundwater from a production well is used directly<br />
as an energy source for the heat pump <strong>and</strong> returned to the<br />
aquifer via an injection well. The efficiency is high due to a<br />
constant <strong>and</strong> relatively high temperature <strong>of</strong> the water (typically<br />
8–10°C), but a suitable aquifer with sufficient yield is required<br />
<strong>and</strong> conflicts <strong>of</strong> interest with neighbouring installations or<br />
nearby drinking water catchment may arise. In closed-loop<br />
systems, water with antifreeze is circulated in the ground in<br />
high-density polyethylene pipes <strong>and</strong> acts as a heat exchanger.<br />
The heat capacity <strong>of</strong> soil <strong>and</strong> groundwater is relatively high,<br />
whereas the thermal conductivity is moderate <strong>and</strong> dependent<br />
on the local hydrogeology. Therefore the heat exchanger must<br />
be relatively large, i.e., the polyethylene pipes relatively long.<br />
They can either be installed horizontally at a depth <strong>of</strong> c. 1 m<br />
(horizontal closed-loop systems), or vertically in a borehole<br />
(borehole heat exchanger or vertical closed-loop system; Fig. 2).<br />
Vertical systems are only influenced by seasonal temperature<br />
variations in the upper zone down to 10–20 m <strong>and</strong> have<br />
a higher efficiency than horizontal systems due to a higher<br />
<strong>and</strong> constant ground temperature. On the other h<strong>and</strong>, the<br />
temperature regime around a vertical system is only slowly<br />
re-generated <strong>and</strong> careful design with respect to the energy<br />
dem<strong>and</strong> is necessary, <strong>and</strong> an accurate estimate <strong>of</strong> the energy<br />
consumption is needed to optimise the design <strong>of</strong> the system.<br />
Alternating operations with heating during winter <strong>and</strong> cooling<br />
during summer, supplemented with seasonal storage <strong>of</strong><br />
Insolation<br />
925–1000 kWh m –2 year –1<br />
Heat transfer<br />
via conduction, convection<br />
Atmospheric<br />
<strong>and</strong> evapotranspiration<br />
longwave<br />
radiation Back radiation<br />
Net radiation<br />
c. 400 kWh m –2 year –1<br />
Winter Summer Seasonal<br />
changes<br />
Temperature<br />
Geothermal heat flux<br />
0.20–0.35 kWh m –2 year –1<br />
Geothermal gradient c. 25–30° km –1<br />
Fig. 1. Schematic block diagram showing the geothermal gradient <strong>and</strong><br />
magnitude <strong>of</strong> geothermal heat flux <strong>and</strong> insolation with average values for<br />
<strong>Denmark</strong> as well as the seasonal zone <strong>of</strong> fluctuation in temperature (modified<br />
from Banks 2008).<br />
© 2012 GEUS. <strong>Geological</strong> <strong>Survey</strong> <strong>of</strong> <strong>Denmark</strong> <strong>and</strong> Greenl<strong>and</strong> <strong>Bulletin</strong> <strong>26</strong>, 37–40. Open access: www.geus.dk/publications/bull<br />
37
heat from, e.g. solar panels, can optimise the efficiency <strong>of</strong><br />
vertical systems.<br />
A<br />
B<br />
Groundwater <strong>and</strong> environmental<br />
protection<br />
Protection <strong>of</strong> the environment <strong>and</strong> groundwater is <strong>of</strong> paramount<br />
importance in shallow geothermal projects. The<br />
main issues are leakage <strong>of</strong> water with antifreeze, cross-connecting<br />
different aquifers, seepage <strong>of</strong> surface water along the<br />
borehole, drilling into artesian aquifers <strong>and</strong> unwanted thermal<br />
effects. All steps in the production <strong>and</strong> installation <strong>of</strong><br />
a ground loop must be designed for optimum tightness <strong>and</strong><br />
longevity <strong>of</strong> the loop. Installation procedures must minimise<br />
the risk <strong>of</strong> damaging the pipes, <strong>and</strong> a pressure test <strong>of</strong> the pipes<br />
must be carried out. The legislation also specifies which antifreeze<br />
agents can be used in the ground loop – only non-toxic<br />
<strong>and</strong> easily biodegradable fluids are allowed.<br />
Closed-loop boreholes must be sealed with low permeable<br />
grout in order to prevent contact between the surface <strong>and</strong><br />
aquifers or between individual aquifers <strong>and</strong> the quality <strong>of</strong><br />
the sealing determines the protection <strong>of</strong> the groundwater, as<br />
for all other boreholes. Grouting is also necessary to improve<br />
the heat transfer from the ground to the pipes <strong>and</strong> in actual<br />
practice the entire borehole is sealed with grout.<br />
Perforation <strong>of</strong> an artesian aquifer can cause large quantities<br />
<strong>of</strong> water to press through the drill pipe disrupting the<br />
grout. To avoid drilling closed-loop boreholes into artesian<br />
aquifers, local hydraulic heads must be checked prior to drilling<br />
(Ditlefsen 2012).<br />
Possible problems with thermal pollution for horizontal<br />
systems are described by Banks (2008). Extraction <strong>of</strong> heat<br />
may cause freezing <strong>of</strong> the ground <strong>and</strong> frost heaving, which can<br />
Fig. 2. Principles <strong>of</strong> horizontal (A) <strong>and</strong> vertical (B) closed-loop, groundsource<br />
heat-pump systems.<br />
potentially damage surface structures, buried installations<br />
<strong>and</strong> plant roots. Warming <strong>of</strong> the ground may cause vapour<br />
migration <strong>and</strong> progressive drying <strong>and</strong> perhaps even shrinkage<br />
<strong>of</strong> soils. Significant heating <strong>of</strong> the ground can also lead to<br />
consolidation <strong>and</strong> settling in clayey, unconsolidated soils <strong>and</strong><br />
thermal interference between neighbouring ground-source<br />
energy schemes may occur. In the Danish legislation for<br />
closed-loop systems safety distances to other ground heat exchangers<br />
<strong>and</strong> to extraction wells for drinking water are specified,<br />
but not to buildings <strong>and</strong> other structures. For open- loop<br />
systems the limitations in the allowable thermal influence on<br />
the groundwater are rather strict.<br />
Evaluation <strong>of</strong> thermal properties <strong>of</strong><br />
Danish sediments<br />
In <strong>Denmark</strong> vertical systems are normally drilled to depths <strong>of</strong><br />
50–200 m. In order to evaluate the possible energy extraction<br />
from a specific new site <strong>and</strong> estimate the required depth <strong>and</strong><br />
number <strong>of</strong> boreholes, information about the geology <strong>and</strong> hydrogeology<br />
is crucial. The greater part <strong>of</strong> <strong>Denmark</strong> is under-<br />
A<br />
57°<br />
10°E<br />
Miocene<br />
Oligocene<br />
Eocene<br />
Paleocene<br />
Paleocene limestone<br />
Cretaceous chalk<br />
Older than chalk<br />
14°E<br />
B<br />
Thickness (m)<br />
0<br />
1–10<br />
11–20<br />
21–30<br />
31–40<br />
41–50<br />
51–60<br />
61–70<br />
71–80<br />
81–90<br />
91–100<br />
101–125<br />
1<strong>26</strong>–150<br />
151–175<br />
176–320<br />
55°N<br />
100 km<br />
100 km<br />
Fig. 3. Maps showing the pre-Quaternary geology (A) <strong>and</strong> the thickness <strong>of</strong> Quaternary sediments (B) in <strong>Denmark</strong>.<br />
38
Table 1. Thermal conductivity <strong>of</strong> different sediment <strong>and</strong> rock types<br />
Sediment/rock Thermal conductivity Recommended values Estimated specific heat extraction rate (W m –1 )<br />
W mK –1 W mK –1 VDI (2001) MCS (2011)<br />
Clay <strong>and</strong> silt (dry) 0.4–1.0* 0.5* – –<br />
Water-saturated clay <strong>and</strong> silt 1.1–3.1* 1.8* 35–50 21–34<br />
Palaeogene clay, <strong>Denmark</strong> 1.34–1.56 † – – –<br />
S<strong>and</strong> (dry) 0.3–0.9* 0.4* 25 –<br />
Water-saturated s<strong>and</strong> 2.0–3.0* 2.4* 65–80 <strong>26</strong>–45<br />
Water-saturated gravel 1.6–2.5* 1.8* – –<br />
Till/loam 1.1–2.9* 2.4* – –<br />
Clayey till, <strong>Denmark</strong> 2.00–2.31 ‡ – – –<br />
Chalk, Engl<strong>and</strong> 1.79 ± 0.54§ – – –<br />
Chalk, <strong>Denmark</strong> 1.45–1.86 † – – –<br />
Quartzite 5.5–7.5§ 6.0§ – –<br />
Granite 3–4§ 3.4§ 65–85 33–45<br />
* VDI (2010). † Balling et al. (1981). ‡ Porsvig (1986). § Banks (2008).<br />
lain by a sedimentary basin dominated by shallow marine to<br />
deep marine clastic <strong>and</strong> biogenic sediments (Fig. 3A), overlain<br />
by Quaternary deposits. In some areas the Quaternary cover<br />
is thin <strong>and</strong> limestone or Tertiary s<strong>and</strong>, silt <strong>and</strong> mud are found<br />
close to the surface. Thick successions <strong>of</strong> Quaternary sediments<br />
are common in the northern <strong>and</strong> south-western part <strong>of</strong><br />
the country (Fig. 3B). In these areas the Quaternary sediments<br />
are dominated by marine <strong>and</strong> glaciomarine deposits. Thick<br />
successions <strong>of</strong> Quaternary deposits are also found in buried<br />
valleys (Jørgensen & S<strong>and</strong>ersen 2006). The geological variation<br />
within the Quaternary sediments is high <strong>and</strong> regionalscale<br />
geological models are not sufficiently detailed to estimate<br />
the possible energy extraction from a vertical system. Local information<br />
from boreholes <strong>and</strong> geophysical data are necessary to<br />
map the Quaternary strata <strong>and</strong> the elevation <strong>of</strong> the water table.<br />
The potential flow <strong>of</strong> energy in <strong>and</strong> out <strong>of</strong> a vertical system<br />
is determined by the heat capacity <strong>and</strong> the thermal conductivity<br />
<strong>of</strong> the sediments or rocks surrounding the borehole.<br />
The process is dominated by heat conduction, but advective<br />
transport in the groundwater also plays a role. The thermal<br />
conductivity <strong>of</strong> geological materials depends on the porosity,<br />
water content <strong>and</strong> mineral composition. Rocks <strong>and</strong> sediments<br />
with a high content <strong>of</strong> quartz have high thermal conductivity,<br />
whereas porous, unsaturated sediments have low thermal<br />
conductivity due to the presence <strong>of</strong> air in the pore space.<br />
Thermal conductivity values for different rock <strong>and</strong> sediment<br />
types are compiled in Table 1 <strong>and</strong> show large variations for<br />
saturated clay <strong>and</strong> silt as well as for till deposits, which are<br />
common sediments in <strong>Denmark</strong>. Most <strong>of</strong> the values are from<br />
Germany <strong>and</strong> the UK <strong>and</strong> to get more information about<br />
common Danish lithologies new measurements are required.<br />
Modelling <strong>of</strong> near-surface heat flow<br />
in a Danish context<br />
Various model systems are available for calculating the efficiency<br />
<strong>of</strong> vertical systems in terms <strong>of</strong> energy extraction,<br />
ranging from simple <strong>and</strong> easy-to-use models to complex numerical<br />
models. The easy-to-use models consider the longterm<br />
aspects assuming homogeneous <strong>and</strong> constant subsurface<br />
thermal properties, whereas the complex models also<br />
take into account the effect <strong>of</strong> alternating system operation,<br />
heterogeneity in thermal properties as well as groundwater<br />
flow. Assuming st<strong>and</strong>ard design <strong>and</strong> 1800 hours <strong>of</strong> production<br />
per year, specific heat extraction rates for selected sediment<br />
<strong>and</strong> rock types have been estimated for German (VDI<br />
2001) <strong>and</strong> British (MCS 2011) conditions based on vertical<br />
systems with double- <strong>and</strong> single-loop pipes, respectively<br />
(Table 1). The values indicate large variations between different<br />
sediment types <strong>and</strong> within specific geological facies as<br />
well as between the German <strong>and</strong> British studies, stressing the<br />
importance <strong>of</strong> establishing valid st<strong>and</strong>ard values applicable<br />
for Danish conditions <strong>and</strong> different systems. The possible<br />
energy extraction for 100 m vertical, closed-loop boreholes<br />
has been calculated for four simple geological successions<br />
(Fig. 4). The estimated energy extraction for the most unfavourable<br />
<strong>of</strong> the geological scenarios (7560 kWh) is only c.<br />
60% <strong>of</strong> the energy extraction for the most favourable (12 537<br />
kWh), thus giving an indication <strong>of</strong> the possible effect <strong>of</strong> different<br />
geological settings.<br />
In addition to heterogeneity in geology <strong>and</strong> thermal properties,<br />
the efficiency <strong>of</strong> vertical systems is affected by possible<br />
groundwater flow. If the system is operating only in heating<br />
or cooling mode, groundwater flow will have a positive impact<br />
on the efficiency due to the continuous supply <strong>of</strong> energy.<br />
On the other h<strong>and</strong>, groundwater flow will have a negative<br />
39
Depth (m)<br />
0<br />
50<br />
100<br />
S<strong>and</strong>, unsaturated, 25 W m –1<br />
S<strong>and</strong>, saturated, 72 W m –1<br />
Clay, saturated, 42 W m –1<br />
Fig. 4. Four simple geological successions with average, specific heat-extraction<br />
rates from Table 1 VDI (2001). The possible energy extraction<br />
has been calculated to 12 537; 10 373; 9576 <strong>and</strong> 7560 kWh (left to right),<br />
based on 1800 hours <strong>of</strong> production per year (borehole length × specific<br />
heat extraction rate × hours <strong>of</strong> production).<br />
impact on systems using the subsurface for seasonal energy<br />
storage, because the flow will transport heat <strong>and</strong> cold away<br />
from the vertical system. To evaluate the importance <strong>of</strong> the<br />
hydrogeological heterogeneity observed in <strong>Denmark</strong>, modelling<br />
will be carried out based on a complex numerical model<br />
that allows the inclusion <strong>of</strong> subsurface heterogeneity as well<br />
as groundwater flow. The aim <strong>of</strong> the modelling is to identify<br />
the aspects that must be considered in the design phase <strong>of</strong><br />
closed loop systems, <strong>and</strong> estimate the maximum energy that<br />
can be extracted under different hydrogeological conditions<br />
typical in <strong>Denmark</strong>.<br />
Perspectives for shallow geothermal<br />
energy in <strong>Denmark</strong><br />
Shallow geothermal energy is a competitive, renewable energy<br />
resource as domestic heat pumps typically produce 3–4<br />
times the amount <strong>of</strong> energy they consume in the form <strong>of</strong><br />
electricity. Depending on how the electricity is generated<br />
<strong>and</strong> taking the generation <strong>and</strong> transmission loss into consideration,<br />
heating a building using ground-source energy<br />
produces only half <strong>of</strong> the CO 2 emission <strong>of</strong> fossil fuels used<br />
directly for heating (Banks 2008). Nevertheless, the application<br />
<strong>of</strong> shallow geothermal energy in <strong>Denmark</strong> is relatively<br />
limited. In 2008, the number <strong>of</strong> ground-source heat-pump<br />
installations was c. 25 000 (Willumsen 2008), with the vast<br />
majority being horizontal systems. So far, only a few hundred<br />
<strong>of</strong> the installed systems are based on closed-loop boreholes,<br />
<strong>and</strong> the number <strong>of</strong> groundwater-based open-loop systems is<br />
limited to a few tens. Hopefully the GeoEnergy project can<br />
pave the way for a wider use <strong>of</strong> shallow geothermal energy,<br />
but in order to fully exploit the resource, a systematic assessment<br />
<strong>of</strong> the potential is needed, including the potential for<br />
seasonal storage <strong>of</strong> waste heat. With the continuous focus<br />
on climate change <strong>and</strong> energy consumption, the number <strong>of</strong><br />
installations is likely to increase rapidly in the coming years,<br />
especially after a political decision has been made to phase<br />
out domestic oil burners starting in 2012. The manifold exploitation<br />
<strong>of</strong> various shallow geological resources, including<br />
shallow geothermal energy, drinking water <strong>and</strong> minerals,<br />
will increase the dem<strong>and</strong> for resource management <strong>and</strong> data<br />
availability.<br />
Acknowledgement<br />
The EUDP programme <strong>of</strong> the Danish Energy Agency is thanked for financial<br />
support to the GeoEnergy project.<br />
References<br />
Balling, N., Kristiansen, J.I., Breiner, N., Poulsen, K.D., Rasmussen, R. &<br />
Saxov, S. 1981: Geothermal measurements <strong>and</strong> subsurface temperature<br />
modelling in <strong>Denmark</strong>. GeoSkrifter 16, 176 pp.<br />
Balling, N., Nielsen, S.B., Christiansen, H.S., Christensen, L.D. & Poulsen,<br />
S. 1992: The subsurface thermal regime <strong>and</strong> temperature <strong>of</strong> geothermal<br />
reservoirs in <strong>Denmark</strong>. Synthesis report to the Commission <strong>of</strong><br />
the European Communities, Contract EN3G-0029-DK, 91 pp. Århus:<br />
Department <strong>of</strong> Earth Sciences, University <strong>of</strong> Aarhus.<br />
Banks, D. 2008: An introduction to thermogeology: ground source heating<br />
<strong>and</strong> cooling, 351 pp. Oxford: Blackwell.<br />
Ditlefsen, C. 2012: D1 Geologi og jordvarmeboringer. Oversigt over geologiske<br />
forhold af betydning ved etablering af jordvarmeboringer. GeoEnergi<br />
– Energianlæg baseret på jordvarmeboringer – udvikling af markedsfremmende<br />
værktøjer og best practice. EUDP projekt, J.nr. 64011-0003.<br />
Jørgensen, F. & S<strong>and</strong>ersen, P.B.E. 2006: Buried <strong>and</strong> open tunnel valleys<br />
in <strong>Denmark</strong> – erosion beneath multiple ice sheets. Quaternary Science<br />
Reviews 25, 1339–1363.<br />
Mathiesen, A., Kristensen, L., Bidstrup, T. & Nielsen, L.H. 2009: Vurdering<br />
af det geotermiske potentiale i Danmark. Danmarks og Grønl<strong>and</strong>s<br />
Geologiske Undersøgelse Rapport 2009/59, 30 pp.<br />
MCS (Microgeneration Certification Scheme) 2011: Microgeneration<br />
installation st<strong>and</strong>ard: MIS 3005. Issue 3.0. London: Department <strong>of</strong><br />
Energy <strong>and</strong> Climate Change.<br />
Porsvig, M. 1986: Varmeovergangsforhold omkring jordslanger. Energiministeriets<br />
varmepumpeforskningsprogram 33, 56 pp.<br />
VDI (Verein Deutscher Ingenieure) 2001: Thermische Nutzung des Untergrundes:<br />
Erdgekoppelte Wärmepumpenanlagen. Richtlinie 4640,<br />
Blatt 2, 43 pp. Düsseldorf: Verein Deutscher Ingenieure.<br />
VDI (Verein Deutscher Ingenieure) 2010: Thermische Nutzung des Untergrundes:<br />
Grundlagen, Genehmigungen, Umweltaspekte. Richtlinie<br />
4640, Blatt 1, 33 pp. Düsseldorf: Verein Deutscher Ingenieure.<br />
Willumsen, B. 2008: Jordvarmeanlæg. Teknologier og risiko for jord- og<br />
grundv<strong>and</strong>sforurening, 176 pp. Miljøprojekt nr. 1238. Copenhagen:<br />
Miljøstyrelsen.<br />
Authors’ address<br />
<strong>Geological</strong> <strong>Survey</strong> <strong>of</strong> <strong>Denmark</strong> <strong>and</strong> Greenl<strong>and</strong>, Lyseng Allé 1, DK-8270 Højbjerg, <strong>Denmark</strong>. E-mail: tvp@geus.dk<br />
40
Efforts to include geological <strong>and</strong> geodetic observations in<br />
the assessment <strong>of</strong> earthquake activity in <strong>Denmark</strong><br />
Søren Gregersen <strong>and</strong> Peter H. Voss<br />
Assessment <strong>of</strong> earthquake hazard is improved if geological<br />
<strong>and</strong> geodetic data are included in addition to seismological<br />
data. In earthquake regions like Japan <strong>and</strong> California,<br />
palaeoseismology combines data from geology <strong>and</strong> seismology,<br />
<strong>and</strong> networks <strong>of</strong> permanent GPS (global positioning<br />
system) stations situated on bedrock supplement the networks<br />
<strong>of</strong> seismographs. A combination <strong>of</strong> seismographs <strong>and</strong><br />
GPS stations on ice is also used in current studies <strong>of</strong> glacial<br />
earthquakes in Greenl<strong>and</strong>. In <strong>Denmark</strong> only broad-scale<br />
geodetic coverage is available (Khan et al. 2005) <strong>and</strong> only a<br />
few examples <strong>of</strong> geological input are found in the literature.<br />
However, more thorough geodetic evaluations <strong>of</strong> deformations<br />
are currently made in Nordic co-operation projects <strong>and</strong><br />
we are looking forward to learn about the results. Also the<br />
number <strong>of</strong> permanent GPS stations in <strong>Denmark</strong> has recently<br />
been increased from 3 to 13. The geological input is limited<br />
but may hold some potential, <strong>and</strong> the aim <strong>of</strong> this article is<br />
to evaluate this. We also discuss new investigations <strong>of</strong> recent<br />
geological movements, both in projects on post-glacial uplift<br />
(<strong>and</strong> accompanying horizontal deformation) <strong>of</strong> Sc<strong>and</strong>inavia,<br />
<strong>and</strong> more locally <strong>of</strong> geological indicators <strong>of</strong> uplift in selected<br />
areas. As seismologists, we are interested in a homogeneous<br />
evaluation <strong>of</strong> geological indicators in all <strong>of</strong> <strong>Denmark</strong> <strong>and</strong> its<br />
neighbouring areas.<br />
In two recent seismological papers, we emphasised the<br />
very low earthquake activity in <strong>Denmark</strong>, even in the geologically<br />
significant Sorgenfrei–Tornquist Zone (Gregersen<br />
& Voss 2009, 2010). The recorded earthquake activity over<br />
Fig. 1. Map <strong>of</strong> North-West Europe showing the<br />
locations <strong>of</strong> earthquakes recorded from January<br />
1970 to December 2004. Earthquakes in<br />
<strong>Denmark</strong> are from a catalogue at the <strong>Geological</strong><br />
<strong>Survey</strong> <strong>of</strong> <strong>Denmark</strong> <strong>and</strong> Greenl<strong>and</strong>, <strong>and</strong> the<br />
other earthquake locations are from a Sc<strong>and</strong>inavian<br />
catalogue at Helsinki University. Thick<br />
black lines show large postglacial faults c. 9000<br />
years old, according to Lagerbäck (1991). The<br />
curves in central Sc<strong>and</strong>inavia show an early<br />
common Sc<strong>and</strong>inavian compilation in project<br />
BIFROST <strong>of</strong> uplift (mm/year). Updated earthquake<br />
files for <strong>Denmark</strong> are available at .geus.dk<br />
under seismology, <strong>and</strong> for the rest <strong>of</strong> Sc<strong>and</strong>inavia<br />
at www.seismo.helsinki.fi. The map is modified<br />
from Gregersen & Voss (2009).<br />
© 2012 GEUS. <strong>Geological</strong> <strong>Survey</strong> <strong>of</strong> <strong>Denmark</strong> <strong>and</strong> Greenl<strong>and</strong> <strong>Bulletin</strong> <strong>26</strong>, 41–44. Open access: www.geus.dk/publications/bull<br />
41
the last hundred years is even lower than that <strong>of</strong> northern<br />
Sc<strong>and</strong>inavia (Fig.1). Historical reports from the past thous<strong>and</strong><br />
years tell the same story. The stresses in <strong>Denmark</strong> are<br />
fairly homogeneous, mainly influenced by plate motion <strong>and</strong><br />
only marginally by postglacial uplift, <strong>and</strong> the earthquake<br />
hazard is considered low (Giardini 1999). Here, we assess the<br />
longer geological perspective in an attempt to improve long<br />
term evaluation <strong>of</strong> hazard <strong>and</strong> to demonstrate the need for<br />
further geological investigations <strong>of</strong> stresses <strong>and</strong> strains in a<br />
time scale <strong>of</strong> several thous<strong>and</strong>s <strong>of</strong> years. The area discussed<br />
is shown in Fig. 2, which also shows generalised, relative sealevel<br />
changes after the time <strong>of</strong> the Littorina Sea in the mid-<br />
Holocene (Christensen 2001).<br />
Discussion <strong>of</strong> selected areas<br />
Carlsberg fault, Copenhagen – This fault is one <strong>of</strong> the most<br />
significant faults in the Copenhagen area (Rosenkrantz<br />
1937; Nielsen & Thybo 2004), <strong>and</strong> it has been very important<br />
for the Carlsberg brewery because large quantities <strong>of</strong> water<br />
could be extracted from the fault zone for brewing beer.<br />
Along the fault zone, cracks in house walls are observed, but<br />
it is an open question whether it is worse than in the adjacent<br />
area (Ovesen et al. 2002; O.W. Christensen, personal<br />
communication 1990s; B. Larsen, personal communication<br />
2009; L. Nielsen, personal communication 2009). No earthquakes<br />
have been recorded near the fault. A more quantitative<br />
area mapping around the fault is needed.<br />
Misfits in the Danish geodetic system have been ascribed<br />
to the Carlsberg fault. The base line <strong>of</strong> the distance measuring<br />
system on the isl<strong>and</strong> <strong>of</strong> Amager near Copenhagen has<br />
0<br />
2<br />
10°E<br />
12<br />
Skagerrak 10<br />
8<br />
6<br />
4<br />
<strong>Denmark</strong><br />
Jyll<strong>and</strong><br />
Hobro<br />
10°E<br />
23<br />
20<br />
Læsø<br />
Aalborg<br />
Kattegat<br />
Anholt<br />
8300 BC<br />
8000 BC<br />
7200 BC<br />
Rügen<br />
6600 BC<br />
Skåne<br />
6200 BC<br />
Amager<br />
Copenhagen<br />
5600 BC<br />
6500 BC<br />
Sweden<br />
56°N<br />
5600/4500 BC<br />
50 km<br />
Fig. 2. Map <strong>of</strong> south-western Sc<strong>and</strong>inavia, showing maximum elevations<br />
(m) <strong>and</strong> ages <strong>of</strong> shorelines from the Littorina Sea, according to Christensen<br />
(2001). The circles show areas discussed in the text.<br />
been described as deformed (Ovesen et al. 2002). However,<br />
a more probable explanation <strong>of</strong> this so-called deformation<br />
is movements <strong>of</strong> near-surface sediments at one <strong>of</strong> the end<br />
points <strong>of</strong> the base line before 1911 due to winter freezing <strong>and</strong><br />
thawing (M. Aarestrup, personal communication 1991; K.<br />
Engsager, personal communication 2009). We consider it<br />
unlikely that deformation occurred in 1930 as suggsted by<br />
Rosenkrantz (1937) since no movements were registered between<br />
1911 <strong>and</strong> 1933.<br />
Another base line on Amager (in Danish called ‘prøvebane’,<br />
trial distance) has been reported as deformed (Ovesen<br />
et al. 2002). In this case the geodetic problem was identified<br />
from observations which showed that there were problems<br />
with the end point as mentioned above. One <strong>of</strong> the ends is<br />
sloping strangely, <strong>and</strong> it must have been disturbed by winter<br />
freezing <strong>and</strong> thawing (K. Engsager, personal communication<br />
2009). We conclude that the Carlsberg fault is not active at<br />
present.<br />
Læsø – Indications <strong>of</strong> a large fault with a displacement <strong>of</strong> 4 m<br />
have been reported from geological investigations <strong>of</strong> s<strong>and</strong><br />
deposits younger than 7000 years on the isl<strong>and</strong> <strong>of</strong> Læsø in<br />
Kattegat (Hansen 1977, 1980, 1994). No other sedimentary<br />
indications <strong>of</strong> earthquakes have been identified. Hansen suggested<br />
that Læsø does not fit into the post-glacial uplift pattern<br />
<strong>of</strong> the neighbouring coasts <strong>of</strong> Kattegat, but according<br />
to Christensen (2001) the elevations <strong>of</strong> the highest Littorina<br />
Sea shorelines on Læsø fit well into the regional pattern for<br />
Kattegat (Fig. 2).<br />
A number <strong>of</strong> transgressions <strong>and</strong> regressions occurred over<br />
a period <strong>of</strong> several thous<strong>and</strong> years in the mid-Holocene in<br />
the Kattegat region (Christensen 2001). The last <strong>of</strong> these<br />
so-called Littorina transgressions ended around 4500 years<br />
ago. The structural differences in the Sorgenfrei–Tornquist<br />
Zone tell about an older geological regime, not the present<br />
intraplate inactivity.<br />
Hansen (1980) presented a curve showing changes <strong>of</strong> tilt<br />
<strong>of</strong> a succession <strong>of</strong> shorelines based on shoreline elevation<br />
measurements without any evaluation <strong>of</strong> uncertainties. Each<br />
point in Fig. 3 represents an average <strong>of</strong> 10–15 individual<br />
measurements that span an elevation <strong>of</strong> c. 1 m. This 1 m can<br />
be taken as a rough estimate <strong>of</strong> four times the st<strong>and</strong>ard error.<br />
If an estimated st<strong>and</strong>ard error <strong>of</strong> 0.25 m is taken into<br />
account, the argument for variations in tilting becomes nonsignificant.<br />
We find that the observed differences <strong>and</strong> the<br />
st<strong>and</strong>ard errors are <strong>of</strong> the same magnitude (Fig. 3). The zigzag<br />
line <strong>of</strong> Hansen (1980) goes through the average values <strong>of</strong><br />
the slopes <strong>and</strong> the data may as well be explained by a straight<br />
line, i.e. within the belt <strong>of</strong> intervals determined by averages<br />
± one st<strong>and</strong>ard error. Hence we conclude that the differences<br />
42
Fig. 3. Tilt <strong>of</strong> shorelines on Læsø (Hansen 1980,<br />
fig. 5) with our estimated st<strong>and</strong>ard errors added.<br />
Shorelines (dots) are plotted on the horizontal<br />
axis, with the youngest to the right. When the<br />
st<strong>and</strong>ard errors are included it appears that jumps<br />
in tilt values are not significant. The data can be<br />
interpreted as a steady change <strong>of</strong> tilt, approximated<br />
by the thick sloping line in the diagram,<br />
which is generally within one st<strong>and</strong>ard error <strong>and</strong><br />
certainly within two st<strong>and</strong>ard errors.<br />
Tilt (mm/km towards the south-west)<br />
200<br />
100<br />
0<br />
–100<br />
Shoreline with one st<strong>and</strong>ard deviation<br />
–200<br />
Oldest Succession <strong>of</strong> beaches Youngest<br />
c. 1000 BC<br />
in average tilt cannot be used as an argument for discontinuous<br />
<strong>and</strong> occasionally reverse tilting. The data may as well<br />
agree with steady uplift <strong>and</strong> tilting. The same magnitude <strong>of</strong><br />
st<strong>and</strong>ard errors in the use <strong>of</strong> geological markers for tilt measurements,<br />
<strong>and</strong> for elevation measurements with respect to sea<br />
level, is used in a recent work on Anholt, also in the Kattegat.<br />
When changes in sea currents <strong>and</strong> stormy weather which can<br />
influence the development <strong>of</strong> shorelines are added, the observations<br />
on shoreline tilting (Fig. 3) cannot be used on their<br />
own as an argument for tectonic tilting.<br />
On the basis <strong>of</strong> our assessment <strong>of</strong> old <strong>and</strong> new arguments<br />
we conclude that the bedrock subsurface below Læsø has<br />
been uplifted by the same amount as the rest <strong>of</strong> the Kattegat<br />
region, regularly or with minor irregularities. This means<br />
that there was no Læsø earthquake 4000–5000 years ago.<br />
The lower-lying parts <strong>of</strong> Læsø with many well-documented<br />
beach ridges have their own exciting history (Hansen et al.<br />
2011), best explained by regular postglacial uplift together<br />
with coastal development influenced by sea currents, climate<br />
<strong>and</strong> weather. One hundred kilometres south-east <strong>of</strong> Læsø, in<br />
the Kattegat Sea, where earthquakes have been registered<br />
(Fig. 1), neotectonic small-scale faulting has been recognised<br />
(Jensen et al. 2002).<br />
Northern Jyll<strong>and</strong> – It has been suggested that a bend in the<br />
geodetic <strong>and</strong> geological uplift pattern north <strong>of</strong> Aalborg may<br />
reflect a fault (Lykke-Andersen & Borre 2000). However,<br />
according to follow-up measurements the bend could also<br />
be due to gradual creep with no indications <strong>of</strong> earthquakes<br />
(Gregersen & Schmidt 2001).<br />
Central Jyll<strong>and</strong> – Conspicuous so-called fracture valleys in<br />
central Jyll<strong>and</strong> were recently discussed by Jakobsen & Pedersen<br />
(2009). The valleys may be related to a deep fault zone, but<br />
no evidence exists for present-day earthquakes in this region.<br />
West coast <strong>of</strong> Sweden – Several localities on the west coast <strong>of</strong><br />
Sweden have been discussed by Mörner (2003, 2009). Signs<br />
<strong>of</strong> geological movements at these localities include variations<br />
in postglacial uplift <strong>of</strong> shorelines, faulting <strong>and</strong> rock deformation<br />
in a few cases, <strong>and</strong> in many incidences rock slides.<br />
Also signs <strong>of</strong> liquefaction were found at several stratigraphic<br />
levels. We encourage a geological <strong>and</strong> geophysical assessment<br />
<strong>of</strong> these localities.<br />
Skåne – In Skåne in southern Sweden repeated GPS measurements<br />
have indicated differential movements <strong>of</strong> the two<br />
sides <strong>of</strong> the Sorgenfrei–Tornquist Zone. However, these<br />
measurements are not considered statistically significant by<br />
Swedish geodesists.<br />
Skagerrak – In Skagerrak <strong>and</strong> southern Norway more earthquake<br />
activity takes place than in <strong>Denmark</strong> (Fig. 1). An assessment<br />
similar to the present one has been carried out by<br />
Olesen et al. 2004.<br />
Rügen – The bending phenomenon mentioned above is not<br />
confined to northern Jyll<strong>and</strong>. Similar geodetic observations<br />
were reported from the isl<strong>and</strong> <strong>of</strong> Rügen in northern Germany<br />
(Fig. 2; R. Dietrich, personal communication 2008).<br />
However, seismological investigations show that northernmost<br />
Germany is an earthquake-free region like southernmost<br />
<strong>Denmark</strong>.<br />
Discussion <strong>and</strong> conclusions<br />
We have evaluated <strong>and</strong> discussed a number <strong>of</strong> reports on geological<br />
or geodetic indications <strong>of</strong> earthquake activity in <strong>Denmark</strong>.<br />
We found no signs <strong>of</strong> geologically recent faulting or<br />
recent crustal deformation. This corroborates that <strong>Denmark</strong><br />
<strong>and</strong> its neighbouring areas are characterised by a small earthquake<br />
potential. The largest earthquakes recorded had a magnitude<br />
<strong>of</strong> just below 6 on the Richter scale. This is supported<br />
by the decrease <strong>of</strong> uplift stress after the last deglaciation. We<br />
conclude that earthquake hazard evaluations in <strong>Denmark</strong> in<br />
the foreseeable future are best based on seismological data<br />
43
alone (Gregersen & Voss 2009). The earthquake zones are<br />
those found by historical <strong>and</strong> instrumental seismological<br />
investigations in the seas around <strong>Denmark</strong> (Fig. 1). Unfortunately<br />
this does not mean that destructive earthquakes<br />
cannot happen. The situation in <strong>Denmark</strong> is parallel to that<br />
<strong>of</strong> other intraplate regions. A totally unexpected destructive<br />
earthquake happens once every decade somewhere on Earth<br />
within a quiet lithospheric plate. Geodynamic stresses exist,<br />
which are occasionally released in structurally weak zones.<br />
Based on our present state <strong>of</strong> knowledge <strong>of</strong> seismology,<br />
geodesy <strong>and</strong> geology, we cannot foresee in which fault zone<br />
or region an earthquake may happen in <strong>Denmark</strong>, but no<br />
region is directly earthquake prone. Not even the very significant<br />
Sorgenfrei–Tornquist Zone is an earthquake zone<br />
(Gregersen et al. 2011).<br />
Acknowledgments<br />
We appreciate many good discussions with our colleagues Jens Morten<br />
Hansen, Peter Johannesen, Lars Henrik Nielsen, Tine B. Larsen, Tanni<br />
J. Abramovitz, Abbas Khan, Karsten Engsager, Holger Lykke-Andersen,<br />
Torben Bidstrup, Birger Larsen, Jørgen Leth, Lars Nielsen, Henrik Olsen,<br />
Hans Thybo <strong>and</strong> Lars B. Clemmensen.<br />
References<br />
Christensen, C. 2001: Kystbosættelse og havniveauændringer i stenalderen.<br />
In: Jensen, O.L., Sørensen, S.A. & Hansen, K.M. (eds): Danmarks<br />
jægerstenalder – status og perspektiver, 183–193. Hørsholm:<br />
Hørsholm Egns Museum.<br />
Giardini, D. (ed.) 1999: The global seismic hazard assessment program<br />
(GSHAP) 1992–1999. Annali di Ge<strong>of</strong>isica 42, 280 pp.<br />
Gregersen, S. & Schmidt, K. 2001: Tektonik i Danmark. Sorgenfrei–Tornquist<br />
Zonen. Geologisk Nyt 1, 16–17. Aarhus: Aarhus Universitet.<br />
Gregersen, S. & Voss, P. 2009: Stress change over short geological time: the<br />
case <strong>of</strong> Sc<strong>and</strong>inavia over 9,000 years since the Ice Age. In: Reicherter,<br />
K., Michetti, A.M. & Silva Barroso, P.G. (eds): Palaeoseismology: historical<br />
<strong>and</strong> prehistorical records <strong>of</strong> earthquake ground effects for seismic<br />
hazard assessment. <strong>Geological</strong> Society Special Publications (London)<br />
316, 173–178.<br />
Gregersen S. & Voss, P. 2010: Irregularities in Sc<strong>and</strong>inavian postglacial<br />
uplift/subsidence in time scales tens, hundreds, thous<strong>and</strong>s <strong>of</strong> years.<br />
Journal <strong>of</strong> Geodynamics 50, 27–31.<br />
Gregersen, S., Larsen, T.B. & Voss, P. 2011: Jordskælv i Sorgenfrei–Tornquist<br />
Zonen? Geoviden 1, 18–19. København: Geocenter Danmark.<br />
Hansen, J.M. 1977: Sedimentary history <strong>of</strong> the isl<strong>and</strong> Læsø, <strong>Denmark</strong>.<br />
<strong>Bulletin</strong> <strong>of</strong> the <strong>Geological</strong> Society <strong>of</strong> <strong>Denmark</strong> <strong>26</strong>, 217–236.<br />
Hansen, J.M. 1980: Læsøs postglaciale udvikling i relation til den Fennosk<strong>and</strong>iske<br />
r<strong>and</strong>zone. Dansk Geologisk Forening, Årsskrift for 1979,<br />
23–30.<br />
Hansen, J.M. 1994: Læsøs tilblivelse og l<strong>and</strong>skaber – om øen der rokker og<br />
hopper, 55 pp. København: Danmarks Geologiske Undersøgelse.<br />
Hansen, J.M., Aagaard, T. & Binderup, M. 2011: Absolute sea levels <strong>and</strong><br />
isostatic changes <strong>of</strong> the eastern North Sea to central Baltic region during<br />
the last 900 years. Boreas 41, 180–208.<br />
Jakobsen, P.R. & Pedersen S.A.S. 2009: Fracture valleys in central Jyll<strong>and</strong><br />
– a neotectonic feature. <strong>Geological</strong> <strong>Survey</strong> <strong>of</strong> <strong>Denmark</strong> <strong>and</strong> Greenl<strong>and</strong><br />
<strong>Bulletin</strong> 17, 33–36.<br />
Jensen, J.B., Petersen, K.S., Konradi, P., Kuijpers, A., Bennike, O., Lemke,<br />
W. & Endler, R. 2002: Neotectonics, sea-level changes <strong>and</strong> biological<br />
evolution in the Fennosc<strong>and</strong>ian Border Zone <strong>of</strong> the southern Kattegat<br />
Sea. Boreas 31, 133–150.<br />
Khan, S., Knudsen, P. & Tscherning, C. 2005: Crustal deformations at<br />
permanent GPS sites in <strong>Denmark</strong>. In: Sansò, F. (ed.): A Window on<br />
the future <strong>of</strong> geodesy. Proceedings <strong>of</strong> the International Association <strong>of</strong><br />
Geodesy Symposia 128, 556–560.<br />
Lagerbäck, R. 1991: Seismically deformed sediments in the Lansjärv area,<br />
northern Sweden. SKB Technical Report 91-17, 58 pp. Stockholm:<br />
Svensk Kärnbränsleh<strong>and</strong>tering AB.<br />
Lykke-Andersen, H. & Borre, K. 2000: Aktiv tektonik i Danmark: der<br />
er liv i Sorgenfrei–Tornquist Zonen. Geologisk Nyt 6, 12–13. Aarhus:<br />
Aarhus Universitet.<br />
Mörner, N.-A. 2003: Paleoseismicity <strong>of</strong> Sweden, a novel paradigm, 320 pp.<br />
Stockholm: University <strong>of</strong> Stockholm.<br />
Mörner, N.-A. 2009: Late Holocene earthquake geology in Sweden. In:<br />
Reicherter, K., Michetti, A.M. & Silva Barroso, P.G. (eds): Palaeoseismology:<br />
historical <strong>and</strong> prehistorical records <strong>of</strong> earthquake ground effects<br />
for seismic hazard assessment. <strong>Geological</strong> Society <strong>of</strong> Special Publications<br />
(London) 316, 179–188.<br />
Nielsen, L. & Thybo, H. 2004: Location <strong>of</strong> the Carlsberg Fault zone from<br />
seismic controlled-source fan recordings. Geophysical Research Letters<br />
31, L07621, http://dx.doi.org/10.1029/2004GL019603<br />
Olesen, O., Blikra, L.H., Braathen, A., Dehls, J.F., Olsen, L., Rise, L., Roberts,<br />
D., Riis, F., Faleide, J.I. & Anda, E. 2004: Neotectonic deformation<br />
in Norway <strong>and</strong> its implications: a review. Norwegian Journal <strong>of</strong><br />
Geology 84, 3–34.<br />
Ovesen, N.K., Blem, H., Gregersen, S., Møller, H.M.F. & Frederiksen, J.K.<br />
2002: Recent terrain-movements in Copenhagen. Dansk Geoteknisk<br />
Forenings <strong>Bulletin</strong> 19, 183–192.<br />
Rosenkrantz, A. 1937: Bemærkninger om det østsjæll<strong>and</strong>ske Daniens<br />
stratigrafi og tektonik. Meddelelse fra Dansk Geologisk Forening 9,<br />
199–212.<br />
Authors’ address<br />
<strong>Geological</strong> <strong>Survey</strong> <strong>of</strong> <strong>Denmark</strong> <strong>and</strong> Greenl<strong>and</strong>, Øster Voldgade 10, DK-1350 Copenhagen K, <strong>Denmark</strong>. E-mail: sg@geus.dk<br />
44
Results <strong>of</strong> monitoring groundwater above the natural gas<br />
underground storage at Stenlille, <strong>Denmark</strong><br />
Troels Laier<br />
Groundwater in the Stenlille area is regularly analysed for<br />
light hydrocarbons after a natural gas underground storage<br />
facility was established there in 1989. The monitoring<br />
is carried out by the <strong>Geological</strong> <strong>Survey</strong> <strong>of</strong> <strong>Denmark</strong> <strong>and</strong><br />
Greenl<strong>and</strong> <strong>and</strong> is part <strong>of</strong> the authorities’ requirements for<br />
the environmental approval <strong>of</strong> the natural gas storage run<br />
by the state-owned Danish Oil <strong>and</strong> Gas company DONG<br />
A/S. Groundwater from observation wells <strong>and</strong> water wells<br />
in the area was analysed every month during the first year <strong>of</strong><br />
operation <strong>and</strong> four times a year in the following years. More<br />
frequent analyses are undertaken on special occasions.<br />
Underground gas storage<br />
Two underground storage facilities were established in <strong>Denmark</strong><br />
in order to buffer the supply <strong>of</strong> gas from the North<br />
Sea, one in salt caverns in Jyll<strong>and</strong>, the other in a deep aquifer<br />
at a depth <strong>of</strong> 1500 m near Stenlille (Fig. 1). Natural gas<br />
underground storage is possible in deep sealed geological<br />
formations with good reservoir quality <strong>and</strong> covered by tight<br />
caprock. These conditions are met by an anticlinal structure<br />
near Stenlille with a vertical closure <strong>of</strong> c. 35 m covering an<br />
area <strong>of</strong> 14 km 2 . The Gassum Formation forms the reservoir<br />
where gas is stored by displacing formation water. The formation<br />
is <strong>of</strong> Late Triassic age <strong>and</strong> consits <strong>of</strong> cyclically interbedded<br />
s<strong>and</strong>stone <strong>and</strong> marine mudstone that were deposited as a<br />
result <strong>of</strong> changes in the depositional environment (Hamberg<br />
& Nielsen 2000). The overlying 300 m thick Lower Jurassic<br />
Fjerritslev Formation, which consists <strong>of</strong> claystone, serves as<br />
a caprock for the s<strong>and</strong>stone reservoir (Fig. 2). The total estimated<br />
storage capacity <strong>of</strong> the Stenlille structure equals three<br />
billion normal cubic metres, <strong>and</strong> due to reservoir heterogeneities,<br />
gas is stored in several separate zones (Fig. 1). The gas<br />
storage is operated by 14 wells for injection <strong>and</strong> withdrawal<br />
<strong>of</strong> gas <strong>and</strong> six wells used for observational purposes, most <strong>of</strong><br />
them in the periphery <strong>of</strong> the structure.<br />
1 km<br />
11°35´E<br />
55°33´N<br />
55°33´N<br />
257 502<br />
520<br />
Nyrup<br />
Stenlille<br />
558<br />
400<br />
Fig. 1. Map <strong>of</strong> the Stenlille area showing the<br />
location <strong>of</strong> water wells (blue), observation wells<br />
for shallow aquifers (green, inset map) <strong>and</strong> deep<br />
wells (red). The extent <strong>of</strong> the underground gas<br />
storage is indicated by coloured areas, where yellow<br />
<strong>and</strong> red show different gas zones.<br />
Stenlille<br />
518<br />
529<br />
K2<br />
St14<br />
100 m<br />
K1<br />
St2<br />
407<br />
© 2012 GEUS. <strong>Geological</strong> <strong>Survey</strong> <strong>of</strong> <strong>Denmark</strong> <strong>and</strong> Greenl<strong>and</strong> <strong>Bulletin</strong> <strong>26</strong>, 45–48. Open access: www.geus.dk/publications/bull<br />
45
0<br />
500<br />
Depth (m)<br />
WSW<br />
Elevation (m)<br />
40<br />
20<br />
0<br />
–20<br />
–40<br />
K2<br />
K1<br />
Gas after leakage in August 1995<br />
558<br />
???<br />
? ?<br />
ENE<br />
1000<br />
–60<br />
–80<br />
1500<br />
Paleocene calcareous s<strong>and</strong><br />
Paleocene marine clay<br />
Glacial till<br />
Meltwater s<strong>and</strong><br />
500 m<br />
Clay, s<strong>and</strong>, till<br />
Limestone<br />
Claystone<br />
S<strong>and</strong>stone<br />
Zechstein salt<br />
Baseline study<br />
Gas<br />
Well for injection <strong>and</strong> production<br />
Observation well<br />
Fig. 2. Sketch <strong>of</strong> the natural gas underground storage facility at Stenlille. A<br />
Zechstein salt pillow is located below the surface. The development <strong>of</strong> the<br />
salt pillow has deformed the overlying beds into a dome. S<strong>and</strong>stone: Gassum<br />
Formation s<strong>and</strong>stone (Late Triassic), claystone: Fjerritslev Formation<br />
(Early Jurassic).<br />
As part <strong>of</strong> the pre-investigation <strong>of</strong> the Stenlille stucture, a<br />
baseline study was carried out in order to characterise the<br />
type <strong>and</strong> concentration <strong>of</strong> natural hydrocarbons present in<br />
the rocks within <strong>and</strong> above the future gas storage reservoir.<br />
Analyses <strong>of</strong> hundreds <strong>of</strong> drill cuttings from deep wells indicated<br />
no significant occurrence <strong>of</strong> hydrocarbons, although<br />
low concentrations <strong>of</strong> in situ generated hydrocarbons appeared<br />
to be present in the organic rich Fjerritslev Formation<br />
(Laier & Øbro 2009). A very low concentration <strong>of</strong> methane<br />
(30 mg/l), possibly <strong>of</strong> microbial origin, was observed in the<br />
saline formation water <strong>of</strong> the Gassum Formation (Laier &<br />
Øbro 2009).<br />
Bacterial methane in groundwater<br />
Methane is generally not analysed in groundwater unless<br />
its presence is suspected; therefore very few analyses existed<br />
prior to the baseline study. Groundwater from 21 water wells<br />
in the Stenlille area was sampled, <strong>and</strong> methane was found to<br />
occur in low concentrations (0.01–0.49 mg/l) in all <strong>of</strong> them<br />
except two (Laier 1989). No higher hydrocarbons were detected<br />
in any <strong>of</strong> the samples. Stable isotope analyses <strong>of</strong> nine <strong>of</strong><br />
Fig. 3. <strong>Geological</strong> cross section <strong>of</strong> the upper layers <strong>of</strong> the Stenlille natural<br />
gas underground storage. The locations <strong>of</strong> wells K1, K2 <strong>and</strong> 558 are shown<br />
on Fig. 1. The red colour indicates the distribution <strong>of</strong> gas after the St14<br />
leakage in August 1995 (for details see Laier 2010).<br />
the samples showed that the methane was <strong>of</strong> bacterial origin<br />
(δ 13 C CH4 : –90 to –62‰; Laier 1989). The bacterial methane<br />
most likely comes from peat layers in the area. Most water<br />
wells in the area draw water from glacial meltwater s<strong>and</strong><br />
found at depths <strong>of</strong> 20–30 m <strong>and</strong> overlain <strong>and</strong> underlain by<br />
glacial till (Fig. 3).<br />
Bacterial methane (0.40 mg/l; δ 13 C 1 = –64.5‰) was also<br />
found in groundwater from the shallow filter <strong>of</strong> the K1 observation<br />
well located adjacent to the first injection well (St2;<br />
Fig. 1). The methane concentration in the brackish water<br />
from the deep filter (Fig. 3) was too low (0.02 mg/l) to permit<br />
analysis <strong>of</strong> its carbon isotope ratio.<br />
Natural gas storage<br />
Storage <strong>of</strong> natural gas from the Danish part <strong>of</strong> the North<br />
Sea began in July 1989. The gas is dominated by methane<br />
(91%) with a little ethane (5.5%) <strong>and</strong> propane (2.0%). The<br />
average δ 13 C CH4 value <strong>of</strong> methane is –46.6‰. The composition<br />
<strong>of</strong> the natural gas stored in the Stenlille structure is<br />
markedly different from that <strong>of</strong> the gas dissolved in shallow<br />
groundwater (Fig. 4). This makes it fairly easy to distinguish<br />
between the two types <strong>of</strong> gas <strong>and</strong> identify even minor leaks<br />
from the deep gas storage reservoir at the near surface.<br />
Groundwater methane<br />
A fairly large variation in the concentration <strong>of</strong> methane from<br />
0.4 to 3.7 mg/l was observed in water samples from a shallow<br />
filter <strong>of</strong> the K1 observation well in the early 1990s, but not<br />
in samples from a deeper filter, which had very low values<br />
(0.02 mg/l; Fig. 5). If the variation in methane concentra-<br />
46
C 1<br />
/(C 2<br />
+C 3<br />
)<br />
10 5<br />
remained at the low levels measured prior to the storage <strong>of</strong><br />
natural gas (Fig. 6).<br />
Microbial gas<br />
10 3<br />
10 2<br />
10<br />
Thermogenic<br />
gas<br />
0<br />
–100<br />
–80 –60 –40 –20<br />
10 4 δ 13 C CH4<br />
(‰)<br />
Dissolved gas in the upper aquifer <strong>of</strong> the K1 observation well<br />
Dissolved gas in the shallow aquifers<br />
Natural gas from the Danish North Sea<br />
Dissolved gas in the lower aquifer <strong>of</strong> K1 from the gas leakage in 1995<br />
Fig. 4. Classification diagram showing the chemical <strong>and</strong> isotopic composition<br />
<strong>of</strong> natural gas from the Danish North Sea <strong>and</strong> dissolved gas in shallow<br />
aquifers. The C 1<br />
/(C 2<br />
+C 3<br />
) ratio for the dissolved gas represents a minimum<br />
value as both ethane <strong>and</strong> propane were below detection limit for all<br />
dissolved gases. The white areas are typical <strong>of</strong> thermogenic <strong>and</strong> microbial<br />
gas <strong>and</strong> the grey area represents either mixtures <strong>of</strong> these gas types or gas <strong>of</strong><br />
unknown origin. C 1<br />
: methane concentration, C 2<br />
: ethane concentration,<br />
C 3<br />
: propane concentration.<br />
Minor gas leakage<br />
In September 1995, gas bubbles were observed at the terrain<br />
surface near the newly drilled St14 injection well (Fig. 1), <strong>and</strong><br />
a sample <strong>of</strong> the gas was immediately collected <strong>and</strong> analysed.<br />
Its chemical <strong>and</strong> isotopic composition was similar to that <strong>of</strong><br />
the gas being stored (Fig. 4), so there was little doubt that<br />
gas leaked from the new well. The leak was due to technical<br />
problems during gas injection (Laier & Øbro 2009) <strong>and</strong> was<br />
quickly stopped, but an estimated 5000 m 3 <strong>of</strong> gas was lost to<br />
geological formations above the reservoir cap rock.<br />
A week after the leak was observed at the surface, a significant<br />
increase in the dissolved gas concentration was measured<br />
in the deep filter <strong>of</strong> the K1 well, located 250 m from<br />
the St14 well. This gas had almost the same composition as<br />
the reservoir gas (Fig. 4). No free gas was observed during<br />
collection <strong>of</strong> water from this level, so it was concluded that<br />
all the gas was dissolved at this time. However, for the gas<br />
to migrate from St14 to K1 during a week, a free gas phase<br />
CH 4<br />
(mg/l)<br />
10<br />
8<br />
6<br />
4<br />
2<br />
Start <strong>of</strong><br />
injection<br />
10<br />
27 mg/l<br />
35–45 m<br />
98–128 m<br />
0<br />
89 91 93 95 97 99 01 03 05 07 09 11<br />
Year<br />
Fig 5. Methane concentration in groundwater from the K1 observation<br />
well. The sudden increase in dissolved methane was noted one week after<br />
the gas leakage at St14.<br />
tion was due to a leakage around the nearby St2 well (Fig. 1),<br />
the opposite might be expected with an increase in methane<br />
at the deeper level first. In order to deduce the origin <strong>of</strong> the<br />
methane, isotope analyses were regularly performed during<br />
the first year <strong>of</strong> sampling. The isotope ratio <strong>of</strong> the methane<br />
(δ 13 C CH4 : –62 to –52‰) together with a lack <strong>of</strong> higher hydrocarbons<br />
indicate that the methane was bacterial in origin<br />
(Fig. 4), though its source remains unknown. Since the methane<br />
concentration was highest during the first years after<br />
drilling the K1 well, one may speculate whether hydrogen<br />
generated by anaerobic corrosion <strong>of</strong> iron filings from drilling<br />
may have led to methane formation as suggested by Daniels<br />
et al. (1987). Groundwater methane concentration in water<br />
from the Stenlille waterworks <strong>and</strong> from private water wells<br />
CH 4<br />
(mg/l)<br />
CH 4<br />
(mg/l)<br />
0.2<br />
0.1<br />
0<br />
0.4<br />
0.3<br />
0.2<br />
0.1<br />
257<br />
520<br />
502<br />
518<br />
529<br />
400<br />
558<br />
407<br />
0<br />
89 91 93 95 97 99 01 03 05 07 09 11<br />
Year<br />
Fig. 6. Methane concentration in groundwater from wells supplying the<br />
Stenlille waterworks (A) <strong>and</strong> from private wells (B).<br />
A<br />
B<br />
47
must have existed at some point, although free gas was never<br />
observed in the samples from any <strong>of</strong> the wells. The concentration<br />
<strong>of</strong> dissolved gas has decreased since the gas leakage<br />
occurred <strong>and</strong> is presently below 1 mg/l, <strong>and</strong> its composition<br />
has hardly changed.<br />
Traces <strong>of</strong> natural gas in a water well near<br />
Nyrup<br />
The regular groundwater survey revealed a significant increase<br />
in methane in October 2009, from 0.1 to over 0.4<br />
mg/l, in water well 558 south-west <strong>of</strong> Nyrup (Figs 1, 6B).<br />
Traces <strong>of</strong> ethane <strong>and</strong> propane were also observed, indicating<br />
the presence <strong>of</strong> natural gas in low concentrations. An<br />
immediate follow-up investigation indicated a high proportion<br />
<strong>of</strong> old groundwater in the well due to a low pumping<br />
rate. When the normal pumping rate for the well was reestablished,<br />
groundwater methane dropped below 0.1 mg/l<br />
<strong>and</strong> the higher hydrocarbons ethane <strong>and</strong> propane could no<br />
longer be detected. It was concluded that minor amounts <strong>of</strong><br />
natural gas from the leak in 1995 had migrated into the Paleocene<br />
calcareous s<strong>and</strong> below Paleocene marine clay <strong>of</strong> low<br />
permeability <strong>and</strong> reached the water well near Nyrup (Fig. 3;<br />
Laier 2010). A buried valley at Nyrup may have allowed gas<br />
to migrate to shallower depths where it gradually dissolved<br />
in groundwater (Jørgensen & S<strong>and</strong>ersen 2009). The very<br />
low pumping rate in well 558 resulted in less infiltration <strong>of</strong><br />
younger groundwater, which enabled the detection <strong>of</strong> natural<br />
gas in older groundwater (Laier 2010).<br />
References<br />
Daniels, L., Belay, N., Rajagopal, B.S. & Weimer, P.J. 1987: Bacterial<br />
methanogenesis <strong>and</strong> growth from CO 2<br />
with elemental iron as the sole<br />
source <strong>of</strong> electrons. Science 237, 509–511.<br />
Hamberg, L. & Nielsen, L.H. 2000: Shingled, sharp-based shoreface s<strong>and</strong>stones:<br />
depositional response to stepwise forced regression in a shallow<br />
basin, Upper Triassic Gassum Formation, <strong>Denmark</strong>. In: Hunt, D. &<br />
Gawthorpe, R.L. (eds): Sedimentary reponses to forced regressions.<br />
<strong>Geological</strong> Society Special Publications (London) 172, 69–89.<br />
Jørgensen, F. & S<strong>and</strong>ersen, P. 2009: Kortlægning af begravede dale i<br />
Danmark. Opdatering 2007–2009, 374 pp. Copenhagen: <strong>Geological</strong><br />
<strong>Survey</strong> <strong>of</strong> <strong>Denmark</strong> <strong>and</strong> Greenl<strong>and</strong>. http://www.begravededale.dk/<br />
PDF_2009/Rapport_Begravede_dale_2009_137mb.pdf<br />
Laier, T. 1989: Stenlille Gas Storage – study <strong>of</strong> naturally occurring hydrocarbon<br />
gases before injection. DGU Service Report 15, 53 pp. Copenhagen:<br />
<strong>Geological</strong> <strong>Survey</strong> <strong>of</strong> <strong>Denmark</strong>.<br />
Laier, T. 2010: Spor af naturgas i Nyrup v<strong>and</strong>værksboring oktober 2009.<br />
Danmarks og Grønl<strong>and</strong>s Geologiske Undersøgelse Rapport 2010/1,<br />
30 pp.<br />
Laier, T. & Øbro, H. 2009: Environmental <strong>and</strong> safety monitoring <strong>of</strong> the<br />
underground gas storage facility at Stenlille, <strong>Denmark</strong>. In: Evans, D.J.<br />
& Chadwick, R.A. (eds): Underground gas storage: worldwide experiences<br />
<strong>and</strong> future development in the UK <strong>and</strong> Europe. <strong>Geological</strong> Society<br />
Special Publications (London) 313, 81–92.<br />
Conclusions<br />
No leakage from the natural gas underground storage has<br />
occurred through the natural (geological) barriers. Regular<br />
analyses <strong>of</strong> dissolved hydrocarbons in shallow groundwater<br />
only showed the presence <strong>of</strong> bacterial methane, which was<br />
also present prior to the storage <strong>of</strong> natural gas. The traces <strong>of</strong><br />
natural gas observed for a short period in one <strong>of</strong> the water<br />
wells in 2009 could be related to a minor leak from a newly<br />
drilled injection well in August 1995.<br />
Author’s address<br />
<strong>Geological</strong> <strong>Survey</strong> <strong>of</strong> <strong>Denmark</strong> <strong>and</strong> Greenl<strong>and</strong>, Øster Voldgade 10, DK-1350 Copenhagen K, <strong>Denmark</strong>. E-mail: tl@geus.dk<br />
48
Groundwater protection in <strong>Denmark</strong><br />
<strong>and</strong> the role <strong>of</strong> water supply companies<br />
Jacob Dyrby Petersen <strong>and</strong> Lisbeth Flindt Jørgensen<br />
<strong>Denmark</strong> has a decentralised water supply structure with<br />
about 2500 water supply companies. Until recently, about<br />
150 <strong>of</strong> these, especially the larger ones, were owned by local<br />
authorities; the rest are private, all run on an independent<br />
<strong>and</strong> not-for-pr<strong>of</strong>it basis. Recently, a new law, the Water Sector<br />
Law (Miljøministeriet 2009), was implemented. Its purpose<br />
is to privatise the water supply sector (although, as hitherto,<br />
into not-for-pr<strong>of</strong>it corporations), <strong>and</strong> statutory duties<br />
are separated from operations in order to make the supply <strong>of</strong><br />
drinking water to consumers as efficient as possible. An important<br />
element <strong>of</strong> the Water Sector Law is the introduction<br />
<strong>of</strong> a new regulatory body, the Utility Secretariat. The role<br />
<strong>of</strong> this new institution under the Danish Competition <strong>and</strong><br />
Consumer Authority is to enforce price ceilings on drinking<br />
water, based on a selection <strong>of</strong> benchmark parameters.<br />
Danish policy is to base the drinking water supply on<br />
unpolluted groundwater. Nevertheless, in 2010, pesticides<br />
were detected in 25% <strong>of</strong> all tested, active abstraction wells,<br />
<strong>and</strong> the level for individual substances was exceeded in 4.5%<br />
<strong>of</strong> the wells (Thorling et al. 2011), a situation more or less<br />
unchanged over the last 20 years. This calls for further <strong>and</strong><br />
continuous measures to strengthen groundwater protection.<br />
In addition, the range <strong>of</strong> protective activities implemented<br />
over the last decades may require reinforcement as groundwater<br />
monitoring data show that a high proportion <strong>of</strong> young<br />
A modern Danish waterwork from Østerby, eastern Jyll<strong>and</strong>.<br />
groundwater is polluted with pesticides (Thorling et al.<br />
2011).<br />
Our hypothesis is that during the last decades groundwater<br />
protection has changed from being a national responsibility<br />
to becoming a more locally embedded task. We also<br />
see a change towards the water supply companies being the<br />
major actors capable <strong>of</strong> initiating active groundwater protection.<br />
This transition also implies a change as regards economy,<br />
viz. from public authorities to consumers. The aim <strong>of</strong><br />
this paper is to discuss how the Water Sector Law affects the<br />
frames for groundwater protection when an increasing part<br />
<strong>of</strong> the effort hinges on the water supply initiative taken by<br />
private companies.<br />
Background<br />
<strong>Denmark</strong> is one <strong>of</strong> the countries in the world most heavily reliant<br />
on groundwater as more than 99% <strong>of</strong> all water supplies<br />
are derived from this source (Jørgensen & Stockmarr 2009).<br />
Thus <strong>Denmark</strong> has a strong incentive to, <strong>and</strong> tradition for,<br />
knowledge-based groundwater management. The characteristics<br />
<strong>of</strong> the Danish hydrogeological conditions, combined<br />
with wide-ranging groundwater monitoring <strong>and</strong> a relatively<br />
advanced technological <strong>and</strong> administrative approach as well<br />
as a tradition for public involvement in administration, have<br />
shaped the present framework <strong>of</strong> groundwater protection in<br />
<strong>Denmark</strong>.<br />
In <strong>Denmark</strong>, <strong>of</strong>ficial groundwater protection began in<br />
the 1970s with the creation <strong>of</strong> the Ministry <strong>of</strong> the Environment.<br />
The ensuing environmental legislation <strong>and</strong> the<br />
establishment <strong>of</strong> 14 regional authorities prepared the path<br />
for regional groundwater management strategies based on<br />
national legislation for the protection <strong>of</strong> the environment,<br />
including groundwater. As a consequence <strong>of</strong> a statutory<br />
framework reform in 2007, abolishing the 14 regional authorities,<br />
groundwater protection was transferred to the 98<br />
municipalities (kommuner).<br />
Initially, mainly prospective activities were addressed,<br />
but a few years later remediation acts were enforced <strong>and</strong> resources<br />
allocated to manage the ‘sins <strong>of</strong> the past’ in terms <strong>of</strong><br />
old polluted sites. Water supply <strong>and</strong> water dem<strong>and</strong> manage-<br />
© 2012 GEUS. <strong>Geological</strong> <strong>Survey</strong> <strong>of</strong> <strong>Denmark</strong> <strong>and</strong> Greenl<strong>and</strong> <strong>Bulletin</strong> <strong>26</strong>, 49–52. Open access: www.geus.dk/publications/bull<br />
49
Table 1. The interviewed institutions<br />
Interviewed institution<br />
Two large, urban water supply companies<br />
Two water supply associations<br />
One agricultural association<br />
Two municipalities (kommuner)<br />
The Nature Agency (Ministry <strong>of</strong> the Environment)<br />
The Utility Secretariat (Danish Competition <strong>and</strong> Consumer Authority)*<br />
One large, private contractor/consultant<br />
* The authority implementing the Water Sector Law<br />
Representing<br />
Water supply<br />
Pr<strong>of</strong>essional body<br />
Pr<strong>of</strong>essional body<br />
Public sector (local)<br />
Public sector (national)<br />
Public sector<br />
Private sector<br />
ment strategies emerged, e.g. by launching saving campaigns<br />
targeted at both industrial <strong>and</strong> private consumers. Appeals<br />
soon followed not to use pesticides in private gardens etc. to<br />
reduce groundwater contamination. These public campaigns<br />
were initiated <strong>and</strong> implemented by the state as well as the<br />
water supply companies. The latter were allowed a more operational<br />
role in groundwater protection by a change <strong>of</strong> the<br />
Water Act in 1999, financing activities through water levies<br />
(Miljøministeriet 1999). Thus groundwater protection was<br />
no longer solely dependent on initiatives by the state.<br />
Methods<br />
To analyse the past <strong>and</strong> present status <strong>of</strong> involvement in<br />
groundwater protection <strong>and</strong> to examine what is conceived as<br />
the overriding issues <strong>of</strong> the new Water Sector Law, two major<br />
sources are used: (1) a survey conducted in 2010 among the<br />
75 largest Danish water supply companies (Pedersen 2010a)<br />
<strong>and</strong> (2) qualitative interviews in 2011 with key persons in<br />
the water sector (Table 1), combined with a concurrent study<br />
<strong>of</strong> the political <strong>and</strong> legislative process surrounding the implications<br />
<strong>of</strong> the water sector reform (Petersen 2011). Given<br />
the dynamic nature <strong>of</strong> the field <strong>of</strong> study, the interviews were<br />
conducted within a period <strong>of</strong> six months with follow-ups carried<br />
out as semi-structured interviews based on an iterative<br />
<strong>and</strong> adaptive approach (Kvale 1997). The interviews covered<br />
the views <strong>of</strong> informants on:<br />
• the historical development <strong>of</strong> the water supply sector;<br />
• the interplay between the authorities <strong>and</strong> the water<br />
supply companies;<br />
• the efforts <strong>and</strong> players in the Danish groundwater<br />
protection regime <strong>and</strong><br />
• the legislative process <strong>and</strong> the implications for the<br />
economic <strong>and</strong> ecological aspects <strong>of</strong> future groundwater<br />
protection.<br />
The theoretical frame was partly based on a theoretical network<br />
analysis adapted from Sørensen & Torfing (2005) <strong>and</strong><br />
partly on a meta-analysis <strong>of</strong> the underst<strong>and</strong>ing <strong>of</strong> groundwater<br />
management from the definition <strong>of</strong> Market Environmentalism<br />
(Bakker 2005). The network approach was used<br />
to analyse the use <strong>of</strong> decision making <strong>and</strong> coordinating networks<br />
between actors instead <strong>of</strong> the two traditional management<br />
instruments: hierarchy (i.e. state control) <strong>and</strong> free<br />
market. This enables an assessment <strong>of</strong> how the Water Sector<br />
Law has changed the opportunities <strong>of</strong> the water supply sector<br />
to form <strong>and</strong> co-operate within networks.<br />
Market environmentalism can be used as a theoretical tool<br />
to analyse the development <strong>of</strong> resource underst<strong>and</strong>ing <strong>and</strong> resource<br />
management based on market mechanisms, based on<br />
studies from the UK. From being a supply-led, state-owned<br />
<strong>and</strong> managed resource, groundwater in the UK is increasingly<br />
governed through the private sector <strong>and</strong> market-based<br />
instruments. As a country <strong>of</strong> comparison, the theoretical<br />
framework is used to analyse the development in <strong>Denmark</strong>.<br />
Results<br />
In 2010, 48% <strong>of</strong> the 75 largest Danish water supply companies<br />
were actively involved in groundwater protection activities,<br />
<strong>and</strong> were partly financing these (Pedersen 2010a). The<br />
companies reported that they had used between 1 <strong>and</strong> 25% <strong>of</strong><br />
their annual turnover on groundwater protection (Pedersen<br />
2010b). Although these estimates are highly uncertain, water<br />
supply companies have reported increasing expenditure<br />
on these protection activities (Fig. 1), <strong>and</strong> the figures indicate<br />
Expenditure<br />
(million DKK)<br />
120<br />
80<br />
40<br />
0<br />
2000<br />
2005 2010<br />
Year<br />
Fig. 1. Expenditure related to groundwater protective activities as reported<br />
by the water supply companies. Modified from Petersen (2011).<br />
50
Before Water Sector Law<br />
Water supply company B<br />
Groundwater protection<br />
Water supply company D<br />
After Water Sector Law<br />
Municipality<br />
Groundwater protection<br />
Municipality<br />
Water supply company<br />
Utility Secretariat<br />
Water supply company A<br />
Water supply company C<br />
Fig. 2. The framework for groundwater protection before <strong>and</strong> after the<br />
implementation <strong>of</strong> the Water Sector Law. The networking is expected to<br />
decrease, <strong>and</strong> the water supply companies will change from being both operators,<br />
planners <strong>and</strong> decision makers to be operators only.<br />
a total annual funding from the water supply sector <strong>of</strong> more<br />
than 100 million Danish kroner (Petersen 2011). More than<br />
half <strong>of</strong> the interviewed water supply companies expected expenditure<br />
to increase or at least remain at the same level in<br />
forthcoming years, <strong>and</strong> more than 60% expected necessary<br />
future activities (Pedersen 2010b).<br />
The interviews conducted by Petersen (2011) reflect that<br />
the water supply companies have taken care <strong>of</strong> a range <strong>of</strong> different<br />
tasks connected with groundwater protection. They<br />
have <strong>of</strong>ten voluntarily entered networks (see Fig. 2) with each<br />
other <strong>and</strong> the relevant municipalities <strong>and</strong> thereby broadened<br />
the character <strong>of</strong> tasks to a degree that would otherwise have<br />
been impossible, based on individual water supply company<br />
economy <strong>and</strong> human resources. The tasks cover afforestation,<br />
volunteer farming agreements with l<strong>and</strong>owners,<br />
groundwater resource <strong>and</strong> quality investigations, entry into<br />
action plans together with other water suppliers, stakeholders<br />
<strong>and</strong> local authorities, etc. These tasks were previously financed<br />
by adding an extra consumer levy on the water price,<br />
typically a groundwater protection tariff <strong>of</strong> less than 2% <strong>of</strong><br />
the total water price per cubic metre. As a consequence <strong>of</strong><br />
the Water Sector Law, the water supply companies fear that<br />
this will not be possible in the future as the law allows the<br />
Utility Secretariat to establish differentiated price ceilings<br />
for the individual water supply companies (Petersen 2011)<br />
based solely on production expenditure.<br />
One <strong>of</strong> the two water supply organisations have expressed<br />
their concerns at this new development, expecting that<br />
the water supply companies will have to focus their activities<br />
only on economic issues <strong>and</strong> not, as previously, be able<br />
to perform groundwater protective activities for long-term<br />
consumer benefit (Petersen 2011).<br />
The interviews revealed concerns regarding the capability<br />
<strong>of</strong> local authorities to set up groundwater protective activities<br />
at the same level as the former regional authorities, due to<br />
limited resources under the new statutory framework. These<br />
concerns are related to both spatial (arm’s length) aspects<br />
(the water resource being managed at a local <strong>and</strong> not a regional<br />
level, giving local interests larger influence) <strong>and</strong> resource<br />
issues (the local authorities lacking possibilities <strong>of</strong> sustaining<br />
both economy <strong>and</strong> skills; Petersen 2011). Furthermore, there<br />
is fear among water associations that the local authorities<br />
will only have an active role in protecting the groundwater<br />
in quantitative terms, as qualitative aspects are now to be<br />
h<strong>and</strong>led in national legislation <strong>and</strong> action plans, <strong>and</strong> not at a<br />
local level. Thus the municipalities may only be in a position<br />
to administer <strong>and</strong> outline the overall framework, <strong>and</strong> only<br />
perform limited actual groundwater protective activities.<br />
Accordingly, the interviewed municipalities expressed their<br />
expectations that the water supply companies are to be the active<br />
players in these activities, <strong>and</strong> that the economic resources<br />
are to be found through water levies (Petersen 2011). The<br />
capacities <strong>of</strong> the water supply companies should therefore<br />
include the practical implementation <strong>of</strong> future groundwater<br />
protection measures, at least as seen from the municipalities’<br />
point <strong>of</strong> view.<br />
Discussion<br />
Over the past two decades, the water supply companies have<br />
entered into different networks.These networks have been established<br />
for various reasons, which could be an experience<br />
<strong>of</strong> missing coordination in societal management, or a need<br />
for mutual action <strong>and</strong> sharing <strong>of</strong> knowledge <strong>and</strong> resources<br />
(Sørensen & Torfing 2005). The networks have been associated<br />
especially with groundwater protective activities such<br />
51
as afforestation, voluntary agreements with l<strong>and</strong>owners on<br />
non-pesticide cultivation, investigations <strong>and</strong> action plans<br />
(Petersen 2011).<br />
How does the new Water Sector Law influence these networks<br />
<strong>and</strong> their associated activities? The law sets strict limits<br />
on how the water supply companies can use their financial<br />
resources. The first few trials have already shown that the<br />
Water Sector Law does not provide the framework necessary<br />
for continuation <strong>of</strong> former activities such as afforestation<br />
<strong>and</strong> networking, as the financial platform in terms <strong>of</strong> a water<br />
tax is not in accordance with the law. Both the water supply<br />
companies <strong>and</strong> the local authorities look upon this as a bottleneck<br />
in establishing <strong>and</strong> continuing effective groundwater<br />
protection (Petersen 2011).<br />
The intension behind the Water Sector Law is to ensure<br />
economically efficient company operations <strong>and</strong> at the same<br />
time the law emphasises that the main objective <strong>of</strong> the companies<br />
is to abstract, treat <strong>and</strong> distribute drinking water (Petersen<br />
2011). On the other h<strong>and</strong>, a central element is that<br />
the water supply companies are allowed – if not obliged –<br />
to perform groundwater protective activities if required by<br />
the local authorities as part <strong>of</strong> a public environmental action<br />
plan, dictated by the central authorities.<br />
As the interviews revealed, the experience <strong>and</strong> financial<br />
capacity <strong>of</strong> the decentralised water supply companies have<br />
played an essential role in the protection <strong>of</strong> the Danish<br />
groundwater over the past decades, <strong>and</strong> there is considerable<br />
concern regarding the future fate <strong>of</strong> these activities (Petersen<br />
2011).<br />
The new regulatory paradigm is by Bakker (2005) described<br />
as Market Environmentalism, where market mechanisms<br />
are to ensure efficiency, competition <strong>and</strong> sustainability.<br />
Whereas the business aspects are beyond the scope <strong>of</strong> this<br />
paper, the environmental perspective implies a movement towards<br />
a capitalisation <strong>of</strong> the environment to include resource<br />
protection in water pricing, as attempted in the UK. From a<br />
quantitative perspective, the price can reflect most <strong>of</strong> the cost<br />
related to abstraction <strong>and</strong> distribution. Qualitative groundwater<br />
protection, however, has entrenched complexities. Due<br />
to the intertemporal aspect <strong>and</strong> imperfect, although ever increasing<br />
knowledge, the financing <strong>of</strong> qualitative protection<br />
may shift during the coming years as the water supply companies<br />
are encouraged to focus more narrowly on initiatives<br />
directly related to their resource.<br />
Our study shows that combined with the recent structural<br />
reforms <strong>of</strong> the environmental management authorities, the<br />
Water Sector Law sets the stage for a shift in a formerly accepted<br />
managerial practice. This is mainly seen as a drawback<br />
as it reduces the possibilities <strong>of</strong> the water supply companies<br />
to undertake groundwater protective actions that are seen<br />
as necessary by the individual companies <strong>and</strong> leaves them in<br />
a role where they are only operators <strong>of</strong> actions dictated by<br />
the municipality. The benefits may, on the other h<strong>and</strong>, be a<br />
better coordinated <strong>and</strong> integrated water management policy,<br />
where the groundwater protection is seen in a more holistic<br />
approach that also calls for actions in areas where the water<br />
supply companies have not so far been active. However, this<br />
calls for a strong incorporated <strong>and</strong> active integrating governance<br />
strategy from the local authorities. Only the future can<br />
show how this will come out.<br />
References<br />
Bakker, K. 2005: Neoliberalizing nature? Market environmentalism in<br />
water supply in Engl<strong>and</strong> <strong>and</strong> Wales. Annals <strong>of</strong> the Association <strong>of</strong> American<br />
Geographers 95, 542–565.<br />
Jørgensen, L.F. & Stockmarr, J. 2009: Groundwater monitoring in <strong>Denmark</strong>:<br />
characteristics, perspectives <strong>and</strong> comparison with other countries.<br />
Hydrogeology Journal 17, 827–842.<br />
Kvale, S. 1997: Interview. En introduktion til det kvalitative forskningsinterview,<br />
318 pp. København: Hans Reitzels Forlag.<br />
Miljøministeriet 1999: Lovbekendtgørelsen nr 130 af <strong>26</strong>. februar 1999 om<br />
v<strong>and</strong>forsyning mv.<br />
Miljøministeriet 2009: Lovbekendtgørelsen nr 469 af 12. juni 2009 om<br />
v<strong>and</strong>sektorens organisering og økonomiske forhold.<br />
Pedersen, P.E. 2010a: V<strong>and</strong>forsyninger under hårdt pres. Vækst 131(2),<br />
12–13.<br />
Pedersen, P.E. 2010b: Et væld af metoder til grundv<strong>and</strong>sbeskyttelse. Vækst<br />
131(2). Only available online: http://www.hedeselskabet.dk/page.6360.<br />
aspx?recordid6360=335<br />
Petersen, J.D. 2011: Dyrebare dråber. V<strong>and</strong>forsyningernes rolle i grundv<strong>and</strong>sbeskyttelse,<br />
86 pp. Unpublished Master thesis, Roskilde Universitet,<br />
Danmark.<br />
Sørensen, E. & Torfing, J. 2005: Netværksstyring: fra government til governance,<br />
218 pp. Frederiksberg: Roskilde Universitetsforlag.<br />
Thorling, L., Hansen, B., Langt<strong>of</strong>te, C., Brüsch, W., Møller, R.R., Mielby,<br />
S. & Højberg, A.L. 2011: Grundv<strong>and</strong>. Status og udvikling 1989–2010,<br />
139 pp. Særudgivelse. København: De Nationale Geologiske Undersøgelser<br />
for Danmark og Grønl<strong>and</strong>. Only available online: http://www.<br />
geus.dk/publications/grundv<strong>and</strong>sovervaagning/1989_2010.htm<br />
Authors’ addresses<br />
J.D.P., Roskilde University, Department <strong>of</strong> Technological <strong>and</strong> Socio-Economic Planning, Universitetsvej 1, DK-4000 Roskilde, <strong>Denmark</strong>.<br />
E-mail: dyrby@ruc.dk<br />
L.F.J., <strong>Geological</strong> <strong>Survey</strong> <strong>of</strong> <strong>Denmark</strong> <strong>and</strong> Greenl<strong>and</strong>, Øster Voldgade 10, DK-1350 Copenhagen K, <strong>Denmark</strong>.<br />
52
Anorthosites in Greenl<strong>and</strong>: a possible raw material<br />
for aluminium?<br />
Christian Knudsen, Jan Wanvik <strong>and</strong> Henrik Svahnberg<br />
The famous Swiss-born, Norwegian geologist <strong>and</strong> geochemist<br />
Victor Goldschmidt suggested that anorthosite could be<br />
used as a source <strong>of</strong> aluminium replacing bauxite, <strong>and</strong> acid<br />
leaching <strong>of</strong> the anorthosite was his innovative idea. Anorthosite<br />
is a rock type consisting <strong>of</strong> more than 90% plagioclase<br />
which is an acid-soluble, aluminium-rich silicate mineral occurring<br />
in basement rocks <strong>of</strong> both Norway <strong>and</strong> Greenl<strong>and</strong><br />
(Fig. 1). Experiments conducted in Norway during the century<br />
after Goldschmidt’s initial idea showed that it is technically<br />
possible to use anorthosite as a raw material in the production<br />
<strong>of</strong> aluminium metal. Goldschmidt mapped parts <strong>of</strong><br />
the large anorthosite massifs along Sognefjord in the period<br />
1916–1919. During the Second World War, sampling <strong>and</strong><br />
core drilling were conducted in Norway, <strong>and</strong> an anorthosite<br />
mine was opened by Norsk Hydro where up to 400 men were<br />
employed <strong>and</strong> some 15 000 tonnes <strong>of</strong> rock were quarried before<br />
sabotage ended the work in 1945. There was renewed<br />
interest in anorthosite as an alternative raw material for<br />
aluminium in Norway in the years 1976–1982, but experiments<br />
conducted in this period did not lead to an economically<br />
viable concept. Recent developments at the Institute for<br />
Energy Technology in Norway have led to the discovery <strong>of</strong> a<br />
more promising process based on nitric acid that can yield<br />
additional products such as Precipitated Calcium Carbonate<br />
(PCC) for the paper industry, amorphous silica <strong>and</strong> ammonium<br />
nitrate fertiliser. The process can also be used as a sink<br />
for CO 2 by taking CO 2 from, for example, a power plant <strong>and</strong><br />
binding it to PCC.<br />
Solubility as a function <strong>of</strong> mineral<br />
chemistry<br />
The mineral plagioclase covers a range <strong>of</strong> compositions from<br />
albite (NaAlSi 3 O 8 ) to anorthite (CaAl 2 Si 2 O 8 ) <strong>and</strong> forms a<br />
solid solution series. The solubility <strong>of</strong> plagioclase, <strong>and</strong> therefore<br />
<strong>of</strong> anorthosite, increases with the calcium content, expressed<br />
as the anorthite content or An% in the plagioclase<br />
(Fig. 2). The higher solubility <strong>of</strong> the calcium-rich plagioclase<br />
makes it more attractive as a source <strong>of</strong> aluminium, as does<br />
the content <strong>of</strong> aluminium which increases with the anorthite<br />
content (calcium content; Fig. 2). Anorthosite bodies<br />
in the inner Sognefjord–Voss area in western Norway have<br />
a calcium-rich plagioclase composition (Fig. 2) with an anorthite<br />
content <strong>of</strong> 65–78%. The solubility <strong>and</strong> aluminium<br />
content determine the quality <strong>of</strong> anorthosite as a raw material<br />
for aluminium production. To provide an overview <strong>of</strong><br />
Akia<br />
Nuuk<br />
Qaqujârssuaq<br />
Neria<br />
Tunulik<br />
Boye Sø<br />
Qaqortorsuaq<br />
Innajuattoq<br />
Major anorthosite complex<br />
Minor anorthosite complex<br />
Nagssugtoqidian fold belt<br />
Godthåbsfjord<br />
Qarliit Nunaat<br />
Archaean block<br />
Buksefjorden<br />
Fiskenæsset<br />
Greenl<strong>and</strong><br />
250 km<br />
Volcanic rocks (50–60)<br />
Sedimentary basins <strong>and</strong> intrusions<br />
Sediments (23–416)<br />
Sediments (416–542)<br />
Sediments/metasediments/<br />
volcanics (542–1740)<br />
Gardar intrusions (1120–1350)<br />
Precambrian crystalline basement<br />
Reworked Archaean (1750–2000)<br />
Proterozoic (1750–2000)<br />
Archaean (2550–3800)<br />
Fig. 1. Simplified geological map <strong>of</strong> Greenl<strong>and</strong> showing anorthosite occurrences.<br />
Ages in million years.<br />
© 2012 GEUS. <strong>Geological</strong> <strong>Survey</strong> <strong>of</strong> <strong>Denmark</strong> <strong>and</strong> Greenl<strong>and</strong> <strong>Bulletin</strong> <strong>26</strong>, 53–56. Open access: www.geus.dk/publications/bull<br />
53
Leached Al 2<br />
O 3<br />
(% <strong>of</strong> total A 2<br />
O 3<br />
)<br />
100<br />
80<br />
60<br />
40<br />
20<br />
Unaltered<br />
Gudvangen type<br />
Rogal<strong>and</strong> type<br />
Sogn<br />
Greenl<strong>and</strong><br />
Leached Al 2<br />
O 3<br />
in % <strong>of</strong> total A 2<br />
O 3<br />
100<br />
80<br />
60<br />
40<br />
20<br />
Na 2<br />
O<br />
SiO 2<br />
Al 2<br />
O 3<br />
CaO<br />
Unaltered Gudvangen type<br />
Greenl<strong>and</strong><br />
Fig. 2. Chemical composition (left) <strong>and</strong> solubility<br />
(right) <strong>of</strong> plagioclase. Modified from Wanvik<br />
(2000). Gudvangen, Rogal<strong>and</strong> <strong>and</strong> Sogn are<br />
anorthosite occurrences in Norway. Greenl<strong>and</strong> is<br />
based on an average from Table 1.<br />
0<br />
0 20 40 60 80 100<br />
% An <strong>of</strong> plagioclase<br />
Albite<br />
Oligoclase Andesine<br />
dorite<br />
Labra- Bytownite<br />
10 30 50 70 90<br />
Anorthite<br />
0<br />
0 20 40 60 80 100<br />
% An <strong>of</strong> plagioclase<br />
NaAlSi 3<br />
O 8 CaAl 2<br />
Si 2<br />
O 8<br />
Albite<br />
Anor-<br />
thite<br />
Oligoclase Andesine<br />
dorite<br />
Labra- Bytownite<br />
10 30 50 70 90<br />
the variation in these parameters <strong>and</strong> accordingly the value<br />
<strong>of</strong> anorthosite as a potential raw material in aluminium production,<br />
the <strong>Geological</strong> <strong>Survey</strong> <strong>of</strong> <strong>Denmark</strong> <strong>and</strong> Greenl<strong>and</strong><br />
conducted a survey <strong>of</strong> the compositional variation <strong>of</strong> anorthosite<br />
complexes in Greenl<strong>and</strong>.<br />
Anorthosites in Greenl<strong>and</strong><br />
Anorthosite rock bodies are found in Archaean basement<br />
rocks in most parts <strong>of</strong> Greenl<strong>and</strong> <strong>and</strong> constitute up to 5%<br />
<strong>of</strong> the bedrock in a region. They are easy to recognise in the<br />
field because <strong>of</strong> their very light weathering colour which also<br />
makes the rock very useful as a structural marker when mapping<br />
in deformed terranes. Anorthosite can be divided into<br />
several types including ‘Archaean calcic anorthosite’ (Ashwal<br />
1993). The calcium content in the plagioclase <strong>of</strong> ‘Archaean<br />
calcic anorthosite’ is high (75–90% An). This feature<br />
distinguishes Archaean anorthosite from, for example, the<br />
‘Proterozoic (massif) type anorthosite’ with 35–60% An. So<br />
far, only the Archaean type <strong>of</strong> anorthosite has been described<br />
from Greenl<strong>and</strong>.<br />
The Archaean anorthosite occurrences in Greenl<strong>and</strong> are<br />
generally deformed <strong>and</strong> metamorphosed to such an extent<br />
that their genetic relationships are difficult to reveal. They<br />
<strong>of</strong>ten occur as decimetre- to metre-sized pods <strong>and</strong> inclusions<br />
in the country gneiss. However, there are a number <strong>of</strong> places<br />
where larger bodies <strong>of</strong> anorthosites are found with preserved<br />
primary textures <strong>and</strong> relationships. The most prominent<br />
occurrence is the Fiskenæsset complex consisting <strong>of</strong> anorthosite,<br />
leucogabbro, gabbro <strong>and</strong> ultramafic rocks. Here it<br />
has been demonstrated that anorthosite forms parts <strong>of</strong> large<br />
intrusions <strong>of</strong> basaltic composition <strong>and</strong> formed as cumulates<br />
by crystal fractionation (Windley et al. 1973; Myers 1975;<br />
Windley & Garde 2009).<br />
Table 1. Average Al 2<br />
O 3<br />
, CaO, Fe 2<br />
O 3<br />
<strong>and</strong> Na 2<br />
O compositions <strong>of</strong> anorthosites calculated from whole-rock analytical data<br />
N W No <strong>of</strong> CIPW CIPW<br />
lat. long. analyses Al 2 O 3 CaO Fe 2 O 3 Na 2 O % plag* % An*<br />
Fiskenæsset group 1 † 63°15´ 50°00´ 13 30.6 16.3 2.5 1.8 90.1 83.8<br />
Fiskenæsset group 2 3 32.5 16.3 1.9 1.8 94.1 83.6<br />
Fiskenæsset group 3 3 30.5 12.5 1.5 4.0 92.4 65.7<br />
Buksefjorden 63°55´ 51°20´ 6 29.3 14.1 1.5 2.2 90.7 73.7<br />
Qarliit Nunaat (Godthåbsfjord) 64°04´ 49°45´ 1 28.5 11.9 0.9 4.1 93.0 61.0<br />
Naajat Kuuat (Godthåbsfjord) 64°10´ 50°03´ 7 28.9 13.6 1.8 2.5 88.7 72.9<br />
Storø (Godthåbsfjord) 64°23´ 51°07´ 1 32.3 16.0 0.6 2.1 96.6 81.3<br />
Akia (Godthåbsfjord) 64°30´ 52°06´ 9 30.6 15.2 1.8 2.2 91.4 79.6<br />
Ivisaartoq (Godthåbsfjord) 64°44´ 49°42´ 6 29.8 14.7 3.0 2.6 91.1 75.2<br />
Innajuattoq (Godthåbsfjord) 64°45´ 50°40´ 1 31.8 16.0 1.5 2.0 91.6 84.4<br />
Qaqortorsuaq 66°35´ 52°12´ 3 33.6 15.8 0.9 2.2 94.1 82.6<br />
Tunulik 70°03´ 51°15´ 5 28.9 12.9 1.0 3.5 91.5 67.1<br />
Qaqujârssuaq 77°35´ 64°45´ 2 29.9 14.9 1.2 1.7 91.6 77.3<br />
Gudvangen (Norway) 8 30.1 14.1 0.8 2.9 94.6 72.0<br />
* % plagioclase in rock <strong>and</strong> % An in plagioclase are based on CIPW norm calculations. † Fiskenæsset is grouped on the basis <strong>of</strong> its rareearth<br />
element patterns following Polat et al. (2009).<br />
54
A<br />
B<br />
Fig. 3. A: The anorthosite at Innajuattoq in the Archaean block northwest<br />
<strong>of</strong> Nuuk. The mountain is 1206 m high, <strong>and</strong> the cliff section is c.<br />
1100 m high. B: Close-up view; length <strong>of</strong> hammer h<strong>and</strong>le c. 60 cm.<br />
The primary relationship to the surrounding rocks is<br />
<strong>of</strong>ten obscured by tectonic activity or intrusive contacts to<br />
younger granitoids. All the anorthosites studied here are assumed<br />
to belong to the calcic Archaean type but their composition<br />
varies, (1) among the different complexes, (2) within<br />
the complexes as a function <strong>of</strong> the stratigraphical position<br />
<strong>and</strong> (3) within the mineral grain – from core to rim, <strong>of</strong>ten<br />
due to recrystallisation during metamorphism.<br />
Around 12 anorthosite complexes in Greenl<strong>and</strong> have<br />
been mapped <strong>and</strong> described (Fig. 1). The northernmost one<br />
is the Qaqujârssuaq anorthosite, which is also the largest<br />
single anorthosite mass in Greenl<strong>and</strong> covering c. 100 km 2 <strong>of</strong><br />
Smithson Bjerge <strong>and</strong> an unknown area under the Inl<strong>and</strong> Ice<br />
(Dawes 2006). It is a c. 500 m thick succession composed<br />
<strong>of</strong> c. 90% anorthosite, c. 10% leucogabbro <strong>and</strong>
situ 207 Pb/ 206 Pb zircon ages <strong>of</strong> up to 2950 Ma, Keulen et al.<br />
(2010) concluded that the intrusion age is c. 2970 to 2950<br />
Ma. The anorthosite unit is c. 250 m thick (Myers 1985). At<br />
localities where the anorthosite is least deformed, it typically<br />
appears as megacrystic with 1–10 cm equant, relict igneous<br />
plagioclase grains dispersed in 1–5 mm large metamorphic<br />
plagioclase. The main part <strong>of</strong> the anorthosite is deformed,<br />
<strong>and</strong> the plagioclase is metamorphic in a granular texture.<br />
Anorthosite composition<br />
There is a large range <strong>of</strong> plagioclase compositions among the<br />
anorthosite complexes in Greenl<strong>and</strong> (Fig. 4) with the highest<br />
content <strong>of</strong> calcium found in the Fiskenæsset complex.<br />
Whole-rock analyses indicate that very calcium-rich plagioclase<br />
also occurs in the anorthosite at Akia (Fig. 5; Dymek<br />
& Owens 2001).<br />
Most Greenl<strong>and</strong> anorthosite rocks are more calcic than<br />
the Norwegian ones <strong>and</strong> according to the Norwegian experiences<br />
should be more soluble <strong>and</strong> hence more suitable as<br />
a raw material for aluminium production. A possible continuation<br />
<strong>of</strong> this project could be to collect samples from<br />
anorthosites in Greenl<strong>and</strong> <strong>and</strong> conduct solubility tests using<br />
the Norwegian methods. The most promising occurrence<br />
is the Fiskenæsset complex which is the largest anorthosite<br />
in Greenl<strong>and</strong>, has the highest bulk rock CaO content <strong>and</strong><br />
contains the most calcic plagioclase in Greenl<strong>and</strong>. The anorthosites<br />
at Akia, Innajuattoq <strong>and</strong> Qaqortorsuaq contain<br />
very calcic plagioclase <strong>and</strong> low contents <strong>of</strong> other minerals.<br />
These occurrences are located close to the sea <strong>and</strong> could be<br />
targeted in further studies.<br />
Acknowledgement<br />
The Bureau <strong>of</strong> Minerals <strong>and</strong> Petroleum in Nuuk is thanked for financial<br />
support.<br />
References<br />
Andersen, M.C. & Pulvertaft, T.C.R. 1986: Occurrences <strong>of</strong> anorthositic<br />
rocks in reworked Archaean basement in the Umanaq area, central West<br />
Greenl<strong>and</strong>. Rapport Grønl<strong>and</strong>s Geologiske Undersøgelse 129, 18 pp.<br />
Ashwal, L.D. 1993: Anorthosites, 422 pp. Berlin: Springer.<br />
Dawes, P.R. 2006: Explanatory notes to the <strong>Geological</strong> map <strong>of</strong> Greenl<strong>and</strong>,<br />
1:500 000, Thule, sheet 5. <strong>Geological</strong> <strong>Survey</strong> <strong>of</strong> <strong>Denmark</strong> <strong>and</strong> Greenl<strong>and</strong><br />
Map Series 2, 97 pp.<br />
Dymek, R.F. & Owens, B.E. 2001: Chemical assembly <strong>of</strong> Archaean anorthosites<br />
from amphibolite- <strong>and</strong> granulite-facies terranes, West Greenl<strong>and</strong>.<br />
Contributions to Mineralogy <strong>and</strong> Petrology 141, 513–528.<br />
Ellitsgaard-Rasmussen, K. & Mouritzen, M. 1954: An anorthosite occurrence<br />
from West Greenl<strong>and</strong>. Meddelelser fra Dansk Geologisk Forening<br />
12, 436–442.<br />
Garde, A.A. & Steenfelt, A. 1989: A new anorthosite/gabbro complex at<br />
Nûgssuaq, central West Greenl<strong>and</strong>. Rapport Grønl<strong>and</strong>s Geologiske<br />
Undersøgelse 145, 16–20.<br />
Gothenborg, J. & Keto, L. 1977: Report on the aerial reconnaissance between<br />
Sukkertoppen Ice Calot <strong>and</strong> Nordenskiölds Gletscher 1977, 84<br />
pp. Unpublished report, Kryolitselskabet Øresund A/S, Copenhagen,<br />
<strong>Denmark</strong> (in archives <strong>of</strong> <strong>Geological</strong> <strong>Survey</strong> <strong>of</strong> <strong>Denmark</strong> <strong>and</strong> Greenl<strong>and</strong>,<br />
GEUS Report File 20210).<br />
Keulen, N., Næraa, T., Kokfelt, T.F., Schumacher J.C. & Scherstén A.<br />
2010: Zircon record <strong>of</strong> the igneous <strong>and</strong> metamorphic history <strong>of</strong> the<br />
Fiskenæsset anorthosite complex in southern West Greenl<strong>and</strong>. <strong>Geological</strong><br />
<strong>Survey</strong> <strong>of</strong> <strong>Denmark</strong> <strong>and</strong> Greenl<strong>and</strong> <strong>Bulletin</strong> 20, 67–70.<br />
Myers, J.S. 1975: Igneous stratigraphy <strong>of</strong> Archaean anorthosite at Majorqap<br />
qâva, near Fiskenæsset, South-west Greenl<strong>and</strong>. Rapport Grønl<strong>and</strong>s<br />
Geologiske Undersøgelse 74, 27 pp.<br />
Myers, J.S. 1976: Channel deposits <strong>of</strong> peridotite, gabbro <strong>and</strong> chromitite<br />
from turbidity currents in the stratiform Fiskenæsset anorthosite complex,<br />
southwest Greenl<strong>and</strong>. Lithos 9, 281–291.<br />
Myers, J.S. 1985: Stratigraphy <strong>and</strong> structure <strong>of</strong> the Fiskenæsset complex,<br />
southern West Greenl<strong>and</strong>. <strong>Bulletin</strong> Grønl<strong>and</strong>s Geologiske Undersøgelse<br />
150, 72 pp.<br />
Nutman, A. 1984: Precambrian gneisses <strong>and</strong> intrusive anorthosite <strong>of</strong><br />
Smithson Bjerge, Thule district, North-West Greenl<strong>and</strong>. Rapport<br />
Grønl<strong>and</strong>s Geologiske Undersøgelse 119, 31 pp.<br />
Polat, A., Appel, P.W.U., Freyer, B., Windley, B., Frei, R., Samson, I.M.<br />
& Huang, H. 2009: Trace element systematics <strong>of</strong> the Neoarchaean<br />
Fiskenæsset anorthosite complex <strong>and</strong> associated meta-volcanic rocks,<br />
SW Greenl<strong>and</strong>: evidence for a magmatic arc origin. Precambrian Research<br />
175, 87–115.<br />
Wanvik, J.E. 2000: Norwegian anorthosites <strong>and</strong> their industrial uses, with<br />
emphasis on the massifs <strong>of</strong> the Inner Sogn–Voss area in western Norway.<br />
Norges Geologiske Undersøkelse <strong>Bulletin</strong> 436, 103–112.<br />
Windley, B.F. & Garde, A.A. 2009: Arc-generated blocks with crustal sections<br />
in the North Atlantic craton <strong>of</strong> West Greenl<strong>and</strong>: crustal growth in<br />
the Archean with modern analogues. Earth-Science Reviews 93, 1–30.<br />
Windley, B.F. & Smith, J.V. 1974: The Fiskenæsset complex, West Greenl<strong>and</strong>.<br />
Part II. General mineral chemistry from Qeqertarssuatsiaq. <strong>Bulletin</strong><br />
Grønl<strong>and</strong>s Geologiske Undersøgelse 108, 54 pp.<br />
Windley, B.F., Herd, R.K. & Bowden, A.A. 1973: The Fiskenæsset complex,<br />
West Greenl<strong>and</strong>. Part I. A preliminary study <strong>of</strong> the stratigraphy,<br />
petrology <strong>and</strong> whole rock chemistry from Qeqertarssuatsiaq. <strong>Bulletin</strong><br />
Grønl<strong>and</strong>s Geologiske Undersøgelse 106, 80 pp.<br />
Authors’ addresses<br />
C.K., <strong>Geological</strong> <strong>Survey</strong> <strong>of</strong> <strong>Denmark</strong> <strong>and</strong> Greenl<strong>and</strong>, Øster Voldgade 10, DK-1350 Copenhagen K, <strong>Denmark</strong>. E-mail: ckn@geus.dk.<br />
J.W., <strong>Geological</strong> <strong>Survey</strong> <strong>of</strong> Norway, Leiv Eirikssons vei 39, 7040 Trondheim, Norway.<br />
H.S., Stockholm University, Svante Arrhenius väg 8, SE-106 91, Stockholm, Sweden.<br />
56
From 3D mapping to 3D modelling: a case study from<br />
the Skaergaard intrusion, southern East Greenl<strong>and</strong><br />
Kristian Svennevig <strong>and</strong> Pierpaolo Guarnieri<br />
The powerful 3D mapping tool at the photogrammetry<br />
laboratory <strong>of</strong> the <strong>Geological</strong> <strong>Survey</strong> <strong>of</strong> <strong>Denmark</strong> <strong>and</strong> Greenl<strong>and</strong><br />
(GEUS) is ideal for collecting high-quality 3D geological<br />
data in remote <strong>and</strong> inaccessible areas with a high degree<br />
<strong>of</strong> exposure such as Greenl<strong>and</strong> (Vosgerau et al. 2010). So far<br />
this 3D mapping tool has been used to visualise <strong>and</strong> extract<br />
very precise geological data from aerial <strong>and</strong> oblique photographs.<br />
In the study reported on here, the 3D mapping tool<br />
was used to generate data for 3D geological modelling. The<br />
Skaergaard intrusion (Fig. 1) is a well-known Eocene layered<br />
gabbro. The study <strong>of</strong> the intrusion has had great importance<br />
for the underst<strong>and</strong>ing <strong>of</strong> magmatic petrology, magma differentiation<br />
<strong>and</strong> fractional crystallisation since the early studies<br />
by Wager & Deer (1939). It was chosen for 3D modelling<br />
because it is well studied from a petrological point <strong>of</strong> view<br />
<strong>and</strong> because the shape <strong>of</strong> the magma chamber was previously<br />
modelled in a network <strong>of</strong> 2D cross sections (Nielsen 2004).<br />
In this paper, it is modelled for the first time in 3D using<br />
a detailed 1:20 000 scale geological map (McBirney 1989),<br />
1:27 000 scale aerial photographs from 1973, data from drill<br />
holes <strong>and</strong> geophysical data.<br />
Furthermore polylines from the aerial photographs have real<br />
3D coordinates measured directly on the 3D stereo plotter,<br />
whereas polylines from the ArcGIS map have X-Y coordinates<br />
from the map <strong>and</strong> Z coordinates imported from the<br />
digital elevation model. This leads to additional uncertainty<br />
as elevations in the ArcGIS map <strong>and</strong> the digital elevation<br />
model are not generated from the same source <strong>and</strong> sometimes<br />
do not overlap in the entire area <strong>of</strong> interest.<br />
Structural readings (dip direction <strong>and</strong> dip angle) for<br />
the geological boundaries were generated from polylines<br />
using the in-house-developed s<strong>of</strong>tware tool GEUS Planes<br />
(Fig. 2B). This tool calculates strike, dip <strong>and</strong> st<strong>and</strong>ard deviations<br />
on strike <strong>and</strong> dip for each node (vertex) <strong>of</strong> a polyline,<br />
generating large amounts <strong>of</strong> strike-dip measurements from<br />
the 3D geometry <strong>of</strong> the geological boundaries.<br />
3D modelling <strong>and</strong> discussion<br />
The 3D modelling <strong>of</strong> the Skaergaard intrusion was carried<br />
out using the s<strong>of</strong>tware tool Leapfrog-3D. This s<strong>of</strong>tware can<br />
generate surfaces <strong>and</strong> volumes from structural readings,<br />
3D mapping<br />
The 1:27 000 scale aerial photographs where scanned, triangulated<br />
<strong>and</strong> georeferenced with Socketset s<strong>of</strong>tware. The<br />
geological map was digitised as well as georeferenced using<br />
1:150 000 scale aerial photographs <strong>and</strong> finally draped on a<br />
high-resolution (10 × 10 m grid) digital elevation model derived<br />
from the 1:27 000 scale aerial photographs. <strong>Geological</strong><br />
features were drawn as polylines from both the aerial photographs<br />
<strong>and</strong> the geological map. Visible parts <strong>of</strong> the outer<br />
boundary were collected using the 3D stereoplotter (Fig. 2A)<br />
with very high accuracy (Vosgerau et al. 2010). Oblique aerial<br />
photos were not used for 3D-mapping as the area is not<br />
sufficiently covered <strong>and</strong> the setting up <strong>of</strong> the few available<br />
photo lines is beyond the scope <strong>of</strong> this paper. Other boundaries<br />
defined from mineral parageneses <strong>and</strong> compositions<br />
(Wager & Brown 1968) were digitised from the 1:20 000<br />
map in ArcGIS. The boundaries from the aerial photographs<br />
are much more accurate than those <strong>of</strong> the map (Fig. 3) because<br />
they represent directly observable geological features.<br />
68°15´N<br />
Fig. 3<br />
Watkins Fjord<br />
5 km<br />
Skaergaard<br />
intrusion<br />
Mainly Palaeogene volcanic rocks<br />
Palaeogene gabbro, including the Skaergaard intrusion<br />
Mesozoic<br />
Precambrian basement<br />
Glaciers<br />
Fig. 1. The Skaergaard intrusion area, southern East Greenl<strong>and</strong>.<br />
Greenl<strong>and</strong><br />
Miki Fjord<br />
31°25´W<br />
© 2012 GEUS. <strong>Geological</strong> <strong>Survey</strong> <strong>of</strong> <strong>Denmark</strong> <strong>and</strong> Greenl<strong>and</strong> <strong>Bulletin</strong> <strong>26</strong>, 57–60. Open access: www.geus.dk/publications/bull<br />
57
A<br />
Basement<br />
A<br />
Skaergaard intrusion<br />
68°11´N<br />
B<br />
31°43´W<br />
B<br />
C<br />
Fig. 2. Simplified workflow diagram describing the process <strong>of</strong> generating<br />
3D data from photographs to 3D modelling. A: polylines representing<br />
geological boundaries or structures are extracted from a 3D stereo plotter.<br />
B: The nodes <strong>of</strong> the polylines are converted into structural readings (here<br />
shown as small blue discs) using the GEUS Planes tool. Measurements with<br />
a poorly defined plane (high st<strong>and</strong>ard deviation on either the dip, dip-azimuth<br />
or plane) are discarded. C: The structural readings are imported into<br />
a 3D modelling s<strong>of</strong>tware (Leapfrog 3D) where surfaces <strong>and</strong> volumes can be<br />
generated <strong>and</strong> compiled to a 3D model <strong>of</strong> the geological object.<br />
1 km<br />
Fig. 3. Example <strong>of</strong> a polyline (blue) representing the boundary between<br />
the Skaergaard intrusion (dark grey in Fig. 3A, light yellow to red in Fig.<br />
3B, representing different lithological units) <strong>and</strong> the basement (light<br />
grey in Fig. 3A, light skin tone in Fig. 3B). The same polyline is drawn<br />
on the 1:27 000 aerial photographs (A) <strong>and</strong> shown on the geological map<br />
<strong>of</strong> McBirney (1989) (B) for comparison. The difference between the locations<br />
<strong>of</strong> the two lines is up to 100 m.<br />
58
points <strong>and</strong> polylines (Fig. 2C). In st<strong>and</strong>ard surface modelling,<br />
only a couple <strong>of</strong> structural readings are used for generating<br />
surfaces. The great number <strong>of</strong> structural readings<br />
produced by GEUS Planes present a problem to the modelling<br />
s<strong>of</strong>tware making it necessary to manually select which<br />
strike-dip measurements to use for the construction <strong>of</strong> surfaces.<br />
This complication will be solved in a forthcoming upgrade<br />
<strong>of</strong> the GEUS Planes tool by changing the output <strong>and</strong><br />
by using modelling s<strong>of</strong>tware that can import the st<strong>and</strong>ard<br />
deviation as a parameter <strong>and</strong> use it to estimate the quality <strong>of</strong><br />
the structural readings in the creation <strong>of</strong> surfaces.<br />
In areas with no pre-Quaternary exposures, such as glaciated<br />
areas or water-covered areas, support points were<br />
introduced to guide the surfaces. Drill-hole data were also<br />
imported along with a geophysical gravity model <strong>of</strong> the floor<br />
<strong>of</strong> the intrusion (T.M. Rasmussen, personal communication<br />
2011) to further improve the model. Due to erosion <strong>and</strong> lack<br />
<strong>of</strong> exposures the locations <strong>of</strong> the ro<strong>of</strong> <strong>and</strong> northern boundary<br />
A<br />
Elevation<br />
East<br />
B<br />
Elevation<br />
5 km<br />
?<br />
Upper Border Series<br />
Basistoppen Sill<br />
Upper Zone<br />
Triple Group<br />
Middle Zone<br />
Lower Zone<br />
Layered Series<br />
Hidden Zone<br />
Marginal Border Series<br />
East<br />
Fig. 4. 3D model <strong>of</strong> the Skaergaard intrusion in E–W (A) <strong>and</strong> N–S (B) sections. The view is towards 320° at a plunge <strong>of</strong> 15°. No vertical exaggeration.<br />
Notice the wedge-like shape <strong>of</strong> the Hidden Zone (black arrow in A).<br />
59
<strong>of</strong> the intrusion are poorly constrained, <strong>and</strong> these were modelled<br />
with considerable uncertainty. Two structural readings<br />
(strike/dip, 180/20 S <strong>and</strong> 180/10 S) were constructed to<br />
guide the ro<strong>of</strong> surface <strong>of</strong> the magma chamber. These orientations<br />
were estimated by extrapolating the ro<strong>of</strong> boundary<br />
in the southern part <strong>of</strong> the intrusion (Wager & Deer 1939;<br />
Nielsen 2004) with the regional dip (10–20°S) <strong>of</strong> the Tertiary<br />
strata hosting the intrusion (Nielsen & Brooks 1981).<br />
The geophysical model for the floor <strong>of</strong> the intrusion has the<br />
same dip as the regional strata <strong>of</strong> 10–20°S but also shows a dip<br />
<strong>of</strong> around 15° towards the east that is unexpected from the surface<br />
<strong>and</strong> drill-hole data used for generating the model. This is<br />
reflected in the wedge-like shaped <strong>of</strong> the Hidden Zone in the<br />
3D model (Fig. 4A). Furthermore, the modelled floor <strong>of</strong> the<br />
intrusion near the northern boundary is located much more<br />
deeply than expected. Based on a single drill hole in the northern<br />
part <strong>of</strong> the intrusion that reaches the contact zone <strong>of</strong> the<br />
floor (Holness et al. 2007), unexposed gabbro <strong>of</strong> the intrusion<br />
is estimated to reach a depth <strong>of</strong> no more than 450 m (T.F.D.<br />
Nielsen, personal communication 2012), whereas the geophysical<br />
model predicts 1450 m. Several explanations can be<br />
suggested for this discrepancy: (1) The density <strong>of</strong> the gabbro<br />
at the northern margin may be underestimated, (2) uncertainty<br />
<strong>of</strong> the floor depth from drill-hole data or (3) rock<br />
types below the floor <strong>of</strong> the intrusion may have unexpected<br />
high densities. Irrespective <strong>of</strong> the various uncertainties, the<br />
preliminary estimate <strong>of</strong> the total volume <strong>of</strong> the intrusion is<br />
between 279 <strong>and</strong> 305 km 3 (depending on different estimates<br />
<strong>of</strong> the northern boundary). This is in good agreement with a<br />
previous estimate <strong>of</strong> 280 ± 23 km 3 (Nielsen 2004).<br />
The Triple Group (Fig. 4), defined by three distinctive<br />
leucocratic layers in the uppermost part <strong>of</strong> the Middle Zone,<br />
is <strong>of</strong> particular interest as it is rich in palladium <strong>and</strong> gold<br />
(Bird et al. 1991; Nielsen et al. 2005). The degree <strong>of</strong> detail in<br />
the model presented here is too low for a thorough investigation<br />
<strong>of</strong> these levels, but our data reflect the concave nature <strong>of</strong><br />
the layers (Fig. 4) also described by Nielsen (2004). Future<br />
expansion <strong>of</strong> the model with data from oblique photographs<br />
can greatly improve our underst<strong>and</strong>ing <strong>of</strong> the Triple Group,<br />
because it is clearly seen on photographs (fig. 11c in Brooks<br />
2011), being well exposed on the steep mountain slopes.<br />
Concluding remarks<br />
The 3D mapping tool at the GEUS photogrammetry laboratory<br />
is ideal for generating high quality data for 3D modelling.<br />
It is, however, necessary to fine-tune the GEUS Planes<br />
tool <strong>and</strong> to conduct the modelling in a more advanced s<strong>of</strong>tware<br />
such as GoCAD or Move in order to take full advantage<br />
<strong>of</strong> the high quality <strong>and</strong> quantity <strong>of</strong> the data. With these<br />
s<strong>of</strong>tware tools, it is also possible to do advanced modelling<br />
<strong>and</strong>, for example, carry out balanced unfolding <strong>and</strong> backstripping<br />
<strong>of</strong> geological structures <strong>and</strong> units.<br />
Acknowledgements<br />
Max Nykjær Strunck is thanked for setting up the aerial photographs <strong>and</strong><br />
for helping with the digital elevation model. Thorkild Maack Rasmussen<br />
is thanked for producing the geophysical model <strong>and</strong> Troels F.D. Nielsen is<br />
thanked for valuable discussion <strong>of</strong> the geology <strong>of</strong> the Skaergaard intrusion.<br />
References<br />
Bird, D.K., Brooks, C.K., Gannicott, R.A. & Turner, P.A. 1991: A goldbearing<br />
horizon in the Skaergaard intrusion, East Greenl<strong>and</strong>. Economic<br />
Geology 86, 1083–1092.<br />
Brooks, C.K. 2011: The East Greenl<strong>and</strong> rifted volcanic margin. <strong>Geological</strong><br />
<strong>Survey</strong> <strong>of</strong> <strong>Denmark</strong> <strong>and</strong> Greenl<strong>and</strong> <strong>Bulletin</strong> 24, 96 pp.<br />
Holness, M.B., Nielsen, T.F.D. & Tegner, C. 2007: Textural maturity <strong>of</strong><br />
cumulates: a record <strong>of</strong> chamber filling, liquidus assemblage, cooling rate<br />
<strong>and</strong> large-scale convection in mafic layered intrusions. Journal <strong>of</strong> Petrology<br />
48, 141–157.<br />
McBirney, A.R. 1989: <strong>Geological</strong> map <strong>of</strong> the Skaergaard intrusion, East<br />
Greenl<strong>and</strong>. Eugene, USA: University <strong>of</strong> Oregon (map sheet).<br />
Nielsen, T.F.D. 2004: The shape <strong>and</strong> volume <strong>of</strong> the Skaergaard intrusion,<br />
Greenl<strong>and</strong>: implications for mass balance <strong>and</strong> bulk composition. Journal<br />
<strong>of</strong> Petrology 45, 507–530.<br />
Nielsen, T.F.D. & Brooks, C.K. 1981: The East Greenl<strong>and</strong> rifted continental<br />
margin: an examination <strong>of</strong> the coastal flexure. Journal <strong>of</strong> the<br />
<strong>Geological</strong> Society (London) 138, 559–568.<br />
Nielsen, T.F.D., Andersen, J.C.Ø. & Brooks, C.K. 2005: The Platinova<br />
Reef <strong>of</strong> the Skaergaard intrusion. In: Mungal, J.E. (ed.): Exploration for<br />
platinum group element deposits. Mineralogical Association <strong>of</strong> Canada<br />
Short Course Series 35, 431–455.<br />
Vosgerau H., Guarnieri P., Weibel R., Larsen M., Dennehy, C., Sørensen,<br />
E.V. & Knudsen, C. 2010: Study <strong>of</strong> a Palaeogene intrabasaltic sedimentary<br />
unit in southern East Greenl<strong>and</strong>: from 3-D photogeology to<br />
micropetrography. <strong>Geological</strong> <strong>Survey</strong> <strong>of</strong> <strong>Denmark</strong> <strong>and</strong> Greenl<strong>and</strong> <strong>Bulletin</strong><br />
20, 75–78.<br />
Wager, L.R. & Deer, W.A. 1939 (re-issued 1962): <strong>Geological</strong> investigations<br />
in East Greenl<strong>and</strong>. Part III. The petrology <strong>of</strong> the Skaergaard intrusion,<br />
Kangerdlugssuaq, East Greenl<strong>and</strong>. Meddelelser om Grønl<strong>and</strong><br />
105(4), 352 pp.<br />
Wager, L. R. & Brown, G.M. 1968: Layered igneous rocks, 588 pp. Edinburgh:<br />
Oliver <strong>and</strong> Boyd.<br />
Authors’ address<br />
<strong>Geological</strong> <strong>Survey</strong> <strong>of</strong> <strong>Denmark</strong> <strong>and</strong> Greenl<strong>and</strong>, Øster Voldgade 10, DK-1350 Copenhagen K, <strong>Denmark</strong>. E-mail: ksv@geus.dk<br />
60
<strong>Geological</strong> assessment <strong>of</strong> the East Greenl<strong>and</strong> margin<br />
Michael B.W. Fyhn, Thorkild M. Rasmussen, Trine Dahl-Jensen, Willy L. Weng,<br />
Jørgen A. Bojesen-Koefoed <strong>and</strong> Tove Nielsen<br />
The East Greenl<strong>and</strong> margin consists <strong>of</strong> a number <strong>of</strong> sedimentary<br />
basins, platforms <strong>and</strong> structural highs (Figs 1, 2).<br />
Due to the challenges imposed by the Arctic climate, the<br />
region is in an early stage <strong>of</strong> exploration, <strong>and</strong> knowledge <strong>of</strong><br />
the geology <strong>and</strong> petroleum potential <strong>of</strong> the margin is limited.<br />
However, the significant prospectivity <strong>of</strong> the conjugated European<br />
North Atlantic margin <strong>and</strong> the nature <strong>of</strong> the North-<br />
East Greenl<strong>and</strong> onshore geology prompt for future <strong>of</strong>fshore<br />
exploration. The US <strong>Geological</strong> <strong>Survey</strong> thus highlighted the<br />
North-East Greenl<strong>and</strong> margin in their latest assessment <strong>of</strong><br />
the Arctic region (Gautier et al. 2011). With a mean estimate<br />
<strong>of</strong> undiscovered recoverable oil, gas, <strong>and</strong> natural gas liquids<br />
<strong>of</strong> approximately 31 billion barrels <strong>of</strong> oil equivalents, the US<br />
<strong>Geological</strong> <strong>Survey</strong> ranked the North-East Greenl<strong>and</strong> margin<br />
fourth in the entire Arctic region, only superseded by known<br />
producing petroleum provinces.<br />
In preparation for the initial East Greenl<strong>and</strong> licence<br />
rounds in 2012 <strong>and</strong> 2013 the <strong>Geological</strong> <strong>Survey</strong> <strong>of</strong> <strong>Denmark</strong><br />
<strong>and</strong> Greenl<strong>and</strong> gathers geological information on the<br />
margin necessary for the decision process <strong>of</strong> the Greenl<strong>and</strong><br />
authorities regarding exploration. Geophysical analyses complemented<br />
by well-data, onshore geology <strong>and</strong> information<br />
from the conjugated Atlantic margin form the backbone <strong>of</strong><br />
the study. The East Greenl<strong>and</strong> margin is covered by an open<br />
seismic grid supplemented by gravimetric <strong>and</strong> magnetic data.<br />
All existing 2D seismic, gravimetric <strong>and</strong> magnetic data are<br />
included in the current study. Most <strong>of</strong> the data are confidential.<br />
Restricted by the general confidential nature <strong>of</strong> the<br />
project, this paper aims to summarise the geology <strong>of</strong> the East<br />
Greenl<strong>and</strong> margin based on the current <strong>and</strong> previous studies<br />
<strong>and</strong> to briefly assess some <strong>of</strong> the implications for the regional<br />
petroleum prospectivity.<br />
East Greenl<strong>and</strong> margin south <strong>of</strong> Shannon<br />
A continuous Paleocene–Eocene (61–53 Ma) pre- to postbreak-up<br />
volcanic cover blankets almost the entire East<br />
Greenl<strong>and</strong> margin between Kap Farvel <strong>and</strong> the isl<strong>and</strong> <strong>of</strong><br />
Shannon (Fig. 1). Paleocene – Early Eocene magmatism re-<br />
Nordostrundingen<br />
Shannon<br />
Hold with Hope<br />
70°N<br />
Liverpool<br />
L<strong>and</strong><br />
Blosseville<br />
Kyst<br />
10°W<br />
ODP P9<br />
917A<br />
ODP 987E<br />
Fig. 3<br />
[nT]<br />
345<br />
174<br />
110<br />
82<br />
59<br />
39<br />
23<br />
7<br />
–16<br />
–37<br />
–59<br />
–83<br />
–112<br />
–156<br />
–<strong>26</strong>4<br />
-1<br />
East Greenl<strong>and</strong> <strong>of</strong>fshore geology<br />
The East Greenl<strong>and</strong> margin stretches almost 3000 km from<br />
Kap Farvel in the south to Nordostrundingen in the north<br />
(Fig. 1). In the south it is narrow, but north <strong>of</strong> Liverpool<br />
L<strong>and</strong> it begins to widen to more than 300 km. The geology<br />
varies considerably along its length.<br />
Kap Farvel<br />
Continent–Ocean<br />
transition<br />
250 km<br />
Fig. 1. The East Greenl<strong>and</strong> margin from Kap Farvel to Nordostrundingen<br />
with <strong>of</strong>fshore magnetic total field anomaly from the CAMP-GM compilation<br />
(Gaina et al. 2009).<br />
© 2012 GEUS. <strong>Geological</strong> <strong>Survey</strong> <strong>of</strong> <strong>Denmark</strong> <strong>and</strong> Greenl<strong>and</strong> <strong>Bulletin</strong> <strong>26</strong>, 61–64. Open access: www.geus.dk/publications/bull<br />
61
cords the trace <strong>of</strong> the Icel<strong>and</strong>ic hotspot that induced magmatism<br />
along most <strong>of</strong> the proto-North Atlantic margin<br />
<strong>and</strong> likely led to continental break-up between Europe <strong>and</strong><br />
Greenl<strong>and</strong>.<br />
Thick seaward-dipping reflection packages interpreted<br />
as basalt flows exist near the continent–ocean transition indicating<br />
the presence <strong>of</strong> a very thick basalt-dominated succession<br />
below the distal part <strong>of</strong> the margin (Fig. 3). Basalt<br />
successions several hundred metres to kilometres thick exist<br />
onshore central East <strong>and</strong> North-East Greenl<strong>and</strong>. It is likely<br />
that similar <strong>and</strong> thicker Paleocene – Lower Eocene basalt<br />
successions cover large parts <strong>of</strong> the <strong>of</strong>fshore margin judging<br />
from seismic data, wells <strong>and</strong> onshore analogies (Fig. 2).<br />
Only the ODP well 917A <strong>of</strong>fshore South-East Greenl<strong>and</strong><br />
penetrates the entire basaltic cover (Fig. 1; Larsen & Saunders<br />
1998). The well was drilled on the shoreward part <strong>of</strong><br />
the margin <strong>and</strong> encountered 779.5 m <strong>of</strong> mainly basalts <strong>and</strong><br />
Offshore NE Greenl<strong>and</strong> with<br />
licence area<br />
Area covered by U. Paleocene –<br />
L. Eocene flood basalts<br />
U. Paleocene – L. Eocene basalts<br />
likely concealed underneath<br />
younger geology<br />
Area with U. Paleocene –<br />
L. Eocene intrusions<br />
<strong>and</strong> sporadic volcanics<br />
Post L. Eocene basalts<br />
Approximate continent–<br />
ocean transition zone<br />
Ocean crust<br />
Major normal fault<br />
Anticlinal trend<br />
50 000 km 2 licence area <strong>and</strong><br />
blocks<br />
Seismic line<br />
Core hole<br />
25°W 15°W<br />
?<br />
?<br />
?<br />
Koldewey Platform<br />
Shannon<br />
15°W 5°W<br />
Danmarkshavn Basin<br />
Danmarkshavn Ridge<br />
Thetis Basin<br />
200 km<br />
Fig. 2. The extent <strong>of</strong> massive volcanism along the North-East Greenl<strong>and</strong><br />
margin. Magmatism influenced areas up to 200 km north <strong>of</strong> the basalt<br />
cover as indicated by the heavily intruded part <strong>of</strong> the Thetis <strong>and</strong> Danmarkshavn<br />
Basins.<br />
75°N<br />
70°N<br />
thus documents the presence <strong>of</strong> a thick volcanic cover in the<br />
shoreward part <strong>of</strong> the margin that, according to seismic evidence,<br />
significantly thickens seawards.<br />
Offshore Liverpool L<strong>and</strong>, the Paleocene/Eocene top-basalt<br />
surface is not clearly discernable on all seismic transects.<br />
However, this is probably due to the deep burial <strong>of</strong> the basalt<br />
succession beneath a thick post-basaltic cover. In the area<br />
<strong>of</strong>fshore Hold with Hope, the presence <strong>of</strong> volcanics younger<br />
than the regional Upper Paleocene – Lower Eocene flood basalts<br />
is interpreted from seismic data (Fig. 2). These are likely<br />
to be genetically related to Middle Eocene – earliest Miocene<br />
magmatism observed immediately onshore.<br />
Sub-basalt sediments. The Tertiary basalt cover generally impedes<br />
seismic imaging <strong>of</strong> the deeper geology. Offshore South-<br />
East Greenl<strong>and</strong>, sub-basaltic acoustic velocities derived from<br />
refraction seismic data generally range from 4.5 to 6 km/s<br />
increasing downwards (Hopper et al. 2003), which does not<br />
provide unequivocal evidence for regional, thick sub-basaltic<br />
sedimentary basins.<br />
A sub-basaltic succession <strong>of</strong> deformed metasediments<br />
barren <strong>of</strong> fossils drilled in ODP well 917A was suggested to<br />
be Upper Cretaceous to Lower Paleocene in age, like onshore<br />
sediments farther north (Larsen & Saunders 1998). However,<br />
the succession could also represent much older Caledonian<br />
metasediments formed in a forel<strong>and</strong> setting, comparable<br />
to onshore metasediments farther to the north <strong>and</strong> lying<br />
beneath the conjugated British margin.<br />
Offshore North-East Greenl<strong>and</strong>, Upper Palaeozoic –<br />
Mesozoic deposits below the basalts are suggested by the<br />
presence <strong>of</strong> thick such deposits along the shore, immediately<br />
onshore <strong>and</strong> on the conjugated Norwegian North Atlantic<br />
margin. Moreover, a thick pre-basaltic sedimentary succession<br />
can be recognised <strong>of</strong>fshore Shannon, continuing southwards<br />
below the basalts.<br />
Post-Paleocene sediments. The Eocene <strong>and</strong> younger succession<br />
between Kap Farvel <strong>and</strong> Shannon attains thicknesses<br />
up to c. 3 sec two-way travel time (TWT). The succession is<br />
absent or very thin shoreward, <strong>and</strong> over large areas, break-up<br />
volcanics <strong>and</strong> Upper Palaeozoic <strong>and</strong> Caledonian basement<br />
crop out at the seafloor.<br />
Farther <strong>of</strong>fshore, an Eocene <strong>and</strong> younger shelf progradation<br />
along most <strong>of</strong> the margin resulted in the build-up <strong>of</strong><br />
the prominent modern shelf-slope that generally straddles<br />
the continent–ocean transition. The Blosseville Kyst Fault<br />
Zone along the Blosseville Kyst <strong>and</strong> its northern continuation<br />
the Liverpool L<strong>and</strong> Fault Zone downfault the break-up<br />
volcanic cover with up to 2 sec TWT (Fig. 2). Rifting along<br />
Blosseville Kyst <strong>and</strong> Livepool L<strong>and</strong> Fault Zones was likely<br />
62
Two-way travel time (sec)<br />
0<br />
1<br />
2<br />
3<br />
4<br />
W<br />
Fan delta<br />
Liverpool L<strong>and</strong><br />
Fault Zone<br />
E<br />
ODP 987E<br />
5<br />
Top <strong>of</strong> Oligocene–Miocene basalts<br />
10 km<br />
SDRs<br />
Fig. 3. An E–W seismic pr<strong>of</strong>ile crossing the Liverpool L<strong>and</strong> Fault Zone <strong>and</strong> related syn-tectonic fan delta deposits <strong>and</strong> the continent–ocean transition<br />
indicated by seaward-dipping reflectors (SDRs). The ODP 987E well drilled Recent to Miocene strata <strong>and</strong> terminated slightly above the basalts.<br />
associated with a westward jump <strong>of</strong> the spreading axis <strong>and</strong><br />
the separation <strong>of</strong> the Jan Mayen microcontinent from central<br />
East Greenl<strong>and</strong> during mid-Cenozoic time (Mjelde et al.<br />
2008). Faulting mostly affected the lower part <strong>of</strong> the postbreak-up<br />
succession, <strong>and</strong> a significant syn-tectonic fan delta<br />
flanks the fault zones suggesting (?)Late Eocene/Oligocene<br />
to c. Early Miocene faulting (Fig. 3). Faults only penetrate<br />
the seafloor near the coast where erosion <strong>and</strong> non-deposition<br />
have prevented fault burial.<br />
East Greenl<strong>and</strong> margin north <strong>of</strong> Shannon<br />
North <strong>of</strong> the isl<strong>and</strong> <strong>of</strong> Shannon, the l<strong>and</strong>ward edge <strong>of</strong> the basalt<br />
cover curves to the east <strong>and</strong> continues farther seawards to<br />
the north where a wide basalt belt fringes the continent–ocean<br />
transition (Fig. 2). This leaves the shelf area north <strong>of</strong> Shannon<br />
virtually unaffected by Tertiary flood basalts <strong>and</strong> thus<br />
permits fair to good seismic imaging <strong>of</strong> Paleocene <strong>and</strong> older<br />
successions. As a result, up to c. 10 sec TWT several deep sediment-filled<br />
basins can be recognised north <strong>of</strong> Shannon that<br />
are likely to correspond to between 15 <strong>and</strong> 20 km <strong>of</strong> sedimentary<br />
infill.<br />
The area can be structurally divided into the Danmarkshavn<br />
<strong>and</strong> Thetis Basins separated by the Danmarkshavn<br />
Ridge – a c. 300 km long rifted basement high (Fig. 2). The<br />
Danmarkshavn Basin is downfaulted relative to the Koldewey<br />
Platform to the west <strong>and</strong> the Danmarkshavn Ridge to<br />
the east. The Thetis Basin marks the oceanward part <strong>of</strong> the<br />
North-East Greenl<strong>and</strong> margin that borders the North Atlantic<br />
oceanic crust. The depositional succession filling in<br />
the Thetis Basin may be <strong>of</strong> comparative thickness to that <strong>of</strong><br />
the Danmarkshavn Basin, but there are significant differences<br />
in the geological development <strong>of</strong> the two basins.<br />
The Koldewey Platform makes up an area <strong>of</strong> sedimentcovered,<br />
more shallow basement bridging the Danmarkshavn<br />
Basin <strong>and</strong> the onshore basement province. The Danmarkshavn<br />
Ridge st<strong>and</strong>s in marked contrast to the deeply downfaulted<br />
Thetis Basin farther east. As the high degrades into<br />
fault blocks to the north, the ridge plunges <strong>and</strong> the structural<br />
separation <strong>of</strong> the Thetis <strong>and</strong> Danmarkshavn Basins crumbles.<br />
Structural <strong>and</strong> stratigraphic development. The deepest deposits<br />
in the Danmarkshavn Basin <strong>and</strong> on the Danmarkshavn<br />
Ridge form a prominent syn-rift succession interpreted to be<br />
Devonian <strong>and</strong> Carboniferous in age (Hamann et al. 2005).<br />
The unit is located in a rift system <strong>of</strong>ten confined by lowangle<br />
extensional faults, which may reflect extensional reactivation<br />
<strong>of</strong> Caledonian thrust faults.<br />
The syn-rift succession is overlain by a unit in the central<br />
<strong>and</strong> southern part <strong>of</strong> the Danmarkshavn Basin that has in<br />
places been mobilised into diapiric <strong>and</strong> pillow-like structures<br />
interpreted as salt kinetic features. The succession is interpreted<br />
as Lower Carboniferous to Early Permian deposits<br />
comparable to coeval sediments in the western part <strong>of</strong> the<br />
Barents Sea (Hamann et al. 2005).<br />
The Late Palaeozoic successions are buried beneath an up<br />
to a few kilometres thick unit only moderately affected by<br />
syn-depositional faulting <strong>and</strong> interpreted as Upper Permian<br />
– Jurassic deposits. By analogy to the conjugated Atlantic<br />
margin <strong>and</strong> onshore geology, the Upper Permian – Jurassic<br />
succession is likely to contain a number <strong>of</strong> prominent source<br />
rock intervals. Of these the Upper Jurassic equivalent to the<br />
Kimmeridge Clay Formation may be <strong>of</strong> particular importance<br />
to potential petroleum systems in the region.<br />
The top <strong>of</strong> the Jurassic is marked by a pronounced angular<br />
unconformity associated with the onset <strong>of</strong> Cretaceous rifting<br />
63
(Hamann et al. 2005). Cretaceous rifting resulted in several<br />
kilometres <strong>of</strong> downfaulting towards the Thetis Basin, <strong>and</strong> to<br />
a lesser extent also along the margins <strong>of</strong> the Danmarkshavn<br />
Basin. Consequently, the Danmarkshavn Ridge became an<br />
elevated rift-shoulder subject to erosion during most <strong>of</strong> the<br />
Cretaceous. In contrast, vast amounts <strong>of</strong> sediment were shed<br />
into the adjacent basins <strong>and</strong> kilometre-thick Cretaceous successions<br />
exist in the depocentres. Large fault- <strong>and</strong> anticlinal<br />
structures within Cretaceous <strong>and</strong> older successions formed<br />
in association with the Cretaceous extension. Many <strong>of</strong> these<br />
resemble structures hosting world-class oil <strong>and</strong> gas fields on<br />
the conjugate European Atlantic margin, thus boosting expectations<br />
for the North-East Greenl<strong>and</strong> margin.<br />
A change from fault-controlled subsidence concentrated<br />
along the basins to regional eastward tilting took place close<br />
to the Cretaceous/Tertiary boundary. The change resulted<br />
in flooding <strong>and</strong> burial <strong>of</strong> the Danmarkshavn Ridge during<br />
the Early Tertiary <strong>and</strong> instigated regional eastwards progradation<br />
across the basin areas.<br />
Only modest volcanism, if any, took place across the basins<br />
north <strong>of</strong> Shannon. However, the southern Danmarkshavn<br />
<strong>and</strong> Thetis Basins were heavily intruded far north <strong>of</strong><br />
the edge <strong>of</strong> the East Greenl<strong>and</strong> basalt province, which degrades<br />
seismic imaging <strong>of</strong> the deepest stratigraphy over large<br />
areas. During mid-Tertiary time, sediment supply increased<br />
resulting in build-up <strong>and</strong> eastward progradation <strong>of</strong> a steep<br />
shelf-slope. This was likely caused by denudation <strong>of</strong> the East<br />
Greenl<strong>and</strong> margin <strong>and</strong> the inner basin areas. As a result, the<br />
Lower Tertiary <strong>and</strong> Mesozoic deposits lie beneath the Plio/<br />
Pleistocene sediments along the inner half <strong>of</strong> the North-East<br />
Greenl<strong>and</strong> shelf.<br />
Implications for the petroleum<br />
prospectivity <strong>of</strong>fshore East Greenl<strong>and</strong><br />
Assessment <strong>of</strong> the petroleum prospectivity along the South-<br />
East <strong>and</strong> central East Greenl<strong>and</strong> margin is associated with<br />
considerable uncertainties. A sub-basaltic source rock seems<br />
to be a prerequisite for a working petroleum system along<br />
the margin, but the thick volcanic cover complicates analysis<br />
<strong>of</strong> the deeper geology. Regional presence <strong>of</strong> sub-basaltic basins<br />
is at present uncertain <strong>of</strong>fshore South-East Greenl<strong>and</strong>,<br />
which also makes the prediction <strong>of</strong> an effective petroleum<br />
system along this part <strong>of</strong> the margin uncertain. Farther<br />
north between Liverpool L<strong>and</strong> <strong>and</strong> Shannon the chances<br />
<strong>of</strong> sub-basaltic basins containing significant source-rock intervals<br />
are high. However, interpretation <strong>of</strong> the sub-basaltic<br />
structural style is problematic at present <strong>and</strong> the maturation<br />
history <strong>of</strong> potential source-rock intervals is uncertain, which<br />
complicates the prospectivity assesment.<br />
Farther north, extreme sea-ice conditions are a major impediment<br />
to future exploration. In addition, Tertiary uplift<br />
<strong>and</strong> erosion as well as past glacial advances across the shelf<br />
may have affected the regional petroleum potential. However,<br />
the presence <strong>of</strong> large structures <strong>and</strong> the good chance <strong>of</strong><br />
adequately matured source-rock intervals urge for further<br />
investigation. The highest density <strong>of</strong> structures is located<br />
along the flanks <strong>of</strong> the basins <strong>and</strong> across the Danmarkshavn<br />
Ridge, which are also the areas covered in the coming licence<br />
rounds (Fig. 2). Many <strong>of</strong> these structures are associated with<br />
significant potential direct hydrocarbon indicators, which<br />
may reflect the presence <strong>of</strong> significant petroleum accumulations<br />
<strong>of</strong>fshore North-East Greenl<strong>and</strong>. This is highly encouraging<br />
for further exploration in one <strong>of</strong> the last frontier areas<br />
on Earth.<br />
Acknowledgement<br />
The Bureau <strong>of</strong> Minerals <strong>and</strong> Petroleum, Nuuk, is acknowledged for funding.<br />
References<br />
Gaina, C., Werner, S.C. & the CAMP-GM group 2009: Circum-Arctic<br />
mapping project – gravity <strong>and</strong> magnetic maps. Report 2009.010, 21 pp.<br />
Trondheim: <strong>Geological</strong> <strong>Survey</strong> <strong>of</strong> Norway.<br />
Gautier, D.L. et al. 2011: Assessment <strong>of</strong> NE Greenl<strong>and</strong>: prototype for<br />
development <strong>of</strong> Circum-Arctic resource appraisal methodology. In:<br />
Spencer, A.M. et al. (eds): Arctic petroleum geology. <strong>Geological</strong> Society<br />
Memoirs (London) 35, 663–672.<br />
Hamann, N.E., Whittaker, R.C. & Stemmerik, L. 2005: <strong>Geological</strong> development<br />
<strong>of</strong> the Northeast Greenl<strong>and</strong> shelf. In: Doré, A.G. & Vining,<br />
B.A. (eds): Petroleum geology: North-West Europe <strong>and</strong> global perspectives.<br />
Proceedings <strong>of</strong> the 6th Petroleum Geology Conference, 887–902.<br />
London: <strong>Geological</strong> Society.<br />
Hopper, J.R., Dahl-Jensen, T., Holbrook, W.S., Larsen, H.C., Lizarralde,<br />
D., Korenaga, J., Kent, G.M. & Kelemen, P.B. 2003: Structure <strong>of</strong> the SE<br />
Greenl<strong>and</strong> margin from seismic reflection <strong>and</strong> refraction data: Implications<br />
for nascent spreading center subsidence <strong>and</strong> asymmetric crustal<br />
accretion during North Atlantic opening. Journal <strong>of</strong> Geophysical research<br />
108, 2<strong>26</strong>9, http://dx.doi.org/10.1029/2002JB001996<br />
Larsen, H.C. & Saunders, A.D. 1998: Tectonism <strong>and</strong> volcanism at the<br />
southeast Greenl<strong>and</strong> rifted margin: a record <strong>of</strong> plume impact <strong>and</strong> later<br />
continental rupture. In: Saunders, A.D., Larsen, H.C. & Wise, S.W.<br />
(eds): Proceedings <strong>of</strong> the Ocean Drilling Program Scientific results<br />
152, 503–533.<br />
Mjelde, R., Raum, T., Breivik, A.J. & Faleide, J.I. 2008: Crustal transect<br />
across the North Atlantic. Marine Geophysical Research 29, 73–87.<br />
Authors’ address<br />
<strong>Geological</strong> <strong>Survey</strong> <strong>of</strong> <strong>Denmark</strong> <strong>and</strong> Greenl<strong>and</strong>, Øster Voldgade 10, DK-1350 Copenhagen K, <strong>Denmark</strong>. E-mail: mbwf@geus.dk<br />
64
New evidence for possible generation <strong>of</strong> oil<br />
<strong>of</strong>f south-western Greenl<strong>and</strong><br />
Troels Laier <strong>and</strong> Hans Peter Nyt<strong>of</strong>t<br />
In 2011, traces <strong>of</strong> bitumen in the 1160 Ma old Ilímaussaq intrusion<br />
in South Greenl<strong>and</strong> have been examined in order to<br />
determine their origin. The investigation was prompted by<br />
the recent interest in hydrocarbon exploration <strong>of</strong>f western<br />
Greenl<strong>and</strong>, an interest expressed in the form <strong>of</strong> four new licences<br />
in the region (Christiansen 2011). The hydrocarbon<br />
potential in the region was realised after reinterpretation <strong>of</strong><br />
seismic pr<strong>of</strong>iles across the Labrador Sea, <strong>and</strong> this indicates<br />
the presence <strong>of</strong> a sedimentary basin <strong>of</strong>f south-western Greenl<strong>and</strong><br />
(Fig. 1; Chalmers & Pulvertaft 2001). However, the<br />
main problem in petroleum exploration <strong>of</strong>f south-western<br />
Greenl<strong>and</strong> is that no prolific marine source rocks have been<br />
demonstrated (Christiansen 2011). Therefore, any trace <strong>of</strong><br />
hydrocarbons, however small that may help demonstrate the<br />
occurrence <strong>of</strong> source rocks in the region, deserves careful examination.<br />
Recently, bitumen biomarkers have been used to question<br />
the presumed abiogenic origin <strong>of</strong> hydrocarbons in crystalline<br />
rocks <strong>of</strong> the Ilímaussaq intrusion (Laier & Nyt<strong>of</strong>t 2012). In<br />
this paper, we focus on the origin <strong>of</strong> the bitumen <strong>and</strong> compare<br />
it with previous finds in central West Greenl<strong>and</strong>. The<br />
presence <strong>of</strong> hydrocarbons in the Ilímaussaq intrusion has<br />
been known since 1970 (Petersilie & Sørensen 1970) but<br />
unlike the discovery <strong>of</strong> oil seeps in the Nuussuaq region in<br />
central West Greenl<strong>and</strong> twenty years later, which had a positive<br />
impact on petroleum exploration (Christiansen 2011),<br />
the hydrocarbons in the Ilímaussaq intrusion were largely<br />
ignored in the context <strong>of</strong> <strong>of</strong>fshore exploration. The reason<br />
for this is tw<strong>of</strong>old: (1) hydrocarbons in the Ilímaussaq intrusion<br />
are much more difficult to recognise than on Nuussuaq,<br />
<strong>and</strong> (2) analytical results are confusing with respect<br />
to the origin <strong>of</strong> the hydrocarbons. Discrete millimetre-size<br />
hydrocarbon accumulations have only been observed twice,<br />
<strong>and</strong> samples <strong>of</strong> this material were unfortunately not available<br />
for analysis in the present investigation. The material,<br />
which is a waxy paraffinic hydrocarbon <strong>of</strong> C 28<br />
H 56<br />
, was located<br />
in vugs <strong>of</strong> pegmatite veins <strong>and</strong> labelled as an evenkitelike<br />
mineral by Konnerup-Madsen et al. (1979). Otherwise<br />
hydrocarbons in the Ilímaussaq intrusion only exist in fluid<br />
inclusions, mainly as C 1<br />
–C 5,<br />
<strong>and</strong> as dispersed bitumen invisible<br />
to the naked eye. The stable carbon isotopic ratio <strong>of</strong> methane<br />
(δ 13 C = –7‰) released from the inclusions by crushing<br />
(Petersilie & Sørensen 1970) differed from that <strong>of</strong> associated<br />
methane in most oil <strong>and</strong> gas reservoirs, which has δ 13 C values<br />
<strong>of</strong> –30 to –50‰. The ratio was closer to the isotopic ratio<br />
<strong>of</strong> primodial carbon <strong>of</strong> the Earth’s mantle, which has δ 13 C<br />
values around –5‰. The paraffinic hydrocarbons <strong>of</strong> ‘evenkite’<br />
on the other h<strong>and</strong> had a δ 13 C value <strong>of</strong> –29‰, which<br />
is within the expected range for hydrocarbons generated by<br />
thermal maturation <strong>of</strong> organic matter (Konnerup-Madsen et<br />
al. 1988).<br />
66°N<br />
Greenl<strong>and</strong><br />
60°N<br />
Nuussuaq<br />
Marraat<br />
100 km<br />
Ilímaussaq<br />
intrusion<br />
48°W<br />
66°N<br />
Fig. 1. Map <strong>of</strong> south-western Greenl<strong>and</strong> showing the distribution <strong>of</strong> Mesozoic/Cenozoic<br />
rift basins <strong>of</strong>fshore (green). Modified from Chalmers &<br />
Pulvertaft (2001). Oil seeps occur on Nuussuaq.<br />
© 2012 GEUS. <strong>Geological</strong> <strong>Survey</strong> <strong>of</strong> <strong>Denmark</strong> <strong>and</strong> Greenl<strong>and</strong> <strong>Bulletin</strong> <strong>26</strong>, 65–68. Open access: www.geus.dk/publications/bull<br />
65
A<br />
B<br />
GC-FID<br />
Pr Phy<br />
nC25<br />
nC15<br />
nC30<br />
GC-MS<br />
m/z 191<br />
H29<br />
H30<br />
C<br />
D<br />
Tm<br />
Ts<br />
H31<br />
H32<br />
H33 H34 H35<br />
100 μm<br />
Fig. 2. Photomicrographs <strong>of</strong> lujavrite (GGU 57033) viewed under visible<br />
light (A, B) <strong>and</strong> in ultraviolet light (C, D) showing hydrocarbons along the<br />
edges <strong>of</strong> eudialyte crystals <strong>and</strong> as traces <strong>of</strong> tiny inclusions within the crystals.<br />
Dispersed bitumen in crystalline rocks<br />
The distribution <strong>of</strong> bitumen was examined by microscopy<br />
using ultraviolet light, which causes the aromatic constituents<br />
<strong>of</strong> bitumen to fluoresce. Unfortunately, a number <strong>of</strong> the<br />
rather common minerals, e.g. sodalite, in different rock types<br />
<strong>of</strong> the Ilímaussaq intrusion also fluoresce strongly making it<br />
almost impossible to indentify traces <strong>of</strong> bitumen with certainty<br />
in some samples. Lujavrite contains only little sodalite<br />
<strong>and</strong> <strong>of</strong>fers the best possibility to study the distribution<br />
<strong>of</strong> bitumen (Fig. 2). The bitumen occurs along crystal edges<br />
<strong>and</strong> as trails <strong>of</strong> tiny inclusions within single crystals <strong>of</strong>, for<br />
example, eudialyte. Trails <strong>of</strong> tiny inclusions are usually taken<br />
as evidence <strong>of</strong> a secondary origin formed in healed fractures.<br />
Thus hydrocarbons probably migrated through the rock <strong>and</strong><br />
were trapped in certain minerals.<br />
Bitumen content <strong>and</strong> composition<br />
It was possible to extract bitumen from naujaite, kakortokite<br />
<strong>and</strong> lujavrite, which are the three major rock types in the Ilímaussaq<br />
intrusion, by using a 7:1 mixture <strong>of</strong> dichloromethane<br />
<strong>and</strong> methanol. The bitumen content varied from 110 to<br />
300 mg per kg rock <strong>and</strong> consisted <strong>of</strong> paraffins (20%), aromates<br />
(20%), NSO compounds (compounds with nitrogen,<br />
sulphur <strong>and</strong> oxygen; 50%) <strong>and</strong> asphaltenes (10%). The nonpolar<br />
fraction from the different rock extracts was analysed<br />
by gas chromatography with a flame-ionisation detector for<br />
total composition <strong>and</strong> mass spectrometry for biomarker<br />
GC-MS<br />
m/z 217<br />
αα S<br />
Fig. 3. Chromatograms <strong>of</strong> the aliphatic fraction <strong>of</strong> extract from Ilímaussaq<br />
kakortokite m/z 191 (hopanes+tricyclic) <strong>and</strong> m/z 217 (steranes). FID: flame<br />
ionisation detector, GC-MS: gas chromatography - mass spectrometry.<br />
characterisation (Fig. 3). All samples gave very similar m/z<br />
217 chromatograms showing a typical marine sterane distribution,<br />
although the presence <strong>of</strong> oleananes in the m/z 191<br />
chromatogram suggests some input from l<strong>and</strong> plants. Oleananes<br />
are derived from angiosperms, which appeared in the<br />
Late Cretaceous, <strong>and</strong> hence the presence <strong>of</strong> oleananes provides<br />
a maximum age for the source <strong>of</strong> the bitumen. Since<br />
other triterpanes are known to co-elute with oleananes, gas<br />
chromatograph mass spectrometry (GC-MS-MS) was also<br />
conducted to confirm their presence (Fig. 4). The GC-MS-<br />
MS analysis not only confirmed the presence <strong>of</strong> oleananes<br />
but also showed the existence <strong>of</strong> bicadinanes, which is a less<br />
common group <strong>of</strong> biomarkers from l<strong>and</strong> plants from Late<br />
Cretaceous or Tertiary. Oleananes <strong>and</strong> bicadinanes were<br />
also observed in oil seeps from the Nuussuaq region (Fig. 4;<br />
Bojesen-Koefoed et al. 1999; Nyt<strong>of</strong>t et al. 2002).<br />
Migration <strong>and</strong> entrapment <strong>of</strong><br />
hydrocarbons<br />
Not only is bitumen much more difficult to recognise in<br />
rocks from the Ilímaussaq intrusion than in basalts from<br />
Nuussuaq, but the migration route <strong>of</strong> hydrocarbons to the<br />
Ilímaussaq intrusion is also less evident. In Nuussuaq the oil<br />
seeps are found in Tertiary plateau basalts overlying Cretaceous<br />
<strong>and</strong> Tertiary sediments, some <strong>of</strong> which are potential<br />
C29<br />
αα R<br />
66
source rocks. In the Ilímaussaq intrusion, the bitumen is<br />
found in Proterozoic crystalline rocks which are much older<br />
than the source rock, which is not older than Late Cretaceous<br />
as shown by the presence <strong>of</strong> oleanes <strong>and</strong> bicadinanes.<br />
In contrast to the Nuussuaq region, no potential source<br />
rock for hydrocarbons has been reported in South Greenl<strong>and</strong>,<br />
where Proterozoic gneisses <strong>and</strong> granites, igneous <strong>and</strong><br />
sedimentary rocks are found. The youngest rocks in South<br />
Greenl<strong>and</strong> are those <strong>of</strong> the Gardar Province (c. 1300–1100<br />
Ma), which is dominated by continental s<strong>and</strong>stones <strong>and</strong> lavas<br />
with numerous dykes <strong>and</strong> large intrusions (Poulsen 1964),<br />
one <strong>of</strong> which is the Ilímaussaq peralkaline intrusion. The Ilímaussaq<br />
intrusion solidified 3–4 km below the surface but is<br />
now exposed as a result <strong>of</strong> erosion. The latest uplift <strong>and</strong> erosion<br />
started c. 35 Ma ago according to thermo-chronometric<br />
investigations (Japsen et al. 2006). However, the latest uplift<br />
phase was preceded by subsidence during Late Cretaceous to<br />
Eocene. During this subsidence phase the region was prob-<br />
Marraat oil<br />
Nuussuaq<br />
GGU 314654<br />
II<br />
H4<br />
Ilímaussaq<br />
lujavrite<br />
GGU 57033<br />
H4<br />
III + ?<br />
100<br />
412 191<br />
H1 T<br />
I<br />
H2<br />
H3<br />
Ol+ Lup<br />
H5<br />
H6<br />
100<br />
412 191<br />
H1<br />
T<br />
H2<br />
H3<br />
Ol+ Lup<br />
H5 H6<br />
43 44 45 46 47 48 43 44 45 46 47<br />
48<br />
I<br />
Ol+ Lup<br />
H4<br />
T<br />
H2<br />
H4<br />
10<br />
412 369<br />
T<br />
T1<br />
R<br />
H2<br />
H6<br />
11<br />
412 369<br />
T1<br />
R<br />
Ol+ Lup<br />
43 44 45 46 47<br />
48<br />
Retention time (min)<br />
Oil seep<br />
H4<br />
Nuussuaq<br />
GGU 414869A<br />
43 44 45 46 47<br />
48<br />
Retention time (min)<br />
Ilímaussaq<br />
naujaite<br />
GGU 154344<br />
H4<br />
100<br />
412 191<br />
H1 T<br />
H2<br />
H3<br />
Ol + Lup<br />
H5<br />
H6<br />
100<br />
412 191<br />
T<br />
H1<br />
H2<br />
H3<br />
Ol+ Lup<br />
H5 H6<br />
43<br />
T<br />
44<br />
45<br />
46<br />
47<br />
48<br />
43 44 45 46 47<br />
48<br />
H4<br />
H4<br />
H2<br />
10<br />
412 369<br />
T1<br />
R<br />
H2<br />
Ol+ Lup<br />
H6<br />
5<br />
412 369<br />
T<br />
Ol+ Lup<br />
T1<br />
R<br />
43<br />
44<br />
45<br />
46<br />
47<br />
Retention time (min)<br />
48<br />
43 44 45 46 47<br />
Retention time (min)<br />
48<br />
Fig. 4. Pentacyclic C 30<br />
triterpanes in an Ilímaussaq bitumen (412 → 191 <strong>and</strong> 412 → 369). Numbered peaks: oleananes (Ol + Lup) <strong>and</strong> similar l<strong>and</strong>-plant<br />
components (I – III). Peaks H1–H6: hopanoids. Peaks T, T1 <strong>and</strong> R: bicadinanes.<br />
67
A<br />
B<br />
1150 Ma<br />
Mesozoic<br />
rocks from the Ilímaussaq intrusion were considered to be<br />
abiogenic in origin on the basis <strong>of</strong> the heavy isotopic value <strong>of</strong><br />
methane (Petersilie & Sørensen 1970; Konnerup-Madsen et<br />
al. 1988). However, they may also be <strong>of</strong> organic origin if the<br />
isotopic ratio <strong>of</strong> the gases was altered by fractionation due<br />
to diffusion <strong>of</strong> gases from the rocks (Laier & Nyt<strong>of</strong>t 2012).<br />
C<br />
D<br />
Palaeogene<br />
Present<br />
Granite<br />
Rift deposits<br />
Lavas<br />
Intrusion<br />
Cretaceous<br />
Palaeogene<br />
Fig. 5. Sketch <strong>of</strong> the geological evolution <strong>of</strong> the Ilímaussaq area.<br />
Migrating fluids,<br />
including hydrocarbons<br />
ably covered by up to 2 km <strong>of</strong> marine sediments (Chalmers &<br />
Pulvertaft 2001; Japsen et al. 2006). The reburial <strong>and</strong> uplift<br />
history in South Greenl<strong>and</strong> was probably similar to that <strong>of</strong><br />
West Greenl<strong>and</strong>, including the Nuussuaq region (Bonow et<br />
al. 2007). Thus it is likely that hydrocarbons migrated from<br />
marine sediments into the rocks <strong>of</strong> the Ilímaussaq intrusion<br />
during the period <strong>of</strong> reburial (Fig. 5).<br />
Hydrocarbons have only been reported from the Ilímaussaq<br />
intrusion <strong>and</strong> not from other rocks in South Greenl<strong>and</strong>.<br />
There may be two reasons for this: (1) rocks from the<br />
Ilímaussaq intrusion have been studied in much more detail<br />
than other rocks due to the occurrence <strong>of</strong> rare minerals, some<br />
<strong>of</strong> which have economic potential, <strong>and</strong> (2) the Ilímaussaq intrusion<br />
may be more deeply weathered than other rocks in<br />
the region because it contains water-soluble minerals (Rose-<br />
Hansen & Sørensen 2002).<br />
From the biomarkers found in the bitumen, there is little<br />
doubt that the hydrocarbons were generated by thermal<br />
maturation <strong>of</strong> a marine source rock <strong>and</strong> migrated into the<br />
rocks <strong>of</strong> the Ilímaussaq intrusion at a later stage. It is unlikely<br />
that the bitumen formed by condensation <strong>of</strong> lighter hydrocarbons<br />
<strong>of</strong> abiogenic origin as hypothesised by Petersilie &<br />
Sørensen (1970). Hydrocarbon gases in fluid inclusions in<br />
References<br />
Bojesen-Koefoed, J.A., Christiansen, F.G., Nyt<strong>of</strong>t, H.P. & Pedersen, A.K.<br />
1999: Oil seepage onshore West Greenl<strong>and</strong>: evidence <strong>of</strong> multiple source<br />
rocks <strong>and</strong> oil mixing. In: Fleet, A.J. & Boldy, S.A.R. (eds): Petroleum<br />
geology <strong>of</strong> Northwest Europe. Proceedings <strong>of</strong> the 5th Conference. Petroleum<br />
Geology Conference Series 5, 305–314. London: <strong>Geological</strong><br />
Society.<br />
Bonow, J.M., Japsen, P., Green, P.F., Wilson, R.F., Chalmers, J.A., Klint,<br />
K.E., van Gool, J.A.M., Lidmar-Bergström, K. & Pedersen, A.K. 2007:<br />
A multi-disciplinary study <strong>of</strong> Phanerozoic l<strong>and</strong>scape development in<br />
West Greenl<strong>and</strong>. <strong>Geological</strong> <strong>Survey</strong> <strong>of</strong> <strong>Denmark</strong> <strong>and</strong> Greenl<strong>and</strong> <strong>Bulletin</strong><br />
13, 41–44.<br />
Chalmers, J.A. & Pulvertaft, T.C.R. 2001: Development <strong>of</strong> the continental<br />
margins <strong>of</strong> the Labrador Sea – a review. In: Wilson, R.C.L. et<br />
al. (eds): Non-volcanic rifting <strong>of</strong> continental margins: a comparison<br />
<strong>of</strong> evidence from l<strong>and</strong> <strong>and</strong> sea. <strong>Geological</strong> Society Special Publications<br />
(London) 187, 79–107.<br />
Christiansen, F.G. 2011: Greenl<strong>and</strong> petroleum exploration: history,<br />
breakthroughs in underst<strong>and</strong>ing <strong>and</strong> future challenges. In: Spencer,<br />
A.M. et al. (eds): Arctic petroleum geology. <strong>Geological</strong> Society Memoirs<br />
(London) 35, 647–661.<br />
Japsen, P., Bonow, J.M., Peulvast, J.-P. &Wilson, R.W. 2006: Uplift, erosion<br />
<strong>and</strong> fault reactivation in Southwest Greenl<strong>and</strong>. Field report summer<br />
2006. Danmarks og Grønl<strong>and</strong>s Geologiske Undersøgelse Rapport<br />
2006/63, 77 pp.<br />
Konnerup-Madsen, J., Larsen, E. & Rose-Hansen, J. 1979: Hydrocarbonrich<br />
fluid inclusions in minerals from the alkaline Ilímaussaq intrusion,<br />
South Greenl<strong>and</strong>. <strong>Bulletin</strong> de Minéralogie 102, 642–653.<br />
Konnerup-Madsen J., Kreulen R. & Rose-Hansen J. 1988: Stable isotopic<br />
characteristics <strong>of</strong> hydrocarbon gases in the alkaline Ilímaussaq complex,<br />
South Greenl<strong>and</strong>. <strong>Bulletin</strong> de Minéralogie 111, 567–576.<br />
Laier, T. & Nyt<strong>of</strong>t, H.P. 2012: Bitumen biomarkers in the mid-Proterozoic<br />
Ilímaussaq intrusion, Southwest Greenl<strong>and</strong> – a challenge to the mantle<br />
gas theory. Marine <strong>and</strong> Petroleum Geology 30, 50–65.<br />
Nyt<strong>of</strong>t, H.P., Bojesen-Koefoed, J.A., Christiansen, F.G. & Fowler, M.G.<br />
2002: Oleanane or lupane? Reappraisal <strong>of</strong> the presence <strong>of</strong> oleanane in<br />
Cretaceous–Tertiary oils <strong>and</strong> sediments. Organic Geochemistry 33,<br />
1225–1240.<br />
Poulsen, V. 1964: The s<strong>and</strong>stones <strong>of</strong> the Precambrian Eriksfjord Formation in<br />
South Greenl<strong>and</strong>. Rapport Grønl<strong>and</strong>s Geologiske Undersøgelse 2, 16 pp.<br />
Petersilie, I.A. & Sørensen, H. 1970: Hydrocarbon gases <strong>and</strong> bituminous<br />
substances in rocks from the Ilímaussaq alkaline intrusion, South<br />
Greenl<strong>and</strong>. Lithos 3, 59–76.<br />
Rose-Hansen, J. & Sørensen, H. 2002: Geology <strong>of</strong> the lujavrites from the<br />
Ilímaussaq alkaline complex, South Greenl<strong>and</strong>, with information from<br />
seven bore holes. Meddelelser om Grønl<strong>and</strong>, Geoscience 40, 58 pp.<br />
Authors’ address<br />
<strong>Geological</strong> <strong>Survey</strong> <strong>of</strong> <strong>Denmark</strong> <strong>and</strong> Greenl<strong>and</strong>, Øster Voldgade 10, DK-1350 Copenhagen K, <strong>Denmark</strong>. E-mail: tl@geus.dk<br />
68
Methane <strong>and</strong> possible gas hydrates in the Disko Bugt<br />
region, central West Greenl<strong>and</strong><br />
Naja Mikkelsen, Troels Laier, Tove Nielsen, Antoon Kuijpers <strong>and</strong> Niels Nørgaard-Pedersen<br />
Current climate models predict an annual temperature increase<br />
in the Arctic between 4° <strong>and</strong> 6°C by the end <strong>of</strong> the<br />
21st century with widespread impact on the Arctic environment.<br />
Warming will lead to thawing <strong>of</strong> the widespread,<br />
permanently frozen, high-latitude peat-l<strong>and</strong>s <strong>and</strong> to degradation<br />
<strong>of</strong> marine gas hydrates, both <strong>of</strong> which may increase the<br />
rate <strong>of</strong> methane release to the atmosphere. This will influence<br />
global climate as methane is a potent greenhouse gas<br />
with a large global warming potential. Marine gas hydrates<br />
are found worldwide on continental margins <strong>and</strong> frequently<br />
occur in the Arctic. Interpretation <strong>of</strong> seismic pr<strong>of</strong>iles has also<br />
indicated their presence in the Disko Bugt region in western<br />
Greenl<strong>and</strong>.<br />
In June 2011 a scientific cruise was undertaken in the<br />
Disko Bugt region (Fig. 1) to investigate the occurrence <strong>of</strong><br />
methane <strong>and</strong> possible gas hydrates in the region. The cruise<br />
was part <strong>of</strong> a multidisciplinary scientific project Impact on<br />
permafrost, gas hydrates <strong>and</strong> periglacial processes following climate<br />
changes in Greenl<strong>and</strong> (Permagas). The project studies<br />
the impact <strong>of</strong> global climate warming on permafrost <strong>and</strong> gas<br />
hydrates in the Disko Bugt region. The aim <strong>of</strong> the project is<br />
to link marine <strong>and</strong> terrestrial occurrences <strong>of</strong> gas emissions.<br />
Marine gas hydrates<br />
Gas hydrate is a crystalline solid consisting <strong>of</strong> gas molecules,<br />
usually methane, with each gas molecule surrounded by a<br />
frame <strong>of</strong> water molecules. Marine gas hydrates form under<br />
high pressure <strong>and</strong> low temperature in sediments below the<br />
seabed (Fig. 2). Depending on the bottom water temperature<br />
methane hydrate is typically stable in sea-floor sediments on<br />
the continental slope, but in high-latitude regions with low<br />
bottom water temperatures, the top <strong>of</strong> the gas hydrate stability<br />
zone may occur at shallower depths.<br />
Gas hydrates are a potential energy resource as well as a<br />
potential risk for geohazards <strong>and</strong> the safe exploitation <strong>of</strong> sea<br />
bed resources (Kvenvolden & Rogers 2005). The worldwide<br />
amount <strong>of</strong> carbon bound in gas hydrates is conservatively<br />
estimated to total twice the amount <strong>of</strong> carbon found in all<br />
Disko<br />
D<br />
Vaigat<br />
Greenl<strong>and</strong><br />
200<br />
69°<br />
500<br />
200<br />
B<br />
200<br />
Aasiaat<br />
A<br />
Jakobshavn<br />
Isfjord<br />
Disko<br />
Bugt<br />
E<br />
Pressure (MPa)<br />
2<br />
4<br />
6<br />
Gas hydrate<br />
The general water depth in Disko Bugt<br />
is 200–400 m, corresponding to c. 2–4 MPa<br />
Methane + water<br />
68°30´N<br />
56°<br />
500<br />
C<br />
25 km<br />
54°W<br />
Fig. 1. Map <strong>of</strong> the Disko Bugt region. The black dots show core sites in<br />
Egedesminde Dyb (A, B), on the shelf <strong>of</strong>f Aasiaat (C), in southern Vaigat<br />
(D) <strong>and</strong> <strong>of</strong>f Jakobshavn Isfjord (E). Methane was encountered at sediment<br />
sites A <strong>and</strong> B, <strong>and</strong> traces <strong>of</strong> methane occurred at site C. At sites D <strong>and</strong><br />
E, where pockmarks have been mapped during previous surveys, evidence<br />
<strong>of</strong> upwelling freshwater was found. Contours: 100, 200 <strong>and</strong> 500 m. The<br />
red line that crosses the core location at site C shows the position <strong>of</strong> the<br />
seismic pr<strong>of</strong>ile in Fig. 3.<br />
8<br />
10<br />
0<br />
Site B<br />
Egedesminde Dyb<br />
5 10 15<br />
Temperature (°C)<br />
Fig. 2. Phase diagram showing the boundary between free methane (no<br />
colour) <strong>and</strong> gas hydrate (blue).<br />
© 2012 GEUS. <strong>Geological</strong> <strong>Survey</strong> <strong>of</strong> <strong>Denmark</strong> <strong>and</strong> Greenl<strong>and</strong> <strong>Bulletin</strong> <strong>26</strong>, 69–72. Open access: www.geus.dk/publications/bull<br />
69
Two-way travel time (sec)<br />
0.5<br />
1.0<br />
SW<br />
1 km<br />
NE<br />
Fig. 3. Reflection seismic pr<strong>of</strong>ile from site C<br />
(Fig. 1). The bottom-simulating reflector<br />
(yellow) at 75 msec two-way travel time below<br />
the seabed may indicate the occurrence <strong>of</strong> an<br />
up to 70 m thick gas hydrate zone. Pockmarks<br />
<strong>and</strong> seabed mounds (red) overlying faults in<br />
the shallow sub-seabed unit may be caused<br />
by seepage <strong>of</strong> free gas from beneath the gas<br />
hydrate zone. The seismic pr<strong>of</strong>ile is part <strong>of</strong> released<br />
data acquired for the company Nunaoil<br />
in 1998.<br />
known fossil fuels on Earth, <strong>and</strong> methane bound in hydrates<br />
amounts to approximately 3000 times the volume <strong>of</strong> methane<br />
in the atmosphere. In a warming world, methane from<br />
the dissociation <strong>of</strong> large <strong>and</strong> dynamic gas hydrate reservoirs<br />
therefore has the potential to influence oceanic <strong>and</strong> atmospheric<br />
carbon pools <strong>and</strong> thus influence global climate.<br />
Gas hydrate may be recognised on seismic pr<strong>of</strong>iles by<br />
the presence <strong>of</strong> a so-called bottom-simulating reflector that<br />
marks the base <strong>of</strong> the gas hydrate stability zone (MacKay et<br />
al. 1994). The reflector is caused by the impedance contrast<br />
between the solid gas hydrate layer <strong>and</strong> free gas accumulations<br />
beneath. However, bottom-simulating reflectors are<br />
also found in areas without gas hydrates.<br />
The Disko Bugt region<br />
Since the discovery <strong>of</strong> extensive oil seeps north <strong>of</strong> Disko in<br />
1992 (Christiansen et al. 1996), marine geologists’ interest<br />
in the Disko Bugt region has increased significantly. However,<br />
little is known about the possible existence <strong>of</strong> gas hydrates<br />
on the continental margin, <strong>of</strong>fshore West Greenl<strong>and</strong>.<br />
The presence <strong>of</strong> pockmarks in Disko Bugt (Weinrebe et al.<br />
2008) provides evidence <strong>of</strong> upwelling gas or fluid from the<br />
sea bottom. The bottom water temperature is c. 3°C in the<br />
Disko Bugt region <strong>and</strong> gas hydrates can be expected to occur<br />
at water depths exceeding 400 m, provided that methane<br />
occurs in high concentrations. During collection <strong>of</strong> a piston<br />
core in central Disko Bugt high gas content was demonstrated<br />
by the sudden escape <strong>of</strong> large amounts <strong>of</strong> strongly exp<strong>and</strong>ing<br />
gas that disrupted the sediment (Kuijpers et al. 2001). In<br />
addition, bottom-simulating reflectors have been observed<br />
on a number <strong>of</strong> seismic pr<strong>of</strong>iles from the area (Fig. 3).<br />
Material <strong>and</strong> methods<br />
During the cruise, up to 6 m long gravity cores <strong>and</strong> up to 2 m<br />
long cores, taken with a Max Planck Institute Rumohr Lot<br />
corer, were retrieved from five sites above <strong>and</strong> within the gas<br />
hydrate stability zone. The cores were sub-sampled for analysis<br />
<strong>of</strong> sediments <strong>and</strong> pore fluids (Fig. 4; Nielsen et al. 2011).<br />
The sediment cores were subjected to a number <strong>of</strong> geochemi-<br />
TIC (%) TS (%) TOC (%)<br />
0<br />
0 1 2 3<br />
Depth (cm below core top)<br />
300<br />
600<br />
Fig. 4. Plastic liners with 10 cm diameter cores sampled for pore water. The<br />
samples were analysed during the cruise for concentrations <strong>of</strong> methane,<br />
sulphate <strong>and</strong> dissolved sulphide. The Rhizon samplers were inserted into<br />
pre-drilled holes in the gravity core sections <strong>and</strong> pore water extracted by<br />
applying vacuum to the sampler when pulling the syringe piston.<br />
900<br />
Fig. 5. Total inorganic carbon (TIC), total sulphur (TS) <strong>and</strong> total organic<br />
carbon (TOC) in a sediment core from site B in Egedesminde Dyb (after<br />
Kuijpers et al. 2001).<br />
70
cal analyses, including measurements <strong>of</strong> methane concentrations<br />
<strong>and</strong> concentration <strong>of</strong> pore-water solutes (particularly<br />
sulphate), which aimed at providing data that could confirm<br />
the presence <strong>of</strong> gas hydrates.<br />
Geochemical results <strong>and</strong> discussion<br />
In the cores collected in Egedesminde Dyb at sites A <strong>and</strong> B<br />
(Fig. 1), which are situated within the gas hydrate stability<br />
zone, high pore-water methane concentrations were noted.<br />
However, the maximum methane concentration measured<br />
(c. 16 mM) is much below what is expected for methane<br />
saturation at 800 m depth in the Egedesminde Dyb (147<br />
mM; Yamamoto et al. 1976). This is probably due to partial<br />
degassing during core retrieval. A pressure core barrel was<br />
not available during the cruise <strong>and</strong> the large drop in pressure<br />
during retrieval <strong>of</strong> the sediment cores would inevitably lead<br />
to loss <strong>of</strong> methane. Therefore it was not possible to prove the<br />
existence <strong>of</strong> small amounts <strong>of</strong> methane hydrate that may have<br />
formed as a result <strong>of</strong> in situ methane supersaturation. We did<br />
not observe any diagnostic features <strong>of</strong> hydrates either, such<br />
as trends in the chloride concentration or soupy sediment<br />
textures.<br />
The methane is most likely microbial in origin <strong>and</strong><br />
formed in situ as a result <strong>of</strong> organic matter degradation below<br />
the sulphate zone c. 0.5 m below the sea floor. This assumption<br />
is supported by the high content <strong>of</strong> organic matter in the<br />
sediment (total organic carbon = 1.9–2.3%; Fig. 5). Methane<br />
production is also promoted by the relatively high sedimentation<br />
rate in the area, 0.4–0.5 cm/year at site B (Moros et al.<br />
CH 4 mM<br />
SO 4 mM<br />
Cl mM<br />
0 5 10 15 20<br />
0<br />
0 10 20 30<br />
440 480 520 560<br />
100<br />
200<br />
Sulphate-methane<br />
transition zone<br />
300<br />
Site A<br />
400<br />
500<br />
600<br />
0 5 10 15 20<br />
0<br />
0 10 20 30<br />
440 480 520 560<br />
100<br />
200<br />
Sulphate-methane<br />
transition zone<br />
300<br />
Site B<br />
400<br />
Depth (cm below core top)<br />
500<br />
600<br />
0 5 10 15 20<br />
0<br />
100<br />
200<br />
300<br />
0 10 20 30<br />
Site C<br />
440 480 520 560<br />
400<br />
500<br />
Fig. 6. Pore-water concentration pr<strong>of</strong>iles <strong>of</strong><br />
dissolved methane, sulphate <strong>and</strong> chloride from<br />
sediment cores retrieved from Egedesminde<br />
Dyb (sites A (842 m) <strong>and</strong> B (865 m)), <strong>of</strong>f Aasiaat<br />
(site C, 544 m) <strong>and</strong> from Vaigat (site D, 469 m).<br />
Yellow symbols: short Rumohr Lot cores, black<br />
symbols: gravity cores. Concentrations are in<br />
mM (millimoles per litre).<br />
600<br />
0 0.1 0.2<br />
0<br />
100<br />
200<br />
300<br />
400<br />
500<br />
600<br />
0 10 20 30<br />
Site D<br />
440 480 520 560<br />
Rumohr Lot core<br />
Gravity core<br />
71
2006) that allows for a high proportion <strong>of</strong> easily degradable<br />
organic matter to enter the zone <strong>of</strong> methanogenesis (Henrichs<br />
& Reeburgh 1987).<br />
At site C in the area west <strong>of</strong> Aasiaat the much lower methane<br />
concentration than at sites A <strong>and</strong> B may be explained<br />
by the high sulphate concentration (Figs 1, 6), which generally<br />
excludes the presence <strong>of</strong> methane (Iversen & Jørgensen<br />
1985). Still the concentration <strong>of</strong> methane is significantly<br />
above background values for other sulphate pore-water concentrations<br />
in the Disko Bugt region. This may suggest upward<br />
migration <strong>of</strong> methane from gas hydrates as indicated<br />
by seismic data from the area (Fig. 3). The slight decrease in<br />
pore-water chloride concentrations with depth (Fig. 6) may<br />
further sustain the assumption <strong>of</strong> an upward migration <strong>of</strong><br />
fluids depleted in chloride from below.<br />
Pore-water sulphate in sediment cores from site D located<br />
in the southern end <strong>of</strong> the strait Vaigat is almost exhausted at<br />
approximately 5 m below the sea floor (Figs 1, 6). However,<br />
the low sulphate concentration is presumably not entirely<br />
due to in situ microbial sulphate reduction, as the decrease<br />
in pore-water chloride concentration with depth indicates<br />
a considerable contribution <strong>of</strong> freshwater from submarine<br />
groundwater discharge (Fig. 6).<br />
Additional field work was conducted during the cruise in<br />
an area <strong>of</strong>f the mouth <strong>of</strong> Jakobshavn Isfjord (site E). Pockmarks<br />
observed during an earlier multibeam survey in that<br />
area (Weinrebe et al. 2008) were suspected to have formed<br />
due to upward gas migration (Hovl<strong>and</strong> & Svendsen 2006).<br />
However, the absence <strong>of</strong> methane together with the sediment<br />
texture observed in sediment cores from the area indicate<br />
that the pockmarks form from upwelling water <strong>and</strong> not<br />
from gas seepage.<br />
Concluding remarks<br />
The geochemical data obtained as a result <strong>of</strong> the 2011 cruise<br />
to the Disko Bugt region indicate that gas hydrates may occur<br />
in the region. Further investigation <strong>of</strong> the possible gas hydrates<br />
will continue during a new cruise in the area in 2012.<br />
Acknowledgements<br />
The 2011 cruise was supported by a grant from Geocenter <strong>Denmark</strong> to<br />
the project Permagas. The success <strong>of</strong> the cruise depended very much on<br />
the operational skills <strong>of</strong> the captain <strong>and</strong> crew <strong>of</strong> the R/V Paamiut <strong>and</strong><br />
the smooth co-operation during the cruise with a scientific team from the<br />
Greenl<strong>and</strong> Institute <strong>of</strong> Natural Resources.<br />
References<br />
Christiansen, F. G., Bate, K.J., Dam, G., Marcussen, C. & Pulvertaft,<br />
T.C.R. 1996: Continued geophysical <strong>and</strong> petroleum geological activities<br />
in West Greenl<strong>and</strong> in 1995 <strong>and</strong> the start <strong>of</strong> onshore exploration.<br />
<strong>Bulletin</strong> Grønl<strong>and</strong>s Geologiske Undersøgelse 172, 15–21.<br />
Henrichs, S.M. & Reeburgh, W.S. 1987: Anaerobic mineralization <strong>of</strong> marine<br />
sediments organic matter: rates <strong>and</strong> role <strong>of</strong> anaerobic processes in<br />
the oceanic carbon economy. Geomicrobiology Journal 5, 191–237.<br />
Hovl<strong>and</strong>, M. & Svendsen, H. 2006: Submarine pingoes: indicators <strong>of</strong><br />
shallow gas hydrates in a pockmark at Nyegga, Norwegian Sea. Marine<br />
Geology 228, 15–23.<br />
Iversen, N. & Jørgensen, B.B. 1985: Anaerobic methane oxidation rates<br />
at the sulphate–methane transition in marine sediments from Kattegat<br />
<strong>and</strong> Skagerrak (<strong>Denmark</strong>). Limnology Oceanography 30, 944–955.<br />
Kvenvolden K.A. & Rogers B.W. 2005: Gaia’s breath – global methane<br />
exhalations. Marine <strong>and</strong> Petroleum Geology 22, 579–590.<br />
Kuijpers, A., Lloyd, J.M., Jensen, J.B., Endler, R., Moros, M., Park, L.A.,<br />
Schulz, B., Jensen, K.G. & Laier, T. 2001: Late Quaternary circulation<br />
changes <strong>and</strong> sedimentation in Disko Bugt <strong>and</strong> adjacent fjords, central<br />
West Greenl<strong>and</strong>. Geology <strong>of</strong> Greenl<strong>and</strong> <strong>Survey</strong> <strong>Bulletin</strong> 189, 41–47.<br />
MacKay, M.E., Jarrard, R.D., Westbrook, G.K. & Hyndman, R.D. 1994:<br />
Origin <strong>of</strong> bottom-simulating reflectors: geophysical evidence from the<br />
Cascadia accretionary prism. Geology 22, 459–462, http://dx.doi.<br />
org/10.1130/0091-7613(1994)022%3C0459:OOBSRG%3E2.3.CO;2<br />
Moros, M., Jensen, K.G. & Kuijpers, A. 2006: Mid- to late-Holocene hydrological<br />
<strong>and</strong> climatic variability in Disko Bugt, Central West Greenl<strong>and</strong>.<br />
The Holocene 16, 357–367.<br />
Nielsen, T., Laier, T., Mikkelsen, N. & Kristensen, J.B. 2011: Permagas<br />
project: Sampling gas hydrates in the Disko Bay area. Cruise Report –<br />
R/V Paamiut 20 to <strong>26</strong> June 2011. Danmarks og Grønl<strong>and</strong>s Geologiske<br />
Undersøgelser Rapport 2011/105, 40 pp.<br />
Weinrebe, W., Kuijpers, A., Klaucke, I., Fink, M., Jensen, J.B. & Mikkelsen,<br />
N. 2008: High-resolution bathymetry <strong>of</strong> Disko Bay <strong>and</strong> Ilulissat<br />
Icefjord, West Greenl<strong>and</strong>. American Geophysical Union fall meeting,<br />
San Fransisco, California, 15–19 December 2008 (Abstract C31E-<br />
0563).<br />
Yamamoto, S., Alcauskas, J.B. & Crozier, T.E. 1976: Solubility <strong>of</strong> methane<br />
in distilled water <strong>and</strong> seawater. Journal <strong>of</strong> Chemical <strong>and</strong> Engineering<br />
Data 21, 78–80.<br />
Authors’ address<br />
<strong>Geological</strong> <strong>Survey</strong> <strong>of</strong> <strong>Denmark</strong> <strong>and</strong> Greenl<strong>and</strong>, Øster Voldgade 10, DK-1350 Copenhagen K, <strong>Denmark</strong>. E-mail: nm@geus.dk<br />
72
Ablation observations for 2008–2011 from the<br />
Programme for Monitoring <strong>of</strong> the Greenl<strong>and</strong> Ice Sheet<br />
(PROMICE)<br />
Robert S. Fausto, Dirk van As <strong>and</strong> the PROMICE project team*<br />
Recent estimates from the glaciological community agree<br />
that the Greenl<strong>and</strong> ice sheet is losing mass at an accelerated<br />
pace due to climate change (Velicogna 2009; Khan et al.<br />
2010; Rignot et al. 2011). This has caught the attention <strong>of</strong><br />
the public <strong>and</strong> policy makers due to the potential impact on<br />
sea-level rise (Dahl-Jensen et al. 2009). The mass loss can be<br />
attributed approximately equally to increases in meltwater<br />
run<strong>of</strong>f from surface melt <strong>and</strong> iceberg production (van den<br />
Broeke et al. 2009).<br />
The robustness <strong>of</strong> mass-balance predictions relies heavily<br />
on observational data from the Greenl<strong>and</strong> ice sheet <strong>and</strong> in<br />
recent years the need for frequent, reliable surface mass-balance<br />
measurements has increased (IPCC 2007; Dahl-Jensen<br />
et al. 2009). In anticipation <strong>of</strong> this need, the Programme for<br />
Monitoring <strong>of</strong> the Greenl<strong>and</strong> Ice Sheet (PROMICE) was<br />
initiated in 2007, delivering in situ data from a network <strong>of</strong><br />
automatic weather stations (AWS) covering eight different<br />
regions <strong>of</strong> the ice sheet (Fig. 1; van As et al. 2011). Apart from<br />
the direct insight into the surface mass balance provided by<br />
these stations, the in situ data are also valuable for calibrating<br />
<strong>and</strong> validating melt estimates from remote sensors <strong>and</strong> surface<br />
mass-balance models (Dahl-Jensen et al. 2009). In this<br />
paper, we present the ablation records for the PROMICE<br />
AWSs for 2008–2011, <strong>and</strong> the impact <strong>of</strong> the extraordinary<br />
atmospheric conditions on ablation in 2010 (Tedesco et al.<br />
2011) are compared to the other years.<br />
80°N<br />
75°N<br />
70°N<br />
65°N<br />
60°N<br />
80°W 60°W 40°W<br />
THU<br />
1500<br />
UPE<br />
1250<br />
1000<br />
1500<br />
1750<br />
2000<br />
2250<br />
KAN<br />
1750<br />
2250<br />
NUK<br />
2750<br />
2500<br />
QAS<br />
2000<br />
2250<br />
3000<br />
20°W 0°W<br />
50°W 40°W 20°W<br />
2750<br />
2500<br />
Greenl<strong>and</strong><br />
TAS<br />
KPC<br />
SCO<br />
500 km<br />
PROMICE automatic weather stations<br />
Fig. 1. Map <strong>of</strong> Greenl<strong>and</strong> showing the locations <strong>of</strong> the PROMICE automatic<br />
weather stations. Each dot represents two or three stations. Station<br />
names are found in Table 1. Dashed lines: elevation contours.<br />
The PROMICE network in Greenl<strong>and</strong> currently consists <strong>of</strong><br />
eight sites with two (or three) AWSs placed at different elevations<br />
(Fig. 1; Table 1; Ahlstrøm et al. 2008) with a total <strong>of</strong> 18<br />
stations. At each site, one station is typically located in the<br />
lower ablation zone close to the margin <strong>and</strong> the other in the<br />
upper ablation zone. Exceptions are station KAN_U, which<br />
is placed in the lower part <strong>of</strong> the accumulation zone, <strong>and</strong> station<br />
TAS_U, which is placed well below the equilibrium-line<br />
altitude for reasons <strong>of</strong> accessibility. Each station measures all<br />
relevant meteorological parameters <strong>and</strong> ice <strong>and</strong> snow ablation<br />
(Fig. 2). It measures <strong>and</strong> stores data every ten minutes<br />
* Andreas P. Ahlstrøm, Signe B. Andersen, Morten L. Andersen, Michele Citterio, Karen Edelvang, Signe H. Larsen, Horst Machguth,<br />
Søren Nielsen <strong>and</strong> Anker Weidick.<br />
© 2012 GEUS. <strong>Geological</strong> <strong>Survey</strong> <strong>of</strong> <strong>Denmark</strong> <strong>and</strong> Greenl<strong>and</strong> <strong>Bulletin</strong> <strong>26</strong>, 73–76. Open access: www.geus.dk/publications/bull<br />
73
Table 1. PROMICE automatic<br />
weather station metadata (status 2011)<br />
Station Latitude Longitude Elevation Start date<br />
name (°N) (°W) (m a.s.l.)<br />
KPC_L* 79°55´ 24°05´ 380 17 July 2008<br />
KPC_U 79°50´ 25°10´ 870 17 July 2008<br />
SCO_L 72°14´ <strong>26</strong>°49´ 470 21 July 2008<br />
SCO_U 72°24´ 27°15´ 1000 21 July 2008<br />
TAS_L 65°38´ 38°54´ 270 23 August 2007<br />
TAS_U 65°42´ 38°52´ 580 15 August 2007<br />
QAS_L 61°02´ 46°51´ 310 24 August 2007<br />
QAS_U 61°11´ 46°49´ 890 7 August 2008<br />
NUK_L 64°29´ 49°32´ 560 20 August 2007<br />
NUK_U 64°30´ 49°16´ 1140 20 August 2007<br />
NUK_N 64°57´ 49°53´ 930 <strong>26</strong> July 2010<br />
KAN_L 67°60´ 50°70´ 670 1 September 2008<br />
KAN_M 67°40´ 48°49´ 1280 1 September 2008<br />
KAN_U 67°00´ 47°10´ 1830 4 April 2009<br />
UPE_L 72°54´ 54°18´ 230 17 August 2009<br />
UPE_U 72°53´ 53°32´ 980 17 August 2009<br />
THU_L 76°24´ 68°16´ 570 9 August 2010<br />
THU_U 76°25´ 68°09´ 770 9 August 2010<br />
*L: Lower station, M: Middle station, U: Upper station, N: New station.<br />
with the exception <strong>of</strong> the wind-speed observations that<br />
give the mean wind speed since the last measurement cycle,<br />
<strong>and</strong> the GPS measurements, which follow the transmission<br />
schedule. During winter (day 301 to day 99 <strong>of</strong> the year) the<br />
acquired data are transmitted once a day at midnight to limit<br />
power consumption when solar power is not available. During<br />
summer (day 100 to day 300) the data are transmitted<br />
hourly. The transmissions consist <strong>of</strong> daily or hourly average<br />
values <strong>of</strong> the more variable quantities such as temperature or<br />
radiation. Values <strong>of</strong> less variable quantities, such as surface<br />
height <strong>and</strong> station tilt are appended once every six hours in<br />
summer <strong>and</strong> once a day in winter for all daily transmissions.<br />
Instrumentation <strong>and</strong> accuracy<br />
The PROMICE AWSs are equipped with an Ørum & Jensen<br />
NT1400 pressure transducer assembly <strong>and</strong> two Campbell<br />
Scientific SR50A sonic rangers that monitor surface-height<br />
change caused by accumulation <strong>and</strong> ablation. The pressure<br />
transducer assembly consists <strong>of</strong> a (non-freezing) liquid-filled<br />
hose with a pressure transducer located at its end/bottom.<br />
The hose is drilled into the ice. The pressure signal registered<br />
by the transducer is that <strong>of</strong> the vertical liquid column over<br />
the sensor, which can be scaled to depth using the density<br />
<strong>of</strong> the liquid. The free-st<strong>and</strong>ing AWS tripod (Fig. 2) moves<br />
down with the ablating surface <strong>and</strong> the hose melts out <strong>of</strong> the<br />
ice, reducing the hydrostatic pressure from the vertical liquid<br />
column in the hose. The reduction in pressure provides the<br />
ablation totals. The assembly was first constructed <strong>and</strong> implemented<br />
by Bøggild et al. (2004). Since the first successful<br />
5<br />
1<br />
10<br />
2<br />
8<br />
Fig. 2. The PROMICE automatic weather station UPE_L photographed<br />
on 17 August 2009. 1: radiometer. 2: inclinometer. 3: satellite antenna. 4:<br />
anemometer. 5: sonic rangers. 6: thermometer <strong>and</strong> hygrometer. 7: pressure<br />
transducer. 8: solar panel. 9: data logger, barometer <strong>and</strong> GPS. 10: battery<br />
box with 4 × 28 Ah batteries. 11: 8-level thermistor string.<br />
tests in 2001, we have developed the system <strong>and</strong> now use a<br />
larger diameter hose <strong>and</strong> have changed from relative to absolute<br />
pressure transducers. We also use an ethylene-glycol<br />
solution, instead <strong>of</strong> alcohol <strong>and</strong> secure the upper reference<br />
level <strong>of</strong> the assembly (in the form <strong>of</strong> a bladder) to the mast<br />
instead <strong>of</strong> leaving it exposed on the ice surface.<br />
By measuring on a (sub-)daily timescale, the pressure<br />
transducer assembly is well suited to monitor ice ablation in<br />
remote regions, with clear advantages over other well-established<br />
methods. For instance, the stake readings providing<br />
information about surface-height change are done at every<br />
maintenance visit, so the records are limited to the visits. The<br />
accuracy <strong>of</strong> the SR50A sonic ranger is given by the manufacturer<br />
(Campbell Scientific) to be ±1 cm or ±0.4% <strong>of</strong> the<br />
measuring height after temperature correction. This was<br />
confirmed over 2.3 months <strong>of</strong> a virtually accumulation-free<br />
wintertime period at SCO_U, during which time st<strong>and</strong>ard<br />
deviations <strong>of</strong> 1.7 cm <strong>and</strong> 0.6 cm were found (after spike<br />
removal), corresponding to 0.7% <strong>and</strong> 0.6% <strong>of</strong> the distance<br />
measured by the two sonic rangers, respectively. However,<br />
the precision <strong>of</strong> the readings from these sensors may reduce<br />
over time as the sensors degrade due to continuous cycles <strong>of</strong><br />
moisture freezing on <strong>and</strong> melting <strong>of</strong>f them. A major problem<br />
with sonic rangers in surface-mass balance studies is that<br />
they need to be mounted on the stake assemblies drilled into<br />
3<br />
7<br />
9<br />
6<br />
5<br />
4<br />
11<br />
7<br />
74
the ice. During a single melt season, these stake assemblies<br />
can melt out several metres, <strong>of</strong>ten causing them to move or<br />
even collapse during strong winds. In comparison, the pressure<br />
transducer assembly is operational until it has melted<br />
out <strong>of</strong> the ice, which can take several years depending on drill<br />
depth <strong>and</strong> the local ablation rate. This reduces the need for<br />
annual station visits, <strong>and</strong> thereby the considerable expenses<br />
associated with logistics in Greenl<strong>and</strong>. The measurement<br />
uncertainty <strong>of</strong> the pressure transducer sensor given by the<br />
manufacturer is 2.5 cm. The mean st<strong>and</strong>ard deviation <strong>of</strong> the<br />
UPE <strong>and</strong> SCO pressure transducer readings outside the ablation<br />
season is found to be ±1 cm, indicating a small r<strong>and</strong>om<br />
error comparable to that <strong>of</strong> the sonic ranger. The precision <strong>of</strong><br />
the pressure transducer readings falls over time as the transducer<br />
degrades due to the continuous pressure on the sensor.<br />
Sensitivity drift defines the amount by which an instrument’s<br />
sensitivity varies as ambient conditions change. Calibration<br />
tests <strong>of</strong> the pressure transducer show that the sensor<br />
sensitivity drift amounts to 1.6% on average for a four-year<br />
measuring period (0.4% per year), suggesting that drift is not<br />
a large source <strong>of</strong> error. The pressure transducer is especially<br />
suitable for high ablation areas <strong>of</strong> >3 m per year because it is<br />
independent <strong>of</strong> the stakes drilled into the ice (Fig. 2).<br />
Ablation records for 2008–2011<br />
Table 2. Yearly ablation totals, given as the difference between<br />
the surface height at end <strong>of</strong> the melt season <strong>and</strong> that <strong>of</strong> the<br />
previous years, in metres snow/ice equivalent per year<br />
Station\year 2008 2009 2010 2011<br />
KPC_L –* – † – † – †<br />
KPC_U –* –0.1 ‡ 0.1 ‡ 0.2 ‡<br />
SCO_L –* 2.6 3.5 3.1<br />
SCO_U –* 1.4 2.5 2.1<br />
TAS_L 3.6 7.4 ** 3.4 ‡<br />
TAS_U 3.3 1.5 ‡ 3.9 $ 2.9<br />
QAS_L 7.3 – 9.3 5.5<br />
QAS_U –* –0.3 ‡ 3.4 0.8<br />
NUK_L 5.3 4.8 7.2 –<br />
NUK_U 2.2 1.5 2.5 2.3<br />
NUK_N – – –* 5.1<br />
KAN_L –* 3.5 5.4 4.0<br />
KAN_M –* 0.3 ‡ 2.6 ‡ 1.7 ‡<br />
KAN_U – –* – –0.2 ‡<br />
UPE_L – –* 3.2 2.9<br />
UPE_U – –* 2.7 2.6<br />
THU_L – – –* † – †<br />
THU_U – – –* † – †<br />
* Partial data coverage due to station establishment that year. † Data<br />
may become available after the next maintenance visit. ‡ Sonic ranger<br />
measurement. $ Sonic ranger <strong>and</strong> stake measurements. ** Sonic ranger<br />
<strong>and</strong> stake measurements for both 2009 <strong>and</strong> 2010.<br />
The PROMICE ablation records presented in Table 2 are<br />
based on measurements by sonic rangers <strong>and</strong> pressure transducers,<br />
supplemented by stake readings. The net ablation<br />
values are calculated as the height difference between the<br />
end-<strong>of</strong>-melt-season surface level in the given year <strong>and</strong> the<br />
year before. The geographical distribution <strong>and</strong> annual net<br />
ablation records in Table 2 show that for all station pairs, the<br />
lower stations measure larger ablation totals than the upper<br />
ones, because the temperature decreases with elevation <strong>and</strong><br />
the seasonal averaged surface albedo decreases towards the<br />
ice margin. There are considerable latitudinal differences as<br />
well, as the Greenl<strong>and</strong> ice sheet is more than 2000 km long.<br />
Ablation totals in the southern part <strong>of</strong> Greenl<strong>and</strong> typically<br />
amount to 3–7 m (at the lower TAS, QAS <strong>and</strong> NUK stations),<br />
whereas ablation totals at the more northerly SCO_L<br />
<strong>and</strong> UPE_L stations only amount to 2–3 m at low altitudes<br />
(500 m a.s.l.) typically<br />
amount to –0.3 to 4 m in the south (TAS, QAS, NUK,<br />
KAN) <strong>and</strong> –0.1 to 3 m in the north (KPC, SCO, UPE).<br />
The record-warm year 2010 (in most regions <strong>of</strong> Greenl<strong>and</strong>)<br />
showed the largest ablation at most AWS sites, followed<br />
by 2008, 2011, <strong>and</strong> lastly 2009 in the four-year PROMICE<br />
record. The 2010 ablation year was characterised by relatively<br />
low winter accumulation <strong>and</strong> a long period <strong>of</strong> positive air<br />
temperatures, which are both important for net ablation (Tedesco<br />
et al. 2011; van As et al. 2012). However, as the energy<br />
from solar radiation is the main contributor to the melting <strong>of</strong><br />
snow <strong>and</strong> ice, the direct impact on ablation <strong>of</strong> inter-annual<br />
variability <strong>of</strong> temperature may be small. It was the combination<br />
<strong>of</strong> low winter accumulation <strong>and</strong> high temperatures,<br />
causing low albedo in large sections <strong>of</strong> the Greenl<strong>and</strong> ice<br />
sheet in 2010, that resulted in large net ablation records (Tedesco<br />
et al. 2011; van As et al. 2012). The southern (QAS)<br />
<strong>and</strong> south-western (NUK <strong>and</strong> KAN) parts <strong>of</strong> Greenl<strong>and</strong><br />
experienced a particularly anomalous ablation season, with<br />
ablation totals <strong>of</strong> up to 3 m more than in other years. Even<br />
more significant was the melt response at stations close to<br />
the equilibrium-line altitude (zero net ablation) in the south<br />
<strong>and</strong> west; QAS_U went from a 0.3 m surface rise in 2009<br />
to a 3.4 m surface lowering in 2010, <strong>and</strong> at KAN_M ablation<br />
increased from 0.3 m to 2.6 m during the same years.<br />
Even in normal years, the KAN_U station, which is placed<br />
in the accumulation zone, showed a surface lowering due to<br />
melt over the year 2010. On the other h<strong>and</strong>, the northern<br />
KPC_U station did not show anomalous ablation, as temperatures<br />
did not exceed their normal summer values (Table<br />
2). North-East Greenl<strong>and</strong> did not experience the anomalous<br />
circulation pattern that, in particular, southern <strong>and</strong> western<br />
Greenl<strong>and</strong> experienced (Tedesco et al. 2011). Fifteen out <strong>of</strong><br />
18 PROMICE stations were successful in obtaining ablation<br />
75
totals up until 2011. The remaining three stations (KPC_L,<br />
THU_L, <strong>and</strong> THU_U) did not transmit any data, but data<br />
may become available during the next maintenance visit. We<br />
obtained 42 interannual ablation totals for all the stations<br />
out <strong>of</strong> 50 possible totals. When disregarding the three stations<br />
that did not transmit, the number would be 45. This<br />
gives a success rate <strong>of</strong> 84% for all 18 stations, or 93% when<br />
disregarding the 3 non-transmitting stations.<br />
Conclusions<br />
Ablation totals at low altitudes (
Testing <strong>of</strong> an automatic earthquake detection method<br />
on data from Station Nord, Greenl<strong>and</strong><br />
Nasim Karamzadeh, Peter H. Voss <strong>and</strong> Gholam D. Javan<br />
Earthquakes are continuously monitored by a global network<br />
<strong>of</strong> several thous<strong>and</strong> seismic stations equipped with<br />
highly sensitive digital seismometers. The <strong>Geological</strong> <strong>Survey</strong><br />
<strong>of</strong> <strong>Denmark</strong> <strong>and</strong> Greenl<strong>and</strong> (GEUS) takes part in it by operating<br />
five seismic stations in <strong>Denmark</strong> <strong>and</strong> 18 in Greenl<strong>and</strong>,<br />
some <strong>of</strong> the latter in collaboration with international partners.<br />
There are two main ways <strong>of</strong> detecting earthquakes from<br />
digital recordings <strong>of</strong> seismometers: (1) by a manual review <strong>of</strong><br />
the data by an expert in processing seismic earthquake signals<br />
<strong>and</strong> (2) by an automatic method that uses a computerised<br />
algorithm to analyse the recordings.<br />
Since the beginning <strong>of</strong> earthquake recording, earthquake<br />
detection at GEUS has been based on the manual review<br />
method. There are several reasons why an automatic detection<br />
procedure has not yet been implemented at GEUS: (1)<br />
historically, the staff at GEUS have conducted high-quality<br />
manual detection <strong>of</strong> earthquakes, based on a long tradition<br />
<strong>of</strong> manual seismogram analysis (Lehmann 1954), (2) the<br />
ambient noise level in <strong>Denmark</strong> is generally too high for<br />
small local earthquakes to be detected automatically <strong>and</strong> (3)<br />
in Greenl<strong>and</strong>, the distance between the seismometers is too<br />
long for automatic methods. Previous tests on GEUS data<br />
showed that automatic detection using the so-called st<strong>and</strong>ard<br />
method resulted in a very high number <strong>of</strong> false detections,<br />
<strong>and</strong> the effort needed to distinguish real earthquake signals<br />
from noise signals was much greater than that needed in the<br />
manual method. In addition, the automatic method detected<br />
fewer earthquakes than the manual analysis. Therefore, new<br />
automatic methods are needed to extract real earthquake signals<br />
from the background noise.<br />
In this article, we present results from testing a newly<br />
developed automatic detection method based on analysis<br />
<strong>of</strong> the frequency content <strong>of</strong> seismic signals. The aim <strong>of</strong> the<br />
study was to investigate whether the automated method can<br />
be used in Greenl<strong>and</strong> or whether the manual procedure is<br />
still superior. The new method was tested on seismic data<br />
from Station Nord, which was selected because it is located<br />
in a region with many earthquakes, <strong>and</strong> because there are no<br />
nearby seismograph stations to support the measurements.<br />
The closest station is located at Danmarkshavn c. 540 km to<br />
the south. Therefore, the majority <strong>of</strong> earthquakes that occur<br />
in this region are only registered at Station Nord.<br />
Earthquakes in the Station Nord region<br />
Station Nord is located in eastern North Greenl<strong>and</strong>, in a<br />
region where a major tectonic factor is the spreading that<br />
occurs along the rift zones in the northern North Atlantic<br />
<strong>and</strong> the Arctic Ocean (Døssing et al. 2010), <strong>and</strong> which gives<br />
rise to high seismic activity (Fig. 1). Another tectonic factor<br />
is postglacial isostatic rebound that was the source <strong>of</strong> three<br />
major earthquakes in 1971, 1987 <strong>and</strong> 1993 (Chung 2002),<br />
with magnitudes <strong>of</strong> 5.1, 5.5 <strong>and</strong> 5.4 on the Richter scale.<br />
Apart from the seismicity observed at the rift zone, most <strong>of</strong><br />
the earthquakes in the region occur to the south <strong>and</strong> west <strong>of</strong><br />
Station Nord (Fig. 1; Gregersen 1982). The earthquake hazard<br />
in the region is low, but represents the highest in Greenl<strong>and</strong><br />
(Voss et al. 2007). The hazard was illustrated by a strong<br />
tremor felt at Station Nord on 30 August 2005, caused by a<br />
magnitude 4.2 earthquake with an epicentre only 20 km away.<br />
Automatic earthquake detection<br />
The st<strong>and</strong>ard automatic earthquake detection method is<br />
known as the Short Term Average versus Long Term Average<br />
(STA/LTA) method (Havskov & Alguacil 2010). The<br />
basis <strong>of</strong> this method is two running time windows that both<br />
compute the average amplitude <strong>of</strong> the signal, one with a short<br />
84°N<br />
40°W 24°W 8°W 8°E<br />
Station<br />
Arctic Ocean<br />
Nord<br />
Magnitude<br />
(Richter scale)<br />
80°N 3<br />
2<br />
Rift zone<br />
1<br />
200 km<br />
Atlantic Ocean<br />
40°W 16°W 8°W<br />
Fig. 1. Map <strong>of</strong> the region between north-eastern Greenl<strong>and</strong> <strong>and</strong> Svalbard.<br />
Red dots: Epicentres located by GEUS using manual detection methods.<br />
Blue dots: Epicentres located using automatic detection method. Green<br />
dots: Located by both methods.<br />
0°<br />
© 2012 GEUS. <strong>Geological</strong> <strong>Survey</strong> <strong>of</strong> <strong>Denmark</strong> <strong>and</strong> Greenl<strong>and</strong> <strong>Bulletin</strong> <strong>26</strong>, 77–80. Open access: www.geus.dk/publications/bull<br />
77
Amp. (counts)<br />
Frequency (Hz)<br />
90<br />
50<br />
0<br />
0<br />
–50<br />
–100<br />
16<br />
14<br />
12<br />
10<br />
8<br />
6<br />
4<br />
2<br />
0<br />
Vertical component<br />
100 200 300 400 500 600 700 800 900 1000 1100 1200 1300 1400 1500 1600<br />
Time (sec.)<br />
0 100 200 300 400 500 600 700 800 900 1000 1100 1200 1300 1400 1500 1600<br />
Time (sec.)<br />
F = 16 Hz<br />
F = 14 Hz<br />
F = 12 Hz<br />
100<br />
50<br />
0<br />
100<br />
0<br />
100<br />
0<br />
F = 10 Hz 200<br />
F = 8 Hz<br />
F = 6 Hz<br />
F = 4 Hz<br />
F = 2 Hz<br />
0<br />
250<br />
0<br />
500<br />
0<br />
500<br />
0<br />
500<br />
0<br />
0 200 400 600 800 1000 1200 1400 1600<br />
Time (sec.)<br />
A<br />
B<br />
C<br />
60<br />
50<br />
40<br />
30<br />
20<br />
10<br />
Fig. 2. A: Vertical component <strong>of</strong> a continuous<br />
seismogram, which included a signal from an<br />
earthquake <strong>and</strong> several short-duration, high-energy<br />
perturbations. B: Normalised spectrogram<br />
produced by short-time Fourier transformation<br />
for frequencies <strong>of</strong> 2–16 Hz with 2 Hz steps. The<br />
colours (scaled to use full colour spectrum) represent<br />
an estimate <strong>of</strong> the energy contained at the<br />
given frequency, within a short window (about<br />
0.6 s). At 800–900 s, when an earthquake signal<br />
appears in the seismogram, the colours on the<br />
spectrogram change, which indicates an order <strong>of</strong><br />
magnitude increase in the seismic energy over all<br />
frequencies. The detection <strong>of</strong> changes in energy<br />
over a proper range <strong>of</strong> frequencies, corresponding<br />
to the frequency content <strong>of</strong> the earthquake<br />
signals, led to the detection <strong>of</strong> an earthquake.<br />
Other increases in the energy level are seen at<br />
several other times, for example at 600–700 s.<br />
These peaks are only seen at low frequencies. C:<br />
Another representation <strong>of</strong> the same spectrogram<br />
showing the variation <strong>of</strong> local spectral energy<br />
for each frequency b<strong>and</strong> over time. A sharp<br />
increase is seen at the onset <strong>of</strong> the earthquake<br />
signal, whereas the perturbation <strong>of</strong> energy in<br />
the background noise has disappeared at higher<br />
frequency b<strong>and</strong>s.<br />
duration (STA) <strong>and</strong> the other with a long duration (LTA).<br />
The LTA represents the stable background noise level <strong>of</strong> the<br />
seismic signal, whereas the STA will increase rapidly at the<br />
onset <strong>of</strong> a seismic signal. The signal is <strong>of</strong>ten b<strong>and</strong> pass filtered<br />
to lower the ambient noise. The earthquake is detected when<br />
the STA/LTA exceeds a predefined threshold level (e.g. 10).<br />
The basic parameters required for this method are (1) the<br />
b<strong>and</strong> pass filter, (2) the duration <strong>of</strong> STA <strong>and</strong> LTA <strong>and</strong> (3) the<br />
STA/LTA threshold level. The disadvantage <strong>of</strong> this method<br />
is that it triggers with all ground shaking that exceeds the<br />
threshold level. So, if the STA/LTA threshold level is set low<br />
to detect small earthquakes, many detections that are nothing<br />
but noise or bogus events lead to much additional manual<br />
post-processing. A high number <strong>of</strong> noise detections can be<br />
avoided by setting the STA/LTA at a higher threshold level,<br />
but then important earthquakes may not be detected.<br />
In many seismic networks, automatic detection is operated<br />
with a low STA/LTA threshold level, but to avoid a lot<br />
<strong>of</strong> manual post-processing <strong>of</strong> detected signals, an additional<br />
criterion is applied before they are forwarded to manual processing.<br />
It states that the detection is only valid if the signal<br />
is also detected by a number <strong>of</strong> other seismic stations (e.g. 3)<br />
within a predefined time window; otherwise the detection is<br />
disregarded as being seismic noise. However, in order to use<br />
this criterion in the detection <strong>of</strong> small earthquakes, the network<br />
must include a large number <strong>of</strong> seismic stations located<br />
less than 100 km from each other. This is not the case in<br />
Greenl<strong>and</strong> where the distance between the stations is around<br />
300 km in western Greenl<strong>and</strong> <strong>and</strong> around 600 km in eastern<br />
Greenl<strong>and</strong>. Alternative methods are therefore required, <strong>and</strong><br />
we have chosen an automatic method based on analysis <strong>of</strong><br />
the short-time Fourier transform <strong>of</strong> the data. In addition to<br />
event detection, the automatic method also provides phase<br />
picks, magnitude measurements <strong>and</strong> azimuth estimates, but<br />
the primary aim <strong>of</strong> this study was to test the performance <strong>of</strong><br />
the automatic event detections.<br />
78
A spectrogram produced by short-time Fourier transform<br />
is a very useful tool in seismology because it can provide an<br />
image indicating the time at which a burst <strong>of</strong> energy occurs<br />
on a seismogram, in addition to the spectral composition <strong>of</strong><br />
the signal (Gibbons et al. 2008). The event detection algorithm<br />
used in this study inspects the temporal variation <strong>of</strong><br />
the signal spectrogram calculated in frequency b<strong>and</strong>s corresponding<br />
to the frequency content <strong>of</strong> local <strong>and</strong> regional<br />
earthquakes (e.g. 2–16 Hz). For detected events, the P- <strong>and</strong><br />
S-phases are picked. An example <strong>of</strong> a recorded seismogram<br />
with an earthquake signal <strong>and</strong> corresponding spectrogram<br />
is shown in Fig. 2 where an earthquake is observed on a seismogram<br />
at an approximate time <strong>of</strong> 800 s. Obvious changes<br />
in the colour <strong>of</strong> the spectrogram take place over a wide range<br />
<strong>of</strong> frequencies along the time axis, which indicate the arrivals<br />
<strong>of</strong> earthquake energy (Fig. 2B). Accordingly, the detection<br />
<strong>of</strong> a change in energy pattern over a pre-defined range <strong>of</strong><br />
frequencies, corresponding to the frequency content <strong>of</strong> the<br />
earthquake signals, leads to the detection <strong>of</strong> an earthquake.<br />
The plots presented in Fig. 2C show the variation <strong>of</strong> energy<br />
for each frequency b<strong>and</strong>, corresponding to the above spectrogram.<br />
These plots provide another representation <strong>of</strong> the<br />
spectrogram. The problem <strong>of</strong> detecting an earthquake on<br />
seismograms is now reduced to detecting sharp increases in<br />
the individual time series representing spectral energy versus<br />
time (the plot shown in Fig. 2C). To avoid false detections<br />
due to seismic noise with a frequency content overlapping<br />
the analysed frequencies, only detections made in most <strong>of</strong><br />
the frequency b<strong>and</strong>s are accepted. For instance, detections<br />
should be made at about the same time in at least five out <strong>of</strong><br />
eight frequency sub-b<strong>and</strong>s for a given spectrogram (Fig. 2B).<br />
Three missing detections are allowed, because this may happen<br />
for small events <strong>and</strong> noisy backgrounds, or low signal to<br />
noise ratio in some frequency b<strong>and</strong>s. To reduce the false detection<br />
rate, all three components (vertical, N–S <strong>and</strong> E–W)<br />
<strong>of</strong> the seismograms are used in the event detection procedure.<br />
Results<br />
To test the automatic detection method, Station Nord data<br />
from 6 July 2010 to 6 March 2011 were used. Prior to this<br />
period, the digitising unit <strong>of</strong> the seismometer had been upgraded<br />
to sample at 100 Hz. Earlier, the instrument had sampled<br />
at 20 Hz; this limits earthquake analysis to frequencies<br />
below 10 Hz, which the automatic method was not prepared<br />
for. Station Nord is equipped with a Streckeisen STS-2 sensor<br />
<strong>and</strong> a Quanterra Q330 digitiser. The automatic method<br />
analyses data from all three components <strong>of</strong> the sensor, using<br />
24 hour data files. The data are b<strong>and</strong> pass filtered between<br />
0.95 <strong>and</strong> 20 Hz before the detection algorithm is applied. The<br />
Plot start 10 Feb. 2011 4:52:15.000<br />
Vertical component<br />
North–south component<br />
East–west component<br />
A<br />
Duration<br />
Filter: 1–17 Hz<br />
Time (min.; UTC)<br />
04:53 04:54 04:55 04:56 04:57 04:58<br />
Plot start <strong>26</strong> Sep. 2010 10:15:59.320<br />
Vertical component<br />
Vertical component<br />
P<br />
S<br />
S<br />
P<br />
Filter: 1–17 Hz<br />
Time (min.; UTC)<br />
10:17 10:18 10:19 10:20 10:21<br />
Filter: 2–9 Hz<br />
Fig. 3. A: Seismogram <strong>of</strong> a magnitude 2.2 earthquake filtered with a 1–17<br />
Hz b<strong>and</strong> pass filter containing the frequencies used for the automatic detection.<br />
The epicentre was located 354 km south-south-east <strong>of</strong> Station<br />
Nord. The automatic P-phase (P) was kept in the review, but the automatic<br />
S-phase (S) was repicked moving the epicentre 118 km. Automatic S pick<br />
is seen on the north–south channel, manual S pick is seen on the east–west<br />
channel <strong>and</strong> the automatic tremor duration is seen on the vertical channel.<br />
B: Vertical component <strong>of</strong> an earthquake not detected by the automatic<br />
method. Top trace: data with the 1–17 Hz filter used by the automatic<br />
method. Bottom trace: data with the 2–9 Hz filter used by the manual<br />
method. The earthquake had a magnitude <strong>of</strong> 1.1 <strong>and</strong> was located 234 km<br />
east-south-east <strong>of</strong> Station Nord. UTC: Universal Time, Coordinated.<br />
B<br />
79
detections are stored in the international SEISAN format.<br />
During the test period, 156 detections were recorded with<br />
the automatic method. A review <strong>of</strong> these detections showed<br />
that 13 were due to sensor calibrations or sensor noise, <strong>and</strong> 52<br />
were caused by other noise signals such as man-made noise.<br />
The remaining 91 events were identified as earthquakes.<br />
To test the performance <strong>of</strong> the automatic method, the data<br />
were also analysed with the Rasmussen method, where data<br />
are manually scanned using predefined time windows <strong>and</strong> filters<br />
(Rasmussen & Voss 2011). During this manual scanning,<br />
the z-channel was checked in two-hourly windows using a<br />
2–9 Hz b<strong>and</strong> pass filter, the same filter that is used to analyse<br />
the data from the seismometer at Danmarkshavn in the daily<br />
processing at GEUS. The scanning found 229 earthquakes<br />
in the study period, approximately two <strong>and</strong> a half times more<br />
earthquakes than found by the automatic method. An example<br />
<strong>of</strong> an earthquake that was not detected by the automatic<br />
method is shown in Fig. 3B. Comparison <strong>of</strong> the lists<br />
<strong>of</strong> earthquakes detected by the two methods shows that the<br />
automatic detections do not give a full subset <strong>of</strong> the manual<br />
detections, as the automatic method detected <strong>26</strong> events that<br />
were not found by the manual method. A review <strong>of</strong> these <strong>26</strong><br />
earthquakes showed that 23 had a low signal to noise ratio in<br />
the frequency range <strong>of</strong> the b<strong>and</strong> pass filter (2–9 Hz) used <strong>and</strong><br />
three earthquakes were missed during the analysis.<br />
After the detection procedure, we processed the detected<br />
events. In this process, the arrival times <strong>of</strong> the P- <strong>and</strong> S-phases<br />
were picked <strong>and</strong> the magnitude <strong>of</strong> the signal determined.<br />
The automatic method picks P- <strong>and</strong> S-phases <strong>and</strong> uses the<br />
duration <strong>of</strong> the signal tremor to estimate the magnitude. We<br />
reviewed the 91 earthquakes detected <strong>and</strong> found that the automatic<br />
pick <strong>of</strong> the P- <strong>and</strong> S-phases should be adjusted for<br />
all earthquakes. Most <strong>of</strong> the adjustments were within a few<br />
seconds, but for seven <strong>of</strong> the events the automatic pick errors<br />
were several seconds. In many cases, the duration <strong>of</strong> the automatic<br />
signal located the end <strong>of</strong> the event in the last part <strong>of</strong> the<br />
S wave, but in some instances the end <strong>of</strong> the duration was in<br />
the end <strong>of</strong> the P wave. A similar approach was used by Agius<br />
& Galea (2011) with good results, but further improvement<br />
<strong>of</strong> the processing is required. Examples <strong>of</strong> the performance<br />
<strong>of</strong> the automatic method are shown on seismograms in Fig 3.<br />
Discussion <strong>and</strong> conclusions<br />
The manual detection method found two <strong>and</strong> a half times<br />
more events than the automatic detection method. Replacement<br />
<strong>of</strong> the manual method with the automatic detection <strong>of</strong><br />
earthquakes in Greenl<strong>and</strong> will therefore result in a significantly<br />
lower number <strong>of</strong> earthquake detections. The quality<br />
<strong>of</strong> earthquake risk evaluation depends on a high detection<br />
level; thus a lower number <strong>of</strong> detections will lead to a lower<br />
quality <strong>of</strong> an earthquake risk evaluation. The automatic<br />
method contributed with <strong>26</strong> (11%) additional events to the<br />
manual detections, <strong>and</strong> hence a combination <strong>of</strong> the two<br />
methods may increase the number <strong>of</strong> earthquakes detected<br />
in the region. In addition, the automatic method was effective<br />
in avoiding false detections.<br />
The automatic method gives earthquake locations <strong>and</strong><br />
magnitude estimates, based on automatic phase picks, phase<br />
polarisation <strong>and</strong> signal duration, but the quality <strong>of</strong> this information<br />
is poorer than that obtained by manual processing. A<br />
manual review <strong>of</strong> the data will still be an important part <strong>of</strong><br />
the quality control.<br />
Acknowledgements<br />
This study is part <strong>of</strong> a PhD project funded by the International Institute<br />
<strong>of</strong> Earthquake Engineering <strong>and</strong> Seismology for the first author, who was a<br />
visiting PhD student at GEUS in 2011. The Greenl<strong>and</strong> Ice Sheet Monitoring<br />
Network is thanked for upgrading Station Nord.<br />
References<br />
Agius, M.R. & Galea, P. 2011: A single-station automated earthquake location<br />
system at Wied Dalam Station, Malta. Seismological Research<br />
Letters 82, 545–559.<br />
Chung, W.-Y. 2002: Earthquakes along the passive margin <strong>of</strong> Greenl<strong>and</strong>:<br />
evidence for postglacial rebound control. Pure <strong>and</strong> Applied Geophysics<br />
159, 2567–2584.<br />
Døssing, A., Stemmerik, L., Dahl-Jensen, T. & Schlindwein, V. 2010: Segmentation<br />
<strong>of</strong> the eastern North Greenl<strong>and</strong> oblique-shear margin – regional<br />
plate tectonic implications. Earth <strong>and</strong> Planetary Science Letters<br />
292, 239–253.<br />
Gibbons, S. J., Ringdal, F. & Kværna, T. 2008: Detection <strong>and</strong> characterization<br />
<strong>of</strong> seismic phases using continuous spectral estimation on incoherent<br />
<strong>and</strong> partially coherent arrays. Geophysical Journal International<br />
172, 405–421.<br />
Gregersen, S. 1982: Seismicity <strong>and</strong> observations <strong>of</strong> Lg wave attenuation in<br />
Greenl<strong>and</strong>. Tectonophysics 89, 77–93.<br />
Havskov, J. & Alguacil, G. 2010: Instrumentation in earthquake seismology.<br />
Modern Approaches in Geophysics 22, 360 pp.<br />
Lehmann, I. 1954: Characteristic earthquake records. Geodætisk Instituts<br />
Skrifter III. Række 18, 33 pp.<br />
Rasmussen, H.P. & Voss, P.H. 2011: Detection <strong>of</strong> earthquakes at the <strong>Geological</strong><br />
<strong>Survey</strong> <strong>of</strong> <strong>Denmark</strong> <strong>and</strong> Greenl<strong>and</strong> – GEUS. 42nd Nordic Seminar<br />
on Detection Seismology, Reykjavik, 5–7 October 2011. Icel<strong>and</strong>ic<br />
Meteorological Office, programme <strong>and</strong> abstracts, 41 only.<br />
Voss, P., Poulsen, S.K., Simonson, S.B. & Gregersen, S. 2007: Seismic<br />
hazard assessment <strong>of</strong> Greenl<strong>and</strong>. <strong>Geological</strong> <strong>Survey</strong> <strong>of</strong> <strong>Denmark</strong> <strong>and</strong><br />
Greenl<strong>and</strong> <strong>Bulletin</strong> 13, 57–60.<br />
Authors’ addresses<br />
N.K. & G.D.J., International Institute <strong>of</strong> Earthquake Engineering <strong>and</strong> Seismology, Arghavan St. 21, North Dibajee, Farmanieh Tehran 3913/19395<br />
Islamic Republic <strong>of</strong> Iran. E-mail: n.karamzadeh@iiees.ac.ir<br />
P.H.V., <strong>Geological</strong> <strong>Survey</strong> <strong>of</strong> <strong>Denmark</strong> <strong>and</strong> Greenl<strong>and</strong>, Øster Voldgade 10, DK-1350 Copenhagen K, <strong>Denmark</strong>.<br />
80
The Cenozoic Song Hong <strong>and</strong> Beibuwan Basins, Vietnam<br />
Michael B.W. Fyhn, Henrik I. Petersen, Lars Henrik Nielsen, Tran C. Giang, Le H. Nga,<br />
Nguyen T.M. Hong, Nguyen D. Nguyen <strong>and</strong> Ioannis Abatzis<br />
The Vietnamese <strong>of</strong>fshore margin holds a substantially underexplored<br />
petroleum potential. The key to unravelling this<br />
potential lies in underst<strong>and</strong>ing the tectono-stratigraphic<br />
framework <strong>of</strong> the region including the Cenozoic mechanisms<br />
governing syn-rift <strong>and</strong> source rock deposition. This is essential<br />
for prediction <strong>of</strong>, for instance the presence <strong>and</strong> nature <strong>of</strong><br />
source rocks in South-East Asia <strong>and</strong> possible reservoir intervals<br />
in the syn-rift packages. The Vietnamese part <strong>of</strong> the Song<br />
Hong <strong>and</strong> Beibuwan Basins (Fig. 1) differs from other basins<br />
along the western margin <strong>of</strong> the South China Sea in that the<br />
Palaeogene syn-rift succession is sporadically exposed due<br />
to uplift <strong>and</strong> inversion. These exposures provide a unique<br />
glimpse into the Cenozoic syn-rift succession <strong>of</strong> the basin.<br />
Considerable oil <strong>and</strong> condensate discoveries have recently<br />
been made in the Vietnamese part <strong>of</strong> the Song Hong Basin.<br />
This emphasises the need for improved geological models <strong>of</strong><br />
the basin in order to unravel the local petroleum systems.<br />
Since 1995, the <strong>Geological</strong> <strong>Survey</strong> <strong>of</strong> <strong>Denmark</strong> <strong>and</strong><br />
Greenl<strong>and</strong> <strong>and</strong> the Vietnam Petroleum Institute have conducted<br />
exploration-related, foreign development aid projects<br />
in Vietnam funded by the Danish Ministry <strong>of</strong> Foreign Affairs.<br />
The ongoing Danish–Vietnamese research cooperation<br />
operates through an ENhanced REsearch CApacity<br />
(ENRECA) project. The ENRECA group consists <strong>of</strong> both<br />
Danish <strong>and</strong> Vietnamese researchers who, through the project,<br />
have become the established experts in the region. The<br />
ongoing ENRECA work focuses on the geological development<br />
<strong>of</strong> the greater Song Hong Basin (including the Vietnamese<br />
part <strong>of</strong> the Beibuwan Basin). As part <strong>of</strong> the project<br />
activities, the ENRECA group has recently drilled a fully<br />
cored well into the syn-rift succession <strong>of</strong> the basin <strong>and</strong> is carrying<br />
out a comprehensive regional study combining seismic,<br />
well <strong>and</strong> outcrop information.<br />
Evolution <strong>of</strong> the the Song Hong Basin <strong>and</strong><br />
the greater Vietnamese margin<br />
South-East Asia is tectonically one <strong>of</strong> the most complex regions<br />
in the world, shaped by continental collisions <strong>and</strong> the<br />
creation <strong>and</strong> subduction <strong>of</strong> oceanic basins. A large portion <strong>of</strong><br />
the deformation associated with the Indian–Eurasian plate<br />
collision was likely accommodated in the neighbouring part<br />
<strong>of</strong> South-East Asia during the Cenozoic (e.g. Leloup et al.<br />
2001). Indochina deformed in response to the collision <strong>and</strong><br />
may have been squeezed hundreds <strong>of</strong> kilometres south-east-<br />
Laos<br />
Malaysia<br />
Vietnam<br />
Thail<strong>and</strong><br />
Mae Ping Shear Zone<br />
Malay<br />
Basin<br />
Red River Fault Zone<br />
Cambodia<br />
W.<br />
Natuna<br />
Basin<br />
250 km<br />
Song Hong Basin<br />
Quang<br />
Ngai<br />
Nha Trang<br />
Cuu Long Basin<br />
Nam Con Son Basin<br />
6<br />
110°E<br />
Bach Long Vi<br />
Beibuwan Basin<br />
Phu Khanh<br />
Basin<br />
Pearl River Mouth Basin<br />
South China Sea<br />
5E<br />
5E<br />
Dangerous<br />
Grounds<br />
China<br />
Qiongdongnan Basin<br />
Borneo<br />
Basins with Palaeogene lacustrine <strong>and</strong><br />
coaly syn-rift source rocks<br />
Oceanic crust with numbered<br />
magnetic anomalies<br />
11<br />
11<br />
6A<br />
5E<br />
5E<br />
6B<br />
10<br />
6B<br />
6A<br />
6B<br />
6A 6A<br />
6 6<br />
6A<br />
5E<br />
6B<br />
6A<br />
Main Cenozoic strike-slip direction<br />
9<br />
20°N<br />
Fig. 1. Map <strong>of</strong> Indochina <strong>and</strong> the western part <strong>of</strong> the South China Sea<br />
showing the outline <strong>of</strong> the main Cenozoic structures <strong>and</strong> basins with lacustrine<br />
<strong>and</strong> coaly source rocks. The large red rectangle shows the study<br />
area, <strong>and</strong> the small rectangle shows the location <strong>of</strong> Fig. 3.<br />
6B<br />
8<br />
11<br />
9<br />
8<br />
5°N<br />
10<br />
11<br />
© 2012 GEUS. <strong>Geological</strong> <strong>Survey</strong> <strong>of</strong> <strong>Denmark</strong> <strong>and</strong> Greenl<strong>and</strong> <strong>Bulletin</strong> <strong>26</strong>, 81–84. Open access: www.geus.dk/publications/bull<br />
81
I I<br />
I<br />
I<br />
I<br />
I<br />
I<br />
I<br />
I I<br />
I<br />
I<br />
I<br />
I<br />
I<br />
I<br />
I<br />
I<br />
I<br />
I<br />
I<br />
I<br />
I<br />
I<br />
I<br />
I<br />
I<br />
I<br />
I<br />
I<br />
I<br />
I<br />
I<br />
I<br />
I<br />
I<br />
I<br />
I<br />
I<br />
I<br />
I<br />
I<br />
I<br />
I<br />
I<br />
I<br />
I<br />
I<br />
I<br />
I<br />
I<br />
I<br />
I<br />
I<br />
I<br />
I<br />
I<br />
I I I<br />
I<br />
I<br />
I<br />
I<br />
I<br />
I<br />
I<br />
I<br />
I<br />
I<br />
I<br />
I<br />
I I<br />
I<br />
I I<br />
I<br />
I<br />
I<br />
I<br />
I<br />
I<br />
I<br />
I I<br />
I<br />
I<br />
I<br />
I<br />
I<br />
I<br />
I<br />
I<br />
I<br />
I<br />
I<br />
I<br />
I<br />
I<br />
I<br />
I<br />
I<br />
I<br />
I<br />
I<br />
I<br />
I<br />
I<br />
I<br />
I<br />
I<br />
I<br />
I<br />
I<br />
I<br />
I<br />
I<br />
I<br />
I<br />
I<br />
I<br />
I<br />
I<br />
I<br />
I<br />
I<br />
I<br />
I<br />
I<br />
I<br />
I<br />
I<br />
I<br />
I<br />
I<br />
I<br />
I<br />
Quang Ngai<br />
I I I I I I I I I<br />
I I I I<br />
Qui Nhon<br />
Nha Trang<br />
109°E<br />
I I I<br />
I I I I I<br />
I I I<br />
I I I I I I I I<br />
I I<br />
I I I I<br />
I I<br />
I I<br />
I I I I I<br />
I I I I I I<br />
I<br />
I I I I<br />
I<br />
I I<br />
I I<br />
I<br />
I I<br />
I<br />
I<br />
I I<br />
I<br />
I<br />
I I<br />
I I I I I<br />
I<br />
I<br />
I<br />
I<br />
I<br />
■■<br />
I<br />
I<br />
I<br />
I<br />
I I I<br />
I<br />
I I I<br />
I I<br />
I I I<br />
I I<br />
I I<br />
I<br />
I<br />
I I<br />
I I<br />
I<br />
I<br />
I I I I I<br />
I<br />
I<br />
I I I<br />
I<br />
I<br />
Intra-Miocene<br />
13°N 13°N<br />
Tuy Hoa<br />
Carbonate platform<br />
(predominant)<br />
Carbonate detritus<br />
apron<br />
Carbonate ramp<br />
Alluvial – neritic<br />
(siliciclastics)<br />
Bathyal<br />
(siliciclastics)<br />
Slope<br />
(siliciclastics)<br />
I<br />
I<br />
100 km<br />
I<br />
Volcano/basalt delta<br />
I<br />
Geology concealed<br />
underneath volcanics<br />
Subaerially exposed<br />
non-deposition<br />
Present l<strong>and</strong> with<br />
major cities<br />
I<br />
Steep platform margin<br />
Active fault<br />
Fig. 2. Intra-Miocene depositional map for the southern part <strong>of</strong> the Song<br />
Hong <strong>and</strong> the Phu Khanh Basins. Carbonate deposition took place on<br />
structural highs, but was affected by siliciclastic input sourced from onshore<br />
uplift <strong>and</strong> local volcanism.<br />
I I I I I<br />
I<br />
I<br />
I<br />
I<br />
I<br />
I<br />
I<br />
I<br />
I<br />
wards from the Himalayan collision front along enormous<br />
strike-slip fault zones (Fig. 1).<br />
The Song Hong Basin is the largest Vietnamese sedimentary<br />
basin <strong>and</strong> covers close to one third <strong>of</strong> the western margin<br />
<strong>of</strong> the South China Sea. Its formation has been attributed to<br />
large-scale, left-lateral movements along the Vietnamese margin<br />
(e.g. Leloup et al. 2001), whereas a pull-apart model for<br />
the basin remains controversial (e.g. Hall & Morley 2004).<br />
Underst<strong>and</strong>ing the basic mechanism behind the formation<br />
<strong>of</strong> the Song Hong Basin is crucial for underst<strong>and</strong>ing the<br />
overall establishment <strong>of</strong> the western half <strong>of</strong> the South China<br />
Sea. The Song Hong Basin is likely to hold important information<br />
on the opening mechanism <strong>of</strong> the South China Sea.<br />
Whether the greater Vietnamese margin constitutes a<br />
transform margin or a more classic oblique rift margin is<br />
fundamental to the structural concepts applied when interpreting<br />
geophysical data across basins along the margin. So<br />
far it has not been possible to evaluate this satisfactorily due<br />
to the scarcity <strong>of</strong> seismic data tied to a limited number <strong>of</strong><br />
wells <strong>of</strong>fshore Vietnam. However, recent studies <strong>of</strong> relatively<br />
densely spaced seismic pr<strong>of</strong>iles tied to wells <strong>of</strong>fshore central<br />
<strong>and</strong> southern Vietnam have led to an increased underst<strong>and</strong>ing<br />
<strong>of</strong> the tectonic evolution <strong>of</strong> the margin (Fyhn et al. 2009).<br />
It is clear from these studies that the Song Hong Basin is crucial<br />
for reconstructing the overall tectonic development <strong>of</strong><br />
the western South China Sea.<br />
The current ENRECA study is based on a comprehensive<br />
geoscientific database <strong>of</strong> the Vietnamese portion <strong>of</strong> the basin<br />
<strong>and</strong> aims to unravel the tectonic <strong>and</strong> depositional evolution<br />
<strong>of</strong> the basin in a regional context. This will allow a detailed<br />
stratigraphic underst<strong>and</strong>ing <strong>of</strong> the basin fill <strong>and</strong> a comprehensive<br />
structural analysis <strong>of</strong> the basin <strong>and</strong> the adjacent areas.<br />
The Song Hong Basin forms a depocentre in the northwestern<br />
part <strong>of</strong> the South China Sea <strong>and</strong> is filled with up<br />
to 15–20 km <strong>of</strong> sediments. Sediment dispersal to the northwestern<br />
part <strong>of</strong> the South China Sea has largely occurred as<br />
spill from the Song Hong Basin. The distribution <strong>and</strong> style<br />
<strong>of</strong> sediments in the surrounding basins are therefore closely<br />
linked to the depositional pattern in the Song Hong Basin.<br />
Deposition evolved rapidly in the basin <strong>and</strong> varied in time<br />
<strong>and</strong> space from lacustrine <strong>and</strong> fluvial to marine sedimentation.<br />
Sedimentary environments ranged from carbonate<br />
platform, siliciclastic <strong>and</strong> lava deltas to shelf, slope <strong>and</strong> basin<br />
floor <strong>and</strong> were subject to relative sea-level changes. Combined<br />
with high sedimentation rates this makes the basin<br />
well suited for studies <strong>of</strong> Cenozoic depositional trends along<br />
the western South China Sea.<br />
The depositional development in the basin is investigated<br />
through seismic stratigraphic <strong>and</strong> facies analyses, <strong>and</strong> well<br />
data are closely integrated in the analysis in order to extract<br />
age <strong>and</strong> lithologic information. Palaeogeographic reconstructions<br />
illustrate the gross-sedimentary evolution <strong>of</strong> the<br />
basin <strong>and</strong> form a primary result <strong>of</strong> this part <strong>of</strong> the study<br />
(Fig. 2). Information on the regional geological evolution<br />
can be obtained from the depositional style <strong>of</strong> the basin in<br />
addition to information on the establishment <strong>of</strong> the South<br />
82
I<br />
I<br />
I<br />
I<br />
I<br />
I<br />
I<br />
I<br />
I<br />
I<br />
I<br />
I<br />
I I I<br />
I<br />
I<br />
I<br />
I<br />
I<br />
I<br />
I<br />
I<br />
I<br />
I<br />
I<br />
Two-way travel time (sec)<br />
0<br />
500<br />
1000<br />
1500<br />
A<br />
NW<br />
5 km<br />
Inverted<br />
syn-rift<br />
Bach Long Vi well projected<br />
c. 5 km along structural strike<br />
Post-rift<br />
SE<br />
B<br />
I<br />
I I<br />
I I<br />
I I I<br />
I I<br />
I<br />
I I I I I<br />
I I<br />
Tien Lang<br />
I<br />
I<br />
I<br />
I I I<br />
I I<br />
I<br />
I I I I I I I<br />
I<br />
I I I<br />
Do Son<br />
I I I I<br />
Chi Linh<br />
Bach Long Vi<br />
I I<br />
I<br />
I I I<br />
Yen Tu<br />
I<br />
I<br />
I I I I<br />
I<br />
I I<br />
I I<br />
I I I I I I I I I<br />
I I I I I I<br />
I<br />
I<br />
I<br />
I I I<br />
Fig. 3A<br />
N<br />
I I I I I I I I I I I<br />
I I I<br />
Neogene<br />
Eocene–Oligocene syn-rift<br />
Basement <strong>and</strong> Palaeozoic–Mesozoic pre-rift<br />
Basement/syn-rift prospects<br />
Major fault<br />
Seismic line<br />
Palaeogene<br />
rift system<br />
I I<br />
I<br />
I I I I I I I<br />
20 km<br />
Fig. 3. A: Geotransect across the inverted Palaeogene graben, which is exposed on the isl<strong>and</strong> <strong>of</strong> Bach Long Vi a few kilometres from the pr<strong>of</strong>ile. The approximate<br />
well trajectory is projected onto the section. The transect is based on the seismic line 89-1-103 (partly shown on Fig. 3B, red, dotted line). B: Map<br />
showing the outline <strong>of</strong> the primary Paleogene syn-rift depocentre <strong>and</strong> syn-rift structural highs in the north-eastern Song Hong Basin. Oil <strong>and</strong> condensate<br />
discoveries in the area are sourced from lacustrine <strong>and</strong> coaly syn-rift source rocks. Bach Long Vi forms a window to a graben directly linked with the syn-rift<br />
kitchen areas <strong>of</strong> the recent discoveries made in fractured <strong>and</strong> karstified Palaeozoic carbonates in the area.<br />
China Sea, regional uplift history, sediment transport <strong>and</strong><br />
Cenozoic climate.<br />
Neogene basalt volcanism affected large parts <strong>of</strong> the Vietnamese<br />
margin from the Nam Con Son Basin in the south<br />
to the Song Hong Basin in the north, <strong>and</strong> acted coeval with<br />
widespread carbonate platform growth along the margin<br />
(Fig. 2). Magmatism was associated with regional onshore<br />
uplift <strong>and</strong> denudation, which seems to have had a significant<br />
derivative effect on contemporary deposition (Fyhn et<br />
al. 2009). Increased siliciclastic input to the <strong>of</strong>fshore basins<br />
<strong>and</strong> elevated inorganic nutrient concentrations in platform<br />
areas associated with onshore uplift <strong>and</strong> denudation led to<br />
a lowering <strong>of</strong> long-term carbonate production <strong>and</strong> deposition.<br />
As a result, carbonate platforms drowned <strong>and</strong> became<br />
buried underneath kilometre-thick, prograding siliciclastic<br />
sediment wedges during the Late Neogene. In the southern<br />
Song Hong Basin, volcanics <strong>and</strong> carbonate platforms are<br />
nicely revealed by seismic data <strong>and</strong> are drilled <strong>and</strong> dated in<br />
wells (Fig. 2).<br />
Syn-rift <strong>and</strong> source-rock deposition<br />
Cretaceous <strong>and</strong> Cenozoic organic-rich lacustrine mudstones<br />
<strong>and</strong> humic coals, which were deposited during periods <strong>of</strong><br />
rifting, form world-class source-rock intervals in South-East<br />
Asia (Fig.1). These source rocks frequently occur adjacent to<br />
coarse-grained, reservoir-quality sedimentary bodies derived<br />
from nearby elevated hinterl<strong>and</strong> areas. Moreover, source-rock<br />
intervals are <strong>of</strong>ten located adjacent to fractured basement or<br />
pre-rift successions with effective reservoir characteristics.<br />
Underst<strong>and</strong>ing these rift systems, including the occurrence<br />
<strong>and</strong> genesis <strong>of</strong> lake systems <strong>and</strong> the sedimentary successions<br />
capable <strong>of</strong> generating <strong>and</strong> storing hydrocarbons, is critical<br />
when evaluating local petroleum systems over larger parts <strong>of</strong><br />
South-East Asia.<br />
It has long been recognised that stratigraphic wells<br />
through syn-rift successions are useful to unravel the deeper<br />
depositional systems including source-rock units (e.g. Sladen<br />
1997). This is particularly true <strong>of</strong>fshore northern Vietnam,<br />
where syn-rift lacustrine <strong>and</strong> coaly-sourced petroleum mainly<br />
occur in fractured <strong>and</strong> karstified pre-rift carbonates. Even<br />
so, little is known about the source-rock system, <strong>and</strong> deep<br />
wells drilled into the syn-rift succession have not provided<br />
information on the source rocks <strong>of</strong> the area. To address this<br />
problem, the ENRECA group drilled a 500 m fully cored<br />
well into the inverted syn-rift succession on the isl<strong>and</strong> <strong>of</strong><br />
Bach Long Vi (Figs 1, 3) where highly oil-prone source-rock<br />
intervals are widespread. The core demonstrates a thick lacustrine<br />
succession within the area. At the time <strong>of</strong> writing,<br />
cores are transported to a core depository to be analysed in<br />
detail. Bach Long Vi has low relief <strong>and</strong> dense vegetation, <strong>and</strong><br />
hence well-exposed outcrops on the isl<strong>and</strong> are limited to locations<br />
along the shore, <strong>and</strong> a satisfactory study <strong>of</strong> syn-rift<br />
sedimentation <strong>and</strong> source-rock quality is not possible based<br />
on outcrops alone. However, combined with the cored stratigraphic<br />
well, the geology <strong>of</strong> Bach Long Vi provides a unique<br />
opportunity to study syn-rift deposition <strong>and</strong> source-rock<br />
composition. The core provides a regional type section <strong>of</strong><br />
83
Bach Long Vi<br />
5 km<br />
Bach Long Vi<br />
20°14´N<br />
20°13´N<br />
A dense net <strong>of</strong> seismic data cover the area <strong>of</strong>fshore Bach<br />
Long Vi <strong>and</strong> reveals a N–S to NE–SW-trending, inverted<br />
Eocene–Oligocene graben. The graben fill sub-crops at <strong>and</strong><br />
closely beneath the seafloor <strong>and</strong> forms the core <strong>of</strong> Bach Long<br />
Vi (Fig. 3A). The graben is part <strong>of</strong> a larger rift system that<br />
actively subsided during Palaeogene time (Fig. 3B). The deposits,<br />
including the sampled source rocks on <strong>and</strong> around<br />
Bach Long Vi, therefore form part <strong>of</strong> a regional syn-rift system,<br />
which is directly continuous with the syn-rift kitchen<br />
areas sourcing the recent oil <strong>and</strong> condensate discoveries in<br />
the region (Fig. 3). The preliminary results suggest that rich<br />
source-rock intervals could be present throughout much <strong>of</strong><br />
the syn-rift succession in the basin, highly encouraging for<br />
further exploration.<br />
500 m<br />
107°72´N<br />
107°74´N<br />
Acknowledgements<br />
The ENRECA project is funded by the Danish Ministry <strong>of</strong> Foreign Affairs<br />
via Danida. PetroVietnam co-funded the ENRECA 3 well <strong>and</strong> is<br />
thanked for providing data <strong>and</strong> for permitting publication <strong>of</strong> this paper.<br />
Fig. 4. Map <strong>of</strong> the isl<strong>and</strong> <strong>of</strong> Bach Long Vi. Red dots show sites <strong>of</strong> sourcerock<br />
samples. The inset map shows the nearest industrial seismic lines in<br />
the area. For location see Figs 1 <strong>and</strong> 3.<br />
the Palaeogene syn-rift succession. Sampled source-rock intervals<br />
are studied through general source rock screening <strong>and</strong><br />
biomarker analysis combined with more advanced analysis <strong>of</strong><br />
selected source-rock intervals.<br />
Situated at the intersection <strong>of</strong> the Beibuwan <strong>and</strong> the Song<br />
Hong Basin, Bach Long Vi occurs in the centre <strong>of</strong> a newly<br />
discovered petroleum province <strong>of</strong>fshore Vietnam (Fig. 3).<br />
Bach Long Vi sits at the top <strong>of</strong> a prominent structure associated<br />
with inversion <strong>of</strong> a Palaeogene graben. The isl<strong>and</strong> therefore<br />
provides a window into the nature <strong>of</strong> the Palaeogene<br />
syn-rift succession <strong>of</strong> the area. Highly oil-prone lacustrine<br />
mudstones with an organic content ranging from c. 2 to 7<br />
wt.% total organic carbon were sampled from scattered outcrops<br />
on Bach Long Vi <strong>and</strong> from sub-sea outcrops around the<br />
isl<strong>and</strong> (Fig. 4). ENRECA analyses <strong>of</strong> these excellent source<br />
rocks confirm that petroleum-prone mudstones occur at various<br />
stratigraphic levels that crop out over the entire area (e.g.<br />
Petersen et al. 2004 <strong>and</strong> new unpublished data).<br />
References<br />
Fyhn, M.B.W., Boldreel, L.O. & Nielsen, L.H. 2009: <strong>Geological</strong> development<br />
<strong>of</strong> the central <strong>and</strong> south Vietnamese margin: Implications for the<br />
establishment <strong>of</strong> the South China Sea, Indochinese escape tectonics<br />
<strong>and</strong> Cenozoic volcanism. Tectonophysics 478, 184–214.<br />
Hall, R. & Morley, C.K. 2004: Sundal<strong>and</strong> Basins. In: Clift, P. et al. (eds):<br />
Continent–ocean interactions within the East Asian marginal seas.<br />
Geophysical Monograph Series 149, 55–85. Washington D.C.: American<br />
Geophysical Union.Leloup, P.H., Arnaud, N., Lacassin, R., Kienast,<br />
J.R., Harrison, T.M., Trong, T.T.P., Replumaz, A. & Tapponnier, P.<br />
2001: New constraints on the structure, thermochronology <strong>and</strong> timing<br />
<strong>of</strong> the Ailao Shan-Red River shear zone, SE Asia. Journal <strong>of</strong> Geophysical<br />
Research 106, B4, 6683–6732.<br />
Petersen, H.I., Nyt<strong>of</strong>t, H.P. & Nielsen, L.H. 2004: Characterisation <strong>of</strong><br />
oil <strong>and</strong> potential source rocks in the northeastern Song Hong Basin,<br />
Vietnam: indications <strong>of</strong> a lacustrine–coal sourced petroleum system.<br />
Organic Geochemistry 35, 493–515.<br />
Sladen, C. 1997: Exploring the lake basins <strong>of</strong> east <strong>and</strong> Southeast Asia. In:<br />
Fraser, A.J., Matthews, S.J. & Murphy, R.W. (eds): Petroleum geology<br />
<strong>of</strong> Southeast Asia. <strong>Geological</strong> Society Special Publications (London)<br />
1<strong>26</strong>, 49–76.<br />
Authors’ addresses<br />
M.B.W.F., H.I.P., L.H.N. & I.A., <strong>Geological</strong> <strong>Survey</strong> <strong>of</strong> <strong>Denmark</strong> <strong>and</strong> Greenl<strong>and</strong>, Øster Voldgade 10, DK-1350 Copenhagen K, <strong>Denmark</strong>.<br />
E-mail: mbwf@geus.dk<br />
T.C.G. & L.H.Ng., Vietnam Petroleum Institute, 173 Trung Kinh Str., Yen Hoa Wrd., Cau Giay Dist., Hanoi, Vietnam.<br />
N.T.M.H., Hanoi University <strong>of</strong> Mining <strong>and</strong> Geology, Dong Ngac, Tu Liem, Hanoi, Vietnam.<br />
N.D.N., Hanoi University <strong>of</strong> Science, 334 Nguyen Trai-Thanh Xuan-Hanoi, Vietnam.<br />
84
I<br />
Rock phosphate <strong>and</strong> lime for small-scale farming<br />
in Tanzania, East Africa<br />
Per Kalvig, Niels Fold, Jesper Bosse Jønsson <strong>and</strong> Elisante Elisaimon Mshiu<br />
Poor soils are a major cause <strong>of</strong> poverty in sub-Saharan Africa,<br />
<strong>and</strong> thus restoration <strong>of</strong> soil fertility is a significant challenge<br />
for sustainable agriculture. Some <strong>of</strong> the main resources required,<br />
e.g. phosphate <strong>and</strong> lime, are present in many African<br />
countries <strong>and</strong> can be used by smallholder farmers in a<br />
relatively unprocessed form instead <strong>of</strong> expensive commercial<br />
fertilisers. Here we present a small study <strong>of</strong> the Mbeya region<br />
in Tanzania, which locally has both phosphate <strong>and</strong> lime.<br />
Most soils in sub-Saharan Africa are losing nutrients<br />
necessary for sustainable agriculture. This is mainly due<br />
to intensive farming <strong>and</strong> the fact that the nutrients are not<br />
replaced adequately. Further reasons for nutrient losses are<br />
leaching, soil erosion <strong>and</strong> fixation by iron <strong>and</strong> aluminium<br />
oxides. Vast areas experience moderate to acute phosphorus<br />
deficiency (Vanlauwe & Giller 2006).<br />
The Mbeya region in south-western Tanzania (Fig. 1) is<br />
characterised by intensive smallholder plots along with several<br />
local sources <strong>of</strong> phosphate-bearing rocks <strong>and</strong> limestone.<br />
The former were examined in the 1980s (Chesworth et al.<br />
1988, 1989), but have never been utilised (Kalvig et al. 2010).<br />
Phosphates <strong>and</strong> lime – opportunities <strong>and</strong><br />
constraints<br />
Soils may become acid for many reasons <strong>and</strong> high rainfall<br />
may lead to washing out the nutrients needed for healthy<br />
plant growth. Thus phosphorus <strong>and</strong> calcium deficiencies are<br />
common factors that restrict plant growth in highly leached<br />
tropical soils. The majority <strong>of</strong> smallholders cannot afford to<br />
use adequate quantities <strong>of</strong> commercial fertilisers <strong>and</strong> lime,<br />
resulting in low yields. An alternative is to use local sources,<br />
which can improve agricultural productivity by slowly releasing<br />
essential elements <strong>and</strong> raising the pH value <strong>of</strong> the soil.<br />
Phosphates, lime, potassium-rich minerals, clay, zeolite <strong>and</strong><br />
mica are common locally, but lacking awareness <strong>of</strong> their effects,<br />
very few smallholders use them. If such an awareness<br />
could be fostered <strong>and</strong> local resources made available at affordable<br />
prices, it would give farmers an opportunity to improve<br />
their crop yields (van Straaten 2002; Mitchell 2005).<br />
The phosphate potential in Tanzania was outlined twenty<br />
years ago by Mchihiyo (1991). The study presented here<br />
shows that local phosphate can be made available at affordable<br />
costs.<br />
Phosphate minerals. Natural fertilisers are available <strong>and</strong> can<br />
be used untreated. They comprise organic fertilisers such<br />
as manure, leaf litter <strong>and</strong> sludge, <strong>and</strong> rock fertilisers such as<br />
marl, rock phosphate, volcanic rock <strong>and</strong> mica. In contrast to<br />
natural fertilisers, artificial fertilisers are readily soluble <strong>and</strong><br />
contain guaranteed total, active nutrient concentrations.<br />
The practical challenges <strong>and</strong> potential benefits involved<br />
in the use <strong>of</strong> rock phosphate have been widely discussed<br />
(Mchihiyo 1991; Appleton 2002; van Straaten 2002, 2006;<br />
Vanaluwe & Giller 2006). The general view is that the use <strong>of</strong><br />
rock phosphate for local agriculture is justified, provided its<br />
addition is managed in accordance with the type <strong>of</strong> crop <strong>and</strong><br />
the conditions <strong>of</strong> the soil. Usually, crop yields only show a<br />
slow response over 2–3 years after the addition <strong>of</strong> rock phosphates,<br />
which makes it difficult to generate interest among<br />
local farmers.<br />
The solubility <strong>of</strong> phosphate-bearing rocks differs widely<br />
depending on the mineralogy <strong>and</strong> chemistry <strong>of</strong> the rock<br />
9°S<br />
Rukwa Rift<br />
Lake Rukwa<br />
I<br />
I<br />
I<br />
I<br />
I I<br />
Major road<br />
Minor road<br />
Railway<br />
River<br />
Regional capital<br />
District capital<br />
International boundary<br />
Prospects<br />
33°E<br />
33°E Kenya<br />
Njelenje<br />
Sukumavera<br />
Songwe Scarp<br />
Muvwa Mbeya<br />
Nanyala<br />
I<br />
I<br />
I<br />
I<br />
I<br />
I<br />
I<br />
I<br />
I<br />
Mbalizi<br />
P<strong>and</strong>a Hills<br />
25 km<br />
I<br />
400 km<br />
I<br />
I<br />
I I<br />
Tanzania<br />
I I<br />
I<br />
Lake<br />
Nyasa<br />
Fig. 1. Map <strong>of</strong> south-western Tanzania showing the Mbeya region with its<br />
main towns, roads <strong>and</strong> railway. The prospects indicated are known carbonatite<br />
occurrences which were considered potential phosphate resources<br />
by previous studies.<br />
I<br />
I<br />
9°S<br />
© 2012 GEUS. <strong>Geological</strong> <strong>Survey</strong> <strong>of</strong> <strong>Denmark</strong> <strong>and</strong> Greenl<strong>and</strong> <strong>Bulletin</strong> <strong>26</strong>, 85–88. Open access: www.geus.dk/publications/bull<br />
85
type, <strong>and</strong> not all <strong>of</strong> them are therefore effective when applied<br />
directly to the soil. Some important factors for the successful<br />
use <strong>of</strong> rock phosphate are: (1) the type <strong>of</strong> phosphatic rock,<br />
with apatite as the most common phosphate mineral containing<br />
34–42% P 2 O 5 , (2) the reactivity <strong>of</strong> the phosphate<br />
rock, (3) the soil, where in particular pH, cation exchange<br />
capacity, phosphorus <strong>and</strong> calcium concentration, <strong>and</strong> phosphorus-fixing<br />
capacity <strong>of</strong> the soil play important roles, (4)<br />
the type <strong>of</strong> crop, because the ability to use H 2 PO 4 , which<br />
dominates at low pH, differs from crop species to crop species,<br />
<strong>and</strong> (5) fertiliser management (van Straaten 2002).<br />
Rw<strong>and</strong>a<br />
Lake<br />
Tanganyika<br />
30°E<br />
Ubendian<br />
fold belt<br />
Lake<br />
Victoria<br />
Tanzania<br />
craton<br />
Kenya<br />
Lime. The primary reason for increasing the soil pH by liming<br />
is to reduce the aluminium toxicity to plants, <strong>and</strong> to ensure<br />
that Ca, Mg, K <strong>and</strong> P are available to the plant. Raising<br />
the pH value to 5.2–5.5 is adequate for increasing crop<br />
yields, whereas higher values reduce the breakdown <strong>of</strong> rock<br />
phosphate (Mitchell 2005).<br />
Phosphate <strong>and</strong> lime resources in<br />
the Mbeya region<br />
<strong>Geological</strong> setting. In Tanzania, a central Archaean craton is<br />
surrounded by Proterozoic fold belts (Fig. 2). The Mbeya region<br />
lies south-west <strong>of</strong> the Archaean craton in the NW–SEstriking<br />
2000–1800 Ma old Ubendian fold belt. This fold<br />
belt is dominated by gneisses <strong>and</strong> amphibolitic rocks, intruded<br />
by 730 Ma old syenite-gabbro complexes, all <strong>of</strong> which<br />
have been intruded by carbonatite complexes <strong>of</strong> Cretaceous<br />
to late Palaeogene age. During the late Phanerozoic, rifting<br />
<strong>and</strong> faulting occurred in connection with the formation <strong>of</strong><br />
the East African Rift Valley. The occurrence <strong>of</strong> Neogene<br />
sediments such as conglomerate, clay <strong>and</strong> chert as well as volcanic<br />
rocks is related to the rift valley.<br />
Phosphate in the Mbeya region. The most promising phosphate<br />
occurrence is the Songwe Scarp carbonatite, which is<br />
a 20 km long, 50 m wide, NW–SE-striking, 100 ± 10 Ma<br />
old ferrocarbonatite (Miller & Brown 1963; Brown 1964).<br />
Mchihiyo et al. (1992) provide an overview <strong>of</strong> the exploration<br />
history <strong>of</strong> this carbonatite, which took place in the<br />
1950s. The exploration focussed on uranium <strong>and</strong> comprised<br />
geological mapping <strong>of</strong> anomalous zones <strong>of</strong> the carbonatite<br />
some 2 km north-west <strong>of</strong> the village Njelenje (Fig. 1; Brown<br />
1964). In the 1990s, the phosphate was assessed as a potential<br />
source <strong>of</strong> fertiliser (van Straaten 2002).<br />
The exploration led to the recognition that several parts<br />
<strong>of</strong> the Songwe Scarp carbonatite are relatively rich in apatite.<br />
It was also discovered that areas with elevated concentrations<br />
<strong>of</strong> radioactive elements, yttrium <strong>and</strong> other rare-earth<br />
Zambia<br />
10°S 200 km<br />
10°S<br />
Bukobau Supergroup<br />
Cenozoic<br />
Cretaceous Carbonatites<br />
Proterozoic<br />
Mbeya<br />
Sediments<br />
Neogene volcanics<br />
Proterozoic fold belts<br />
Archaean craton<br />
Fig. 2. Simplified geological map <strong>of</strong> Tanzania (based on van Straaten<br />
2002). The Mbeya region (framed) is located in south-western Tanzania.<br />
elements occur near Njelenje (Fig. 3). The highest phosphate<br />
concentrations were found in limonitic residual soils overlying<br />
the carbonatite, with up to 20% P 2 O 5 <strong>and</strong> 6% K 2 O.<br />
These soils can be used as phosphate fertilisers (Chesworth<br />
et al. 1989; Appletorn 2002; van Straten 2002).<br />
In addition to the Songwe Scarp carbonatite, the region<br />
holds several other occurrences <strong>of</strong> phosphate. One is the<br />
P<strong>and</strong>a Hills carbonatite where c. 1 Mt <strong>of</strong> residual phosphates<br />
with a P 2 O 5 concentration up to 10.3% have been mapped<br />
(van Straaten 2002). Another is the Mbalizi carbonatite<br />
where weathered parts locally form a 0.5 m thick limonitic<br />
crust with up to 30% P 2 O 5 (Mchihiyo 1991; Mchihiyo et<br />
al. 1992). This phosphate is under exploration as a potential<br />
source <strong>of</strong> niobium <strong>and</strong> other rare-earth elements. A third<br />
possibility <strong>of</strong> phosphate is guano from bats around Sukumavera,<br />
but the amount is far too small to play any role, even for<br />
smallholders (van Straaten 2002).<br />
Limestone in the Mbeya region. Calcareous sedimentary<br />
rocks, mainly travertine in the Songwe valley, are mined for<br />
(1) dimension stones using a yellowish travertine near Nanyala<br />
in the Mbozi district, (2) carbonate for calcination <strong>and</strong><br />
(3) cement production. Hochstein et al. (2000) <strong>and</strong> Roberts<br />
et al. (2004) provided geological details <strong>of</strong> this limestone<br />
unit <strong>and</strong> estimated that it covers an area <strong>of</strong> c. 13 km 2 with<br />
a thickness <strong>of</strong> 5–70 m, equivalent to >150 000 000 m 3 . An<br />
example <strong>of</strong> a weathered occurrence is shown in Fig. 4.<br />
86
Fig. 3. L<strong>and</strong>scape around the village <strong>of</strong> Njelenje<br />
in the Songwe valley, looking east <strong>and</strong> showing<br />
the Songwe Scarp carbonatite.<br />
Proposals for feasibility studies<br />
Small-scale phosphate operation to supply local smallholders.<br />
The Songwe valley area holds two potential sources for the production<br />
<strong>of</strong> local rock phosphate: carbonatite <strong>and</strong> apatite-rich<br />
residuals <strong>of</strong> carbonatite. Given that previous studies indicate<br />
that enrichment <strong>of</strong> phosphorus has taken place in the residual<br />
apatite-rich soil (Mchihiyo et al. 1992) <strong>and</strong> that a production<br />
based on such soil is technically relatively straightforward, the<br />
present study only considers this source. In the vicinity <strong>of</strong> the<br />
village <strong>of</strong> Njelenje, the P 2 O 5 concentration reaches 18–20%<br />
<strong>and</strong> the K 2 O concentration 6% (Mchihiyo et al. 1992).<br />
A pilot study was conducted in March 2010. The purpose<br />
was to learn from smallholding farmers what their local cultivation<br />
practices are <strong>and</strong> get their views on requirements on<br />
<strong>and</strong> limits to the use <strong>of</strong> locally produced phosphate fertilisers.<br />
The study also aimed at clarifying the availability <strong>of</strong><br />
local labour for small-scale phosphate extraction. The village<br />
<strong>of</strong> Muvwa, located in the Mbeya region, was chosen due<br />
to its proximity to the phosphate resources <strong>of</strong> the Songwe<br />
Scarp carbonatite (Fig. 3). The study area encompassed 420<br />
households corresponding to 1768 inhabitants <strong>of</strong> whom 331<br />
persons were capable <strong>of</strong> working. Twenty-one households<br />
were interviewed in order to learn about the general pattern<br />
<strong>of</strong> cultivation practices. The low number means that the results<br />
are only indicative (Kalvig et al. 2010). As no geological<br />
data on the survey area are available, the data from Njelenje,<br />
situated c. 5 km to the north <strong>of</strong> the interview area, may serve<br />
to indicate the total available phosphorus content <strong>of</strong> the soils<br />
in the survey area.<br />
A feasibility study <strong>of</strong> a potential rock phosphate production<br />
is warranted <strong>and</strong>, based on a labour intensive concept<br />
producing rock fertiliser for local consumption, should (1)<br />
assess the phosphate resource (grade <strong>and</strong> tonnage estimates –<br />
<strong>and</strong> the potential content <strong>of</strong> harmful elements), (2) propose a<br />
suitable set-up for the production <strong>and</strong> (3) assess the distribution<br />
<strong>and</strong> market prospects.<br />
At this stage, no calculations <strong>of</strong> the required amount <strong>of</strong> local<br />
rock phosphate per hectare can be made, because a number<br />
<strong>of</strong> technical data are not yet available: the actual fertility<br />
<strong>of</strong> the soils <strong>of</strong> the trial area; depletion rate <strong>of</strong> phosphorus;<br />
fixation rate <strong>of</strong> phosphorus; identification <strong>of</strong> the most phos-<br />
Fig. 4. Small section <strong>of</strong> limestone in the Nanyala area <strong>of</strong> the Mbeya region<br />
showing the boundary between topsoil <strong>and</strong> weathered rock.<br />
87
phorus dem<strong>and</strong>ing crops; the average phosphorus content <strong>of</strong><br />
the potential rock phosphate.<br />
Small-scale extraction <strong>of</strong> lime to supply local smallholders. In<br />
the village <strong>of</strong> Nanyala, some hundred people are involved in<br />
small-scale mining <strong>of</strong> a weathered, whitish travertine accompanied<br />
by a semi-mechanised production <strong>of</strong> hydrated lime.<br />
More than ten mining licences cover the lime producing area.<br />
The limestone resource in the Songwe valley consists <strong>of</strong><br />
various grades <strong>of</strong> Quaternary to Recent travertine deposits.<br />
It is dominated by poorly consolidated, partly weathered,<br />
whitish rock, <strong>of</strong> which neither the quantity nor the quality<br />
has ever been thoroughly investigated as regards lime for agricultural<br />
use. The ideal agricultural lime is a ground dolomite<br />
or dolomitic limestone with a particle size