silica dust, crystalline, in the form of quartz or cristobalite - IARC ...
silica dust, crystalline, in the form of quartz or cristobalite - IARC ...
silica dust, crystalline, in the form of quartz or cristobalite - IARC ...

You also want an ePaper? Increase the reach of your titles
YUMPU automatically turns print PDFs into web optimized ePapers that Google loves.
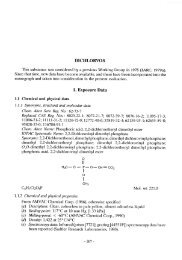
<strong>IARC</strong> MONOGRAPHS – 100C<br />
than <strong>in</strong> 1979–87: general contract<strong>or</strong> <strong>in</strong><strong>dust</strong>ry<br />
(0.057 mg/m 3 versus 0.354 mg/m 3 ), bridgetunnel<br />
construction <strong>in</strong><strong>dust</strong>ry (0.069 mg/m 3<br />
versus 0.383 mg/m 3 ), and stonew<strong>or</strong>k masonry<br />
<strong>in</strong><strong>dust</strong>ry (0.065 mg/m 3 versus 0.619 mg/m 3 ).<br />
Silica exposures <strong>in</strong> <strong>the</strong> grey-iron <strong>in</strong><strong>dust</strong>ry also<br />
decl<strong>in</strong>ed by up to 54% f<strong>or</strong> some occupations (e.g.<br />
<strong>the</strong> geometric mean f<strong>or</strong> “furnace operat<strong>or</strong>s” <strong>in</strong><br />
1979–87 was 0.142 mg/m 3 versus 0.066 mg/m 3<br />
<strong>in</strong> 1988–2003). [The W<strong>or</strong>k<strong>in</strong>g Group noted that<br />
exposure levels may not have decreased globally.]<br />
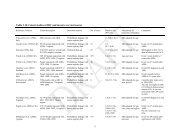
Table 1.3 presents <strong>the</strong> m<strong>or</strong>e recent studies that<br />
assessed <strong>the</strong> levels <strong>of</strong> respirable <strong>crystall<strong>in</strong>e</strong> <strong>silica</strong><br />
<strong>in</strong> a range <strong>of</strong> <strong>in</strong><strong>dust</strong>ries and countries. O<strong>the</strong>r<br />
recent exposure studies that did not measure<br />
<strong>the</strong> respirable <strong>crystall<strong>in</strong>e</strong> <strong>silica</strong> components are<br />
presented below.<br />
(b) M<strong>in</strong>es<br />
As part <strong>of</strong> a coh<strong>or</strong>t m<strong>or</strong>tality study follow-up<br />
<strong>in</strong> four t<strong>in</strong> m<strong>in</strong>es <strong>in</strong> Ch<strong>in</strong>a, Chen et al. (2006)<br />
developed quantitative exposure estimates <strong>of</strong><br />
<strong>silica</strong> mixed <strong>dust</strong>. W<strong>or</strong>kers <strong>in</strong> <strong>the</strong> <strong>or</strong>ig<strong>in</strong>al coh<strong>or</strong>t<br />
were followed up from <strong>the</strong> beg<strong>in</strong>n<strong>in</strong>g <strong>of</strong> 1972 to<br />
<strong>the</strong> end <strong>of</strong> 1994. Cumulative exposure estimates<br />
were calculated f<strong>or</strong> each w<strong>or</strong>ker us<strong>in</strong>g <strong>the</strong>ir m<strong>in</strong>e<br />
employment rec<strong>or</strong>ds and <strong>in</strong><strong>dust</strong>rial hygiene<br />
measurements <strong>of</strong> airb<strong>or</strong>ne total <strong>dust</strong>, particle<br />
size, and free <strong>silica</strong> content collected s<strong>in</strong>ce <strong>the</strong><br />
1950s. Total <strong>dust</strong> concentrations <strong>of</strong> <strong>the</strong> ma<strong>in</strong> job<br />
titles exposed were found to have decl<strong>in</strong>ed from<br />
about 10–25 mg/m 3 <strong>in</strong> <strong>the</strong> beg<strong>in</strong>n<strong>in</strong>g <strong>of</strong> <strong>the</strong> 1950s<br />
to about 1–4 mg/m 3 <strong>in</strong> <strong>the</strong> 1980s and 1990s. The<br />
respirable fraction <strong>of</strong> total <strong>dust</strong> was estimated to<br />
be 25 ± 4%, and <strong>the</strong> respirable <strong>crystall<strong>in</strong>e</strong> <strong>silica</strong><br />
concentration was estimated to be 4.3% <strong>of</strong> <strong>the</strong><br />
total mixed m<strong>in</strong>e <strong>dust</strong><br />
Tse et al. (2007) conducted a cross-sectional<br />
study to <strong>in</strong>vestigate <strong>the</strong> prevalence <strong>of</strong> accelerated<br />
silicosis among 574 gold m<strong>in</strong>ers <strong>in</strong> Jiangxi, Ch<strong>in</strong>a.<br />
Us<strong>in</strong>g occupational hygiene data abstracted from<br />
government documents and bulk <strong>dust</strong> data from<br />
a study <strong>in</strong> ano<strong>the</strong>r gold m<strong>in</strong>e <strong>in</strong> <strong>the</strong> region, <strong>the</strong><br />
estimated mean concentration <strong>of</strong> respirable<br />
<strong>silica</strong> <strong>dust</strong> were rep<strong>or</strong>ted as 89.5 mg/m 3 (range,<br />
70.2–108.8 mg/m 3 ). Acc<strong>or</strong>d<strong>in</strong>g to government<br />
documents, <strong>the</strong> total <strong>dust</strong> concentration <strong>in</strong><br />
underground gold m<strong>in</strong><strong>in</strong>g was <strong>in</strong> <strong>the</strong> range <strong>of</strong><br />
102.6–159 mg/m 3 (average, 130.8 mg/m 3 ), and<br />
<strong>the</strong> fraction <strong>of</strong> <strong>silica</strong> <strong>in</strong> total <strong>dust</strong> was around<br />
75.7–76.1%. No data on <strong>the</strong> prop<strong>or</strong>tion <strong>of</strong> respirable<br />
<strong>dust</strong> were available.<br />
To determ<strong>in</strong>e dose–response relationships<br />
between exposure to respirable <strong>dust</strong> and respirat<strong>or</strong>y<br />
health outcomes, Naidoo et al. (2006) used<br />
hist<strong>or</strong>ical data (n = 3645) and current measurements<br />
(n = 441) to characterize exposure to<br />
respirable coal m<strong>in</strong>e <strong>dust</strong> <strong>in</strong> three South African<br />
coal m<strong>in</strong>es. Jobs were classified <strong>in</strong>to <strong>the</strong> follow<strong>in</strong>g<br />
exposure zones: face (directly <strong>in</strong>volved with coal<br />
extraction), underground backbye (away from<br />
<strong>the</strong> coal m<strong>in</strong><strong>in</strong>g face), and w<strong>or</strong>k on <strong>the</strong> surface.<br />
Based on <strong>the</strong> 8-hour full-shift samples collected<br />
respectively, mean respirable <strong>dust</strong> concentrations<br />
<strong>in</strong> M<strong>in</strong>es 1, 2, and 3, were as follows: 0.91 mg/m 3<br />
(GSD, 3.39; mean <strong>silica</strong> content, 2.3%; n = 102),<br />
1.28 mg/m 3 (GSD, 2.11; mean <strong>silica</strong> content, 1.4%;<br />
n = 63), and 1.90 mg/m 3 (GSD, 2.23; mean <strong>silica</strong><br />
content, 2.7%; n = 73) at <strong>the</strong> face; 0.48 mg/m 3<br />
(GSD, 2.97; mean <strong>silica</strong> content, 1.48%; n = 30),<br />
0.56 mg/m 3 (GSD, 3.71; mean <strong>silica</strong> content,<br />
1.35%; n = 47), and 0.52 mg/m 3 (GSD, 4.06;<br />
mean <strong>silica</strong> content, 0.9%; n = 41) <strong>in</strong> <strong>the</strong> backbye<br />
zone; and, 0.31 mg/m 3 (GSD, 3.52; mean <strong>silica</strong><br />
content, 0.95%; n = 8), 0.15 mg/m 3 (GSD, 3.56;<br />
n = 6), and 0.24 mg/m 3 (GSD, 7.69; mean <strong>silica</strong><br />
content, 0.64%; n = 11) <strong>in</strong> <strong>the</strong> surface zone. Based<br />
on <strong>the</strong> hist<strong>or</strong>ical data, overall geometric mean<br />
<strong>dust</strong> levels were 0.9 mg/m 3 (GSD, 4.9), 1.3 mg/m 3<br />
(GSD, 3.3), and 0.5 mg/m 3 (GSD, 5.6) f<strong>or</strong> M<strong>in</strong>es<br />
1, 2, and 3, respectively.<br />
(c) Granite-quarry<strong>in</strong>g and -process<strong>in</strong>g, crushed<br />
stone, and related <strong>in</strong><strong>dust</strong>ries<br />
Bahrami et al. (2008) described <strong>the</strong> personal<br />
exposure to respirable <strong>dust</strong> and respirable <strong>quartz</strong><br />
<strong>in</strong> stone-crush<strong>in</strong>g units located <strong>in</strong> western Islamic<br />
Republic <strong>of</strong> Iran. A total <strong>of</strong> 40 personal samples<br />
360