Nigeria Banking Sector Coverage - December 2011 'Bad ... - Imara
Nigeria Banking Sector Coverage - December 2011 'Bad ... - Imara
Nigeria Banking Sector Coverage - December 2011 'Bad ... - Imara

Create successful ePaper yourself
Turn your PDF publications into a flip-book with our unique Google optimized e-Paper software.
The 9M results to 30 September <strong>2011</strong> saw gross earnings<br />
for GTB up 15.50% to NGN 138.4bn. Interest income<br />
increased by 10.87% to NGN 94.1bn, while interest<br />
expense was 20.61% lower at NGN 19.6bn. This led to net<br />
interest income gaining 23.78% to NGN 74.5bn. Net fee<br />
and commission income growth was not far behind at<br />
22.97% to NGN 32.0bn. Net foreign exchange income was<br />
NGN 5.7bn vs NGN 3.5bn in 9M 10, while income from<br />
investments was a quarter of the NGN 4.1bn in the<br />
comparative period. After accounting for the NGN 916m<br />
in underwriting income, total operating income came out<br />
at NGN 114.2bn, an increase of 21.05%.<br />
Operating expenses growth was contained to below our<br />
expectations, up just 4.61% to NGN 53.7bn, yielding a<br />
cost to income ratio of 47.01% compared with 54.39%<br />
during the comparative period, and 47.37% at H1 11.<br />
Loan loss expenses more than doubled to NGN 11.0bn (9M<br />
10: NGN 4.0bn) y-o-y, and were 36.88% up from H1 11’s<br />
NGN 8.0bn. Management had indicated at the half year<br />
that all AMCON related transactions for the group had<br />
been concluded, including GTB’s Zenon exposure.<br />
Profit before tax went up by 26.39% to NGN 49.3bn, and<br />
attributable earnings closed the period at NGN 40.5bn.<br />
The latter’s 33.30% rise included an extraordinary income<br />
item of NGN 2.2bn related to the disposal of the bank’s<br />
holding in one of its Small and Medium Enterprises Equity<br />
Investment Scheme positions. EPS was 173 kobo while<br />
HEPS was 164 kobo.<br />
Total assets grew 6.00% from the half year to NGN 1.5tn.<br />
Net loans and advances increased at a greater pace<br />
during Q3, up 12.18% to NGN 703.7bn, while treasury bill<br />
holdings dropped by 17.98% and investment securities<br />
were 16.79% higher. The NPL ratio improved to 2.78%,<br />
this compared with 3.61% at 30 June. Deposit growth was<br />
4.60% to NGN 957.8bn, possibly reflecting limited<br />
appetite in a rising interest rate environment.<br />
Outlook<br />
GTB looks set to perform strongly in FY 11, driven by<br />
efficiencies on the income side, (low cost of funds and<br />
liquidity to take advantage of interest rate hikes), as<br />
well as on the expenses side, with the CIR target of<br />
below 50% likely to be attained. The NPL ratio is<br />
reflective of the much cleaner book, while the<br />
possibility of write backs thanks to aggressive H1<br />
provisioning remains.<br />
Following the publication of the 9M results, we have<br />
revised our forecasts higher for FY 11, also adjusting<br />
for the extraordinary item recorded in Q3. We<br />
estimate diluted EPS to increase to 203 kobo<br />
(adjusted for an assumed 1 for 5 bonus issue), and<br />
dividend per share to be declared of 122 kobo,<br />
representing a payout ratio of 60%. These assumptions<br />
yield RoAE and RoAA ratios of 21.9% and 3.9%<br />
respectively.<br />
Valuation and Recommendation<br />
Using a DCF valuation, we arrive at a target price for<br />
GTB of NGN 19.34, representing 36.2% upside on its<br />
current share price of NGN 14.20. With its consistent<br />
history of solid profitability, backed by impressive<br />
asset management and cost containment skills, GTB<br />
remains our number one pick in the sector. Forward<br />
earnings and dividend yields add weight to our<br />
recommendation, justifying its premium relative<br />
ratings. BUY.<br />
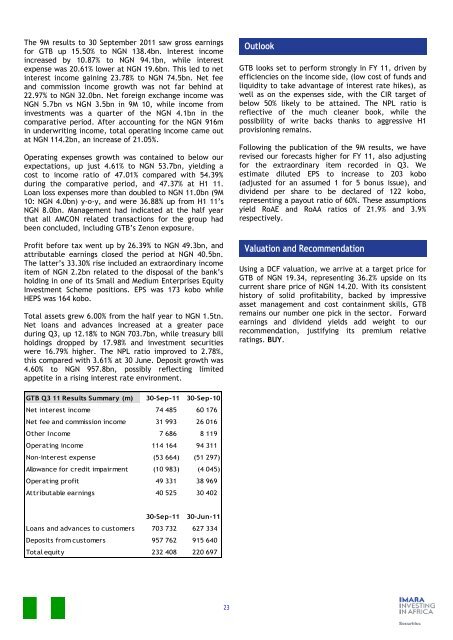
GTB Q3 11 Results Summary (m) 30-Sep-11 30-Sep-10<br />
Net interest income 74 485 60 176<br />
Net fee and commission income 31 993 26 016<br />
RevPar = Estimate<br />
Other Income 7 686 8 119<br />
Operating income 114 164 94 311<br />
Non-interest expense (53 664) (51 297)<br />
Allowance for credit impairment (10 983) (4 045)<br />
Operating profit 49 331 38 969<br />
Attributable earnings 40 525 30 402<br />
30-Sep-11 30-Jun-11<br />
Loans and advances to customers 703 732 627 334<br />
Deposits from customers 957 762 915 640<br />
Total equity 232 408 220 697<br />
23