Nigeria Banking Sector Coverage - December 2011 'Bad ... - Imara
Nigeria Banking Sector Coverage - December 2011 'Bad ... - Imara
Nigeria Banking Sector Coverage - December 2011 'Bad ... - Imara

You also want an ePaper? Increase the reach of your titles
YUMPU automatically turns print PDFs into web optimized ePapers that Google loves.
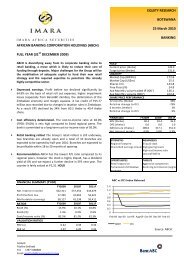
EQUITY RESEARCH<br />
NIGERIA<br />
DECEMBER <strong>2011</strong><br />
BANKING<br />
United Bank for Africa Plc (UBA), is the product of the<br />
merger of what were at the time <strong>Nigeria</strong>’s third and<br />
fifth largest banks, the old UBA and the Standard Trust<br />
Bank Plc, respectively, and a subsequent acquisition of<br />
Continental Trust Bank Limited. Following <strong>Nigeria</strong>’s<br />
independence from Britain, UBA was originally<br />
incorporated in 1961. Today, UBA is one of Africa’s<br />
largest home grown financial institutions, offering<br />
universal banking to more than 7.2 million customers<br />
across 700 branches in 18 African countries, as well as<br />
having a presence in the USA, the UK and France. UBA<br />
has the largest branch network in <strong>Nigeria</strong> (600) and a<br />
total branch network of 726.<br />
• UBA’s recovery lagged many of its contemporaries in<br />
the sector in FY 10 following the challenges of FY 09,<br />
as falling net interest income and losses on AMCON<br />
sales led to attributable earnings decreasing to NGN<br />
668.0m from an annualised NGN 1.7bn in FY 09.<br />
• In 9M 11, the group continued to underperform, with<br />
profit before tax and exceptional items down 28.01%<br />
to NGN 12.1bn, while attributable earnings growth of<br />
91.29% was boosted by a much lower estimated<br />
effective tax rate.<br />
• The pan-African expansion has weighed down on<br />
performance over the years (ex-<strong>Nigeria</strong> African<br />
operations had a CIR of 88% as at the 9M period<br />
compared with 79% for the group), expectedly, but<br />
the tide seemed to have turned, with 9M 11 revealing<br />
a positive PBT number for the first time, of NGN 706m<br />
compared with a loss of NGN 2.9bn at FY 10.<br />
• UBA intends to raise NGN 500bn in additional capital<br />
as part of a strategic funding initiative, via a<br />
combination of debt and equity. This is likely to dilute<br />
earnings in the short to medium term.<br />
• Using a DCF valuation, we arrive at a target price for<br />
UBA of NGN 7.04, meaning the share is trading at a<br />
notable discount at its current price of NGN 2.50. We<br />
believe this reflects the market’s disappointment<br />
with recent results, as well as uncertainty around the<br />
structure (and indeed the need and timing) of the<br />
impending capital raise. HOLD<br />
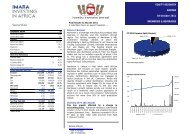
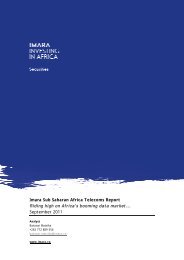
1.4<br />
1.2<br />
1<br />
0.8<br />
0.6<br />
0.4<br />
0.2<br />
0<br />
17-Nov-10<br />
17-Dec-10<br />
17-Jan-11<br />
17-Feb-11<br />
17-Mar-11<br />
UBA vs NSE ASI<br />
17-Apr-11<br />
17-May-11<br />
17-Jun-11<br />
17-Jul-11<br />
17-Aug-11<br />
17-Sep-11<br />
17-Oct-11<br />
17-Nov-11<br />
Recommendation<br />
HOLD<br />
Bloomberg Code<br />
UBA:NL<br />
Current Price (NGN) 2.5<br />
Current Price (USc) 1.5<br />
Target Price (NGN) 7.0<br />
Target Price (USc) 4.3<br />
Upside (%) 181.5<br />
Liquidity<br />
Market Cap (NGN m) 80 837<br />
Shares (m) 32 335<br />
Free Float (est. %) 79.5<br />
Ave. daily vol ('000) - 1 yr. 20 451<br />
Price Performance<br />
Price, 12 months ago (NGN) 7.2<br />
Change (%) (65.5)<br />
Price, 6 months ago (NGN) 6.3<br />
Change (%) (60.2)<br />
Financials (NGN m) 31 Dec F2010 <strong>2011</strong>F 2012F<br />
Loans & Advances 628 811 724 149 862 406<br />
Net Interest Income (excl. Provisions) 70 776 71 333 92 591<br />
Non-Interest Income 67 441 69 135 84 589<br />
Attributable Earnings 668 13 575 24 668<br />
EPS (kobo) 2.6 46.6 76.3<br />
DPS (kobo) 5.0 8.4 19.1<br />
NAV/Share (kobo) 693.6 669.5 698.4<br />
Valuation Ratios Current <strong>2011</strong>F 2012F<br />
Earnings Yield* (%) 7.4 18.7 30.5<br />
Dividend Yield (%) 2.0 3.4 7.6<br />
PE* (x) 13.5 6.0 3.3<br />
PBV (x) 0.42 0.41 0.36<br />
RoaA (%) 0.0 0.7 1.1<br />
RoaE (%) 0.4 7.3 11.7<br />
Net Interest Margin (%) 6.0 5.7 6.1<br />
Cost to Income Ratio (%) 75.2 80.4 72.8<br />
* - trailing<br />
Strengths<br />
Weaknesses<br />
Top tier bank<br />
Inefficient asset mix despite largest branch<br />
<strong>Nigeria</strong>'s largest bank by distribution<br />
network<br />
channels<br />
RoAE currently lagging peers<br />
Brand<br />
Relatively small branch network vs top tier<br />
Opportunities<br />
Threats<br />
Consolidate SSA operations<br />
Longer gestation period for SSA expansion will<br />
Room for growth in LDR to improve margins keep CIR high and restrict earnings growth<br />
Growth in SSA inter-regional trade<br />
Increased regulatory risk due to cross border expansion<br />
UBA<br />
NSE ASI<br />
29