

Journal of Indexes, 2006 - IndexUniverse.com
Journal of Indexes, 2006 - IndexUniverse.com
Journal of Indexes, 2006 - IndexUniverse.com

You also want an ePaper? Increase the reach of your titles
YUMPU automatically turns print PDFs into web optimized ePapers that Google loves.
Tactical investors who use style rotation strategies now<br />
have a new, genuinely innovative investment tool—<br />
the S&P/Citigroup Pure Style Indices. Unlike most<br />
other style indexes, which weight stocks based on market<br />
capitalization, the new Pure Style indexes are weighted by<br />
their growth and value exposures. This gives investors more<br />
<strong>of</strong> a pure play when making style allocation decisions—in<br />
essence, helping them keep their style bets more <strong>com</strong>pletely<br />
focused “inside the box.”<br />
This article briefly describes the methodology, advantages,<br />
disadvantages and applications <strong>of</strong> the Pure Style indexes, and<br />
<strong>com</strong>pares them with their more <strong>com</strong>prehensive but less<br />
focused sister indexes, the S&P/Citigroup Style Indices.<br />
New Sco ring and We i g hting Me t h od o l og i e s<br />
In May <strong>of</strong> 2005, Standard and Poor’s (S&P) announced<br />
plans to retire its S&P/BARRA style index family and replace it<br />
with two new sets <strong>of</strong> indexes: the S&P/Citigroup Style Indices<br />
(“Style”) and S&P/Citigroup Pure Style Indices (“Pure Style”).<br />
As with the old S&P/BARRA style benchmarks, the new Pure<br />
Style and Style index families feature six indexes each, broken<br />
down into the traditional size (large, mid- and small cap) and<br />
style (growth and value) categories. 1<br />
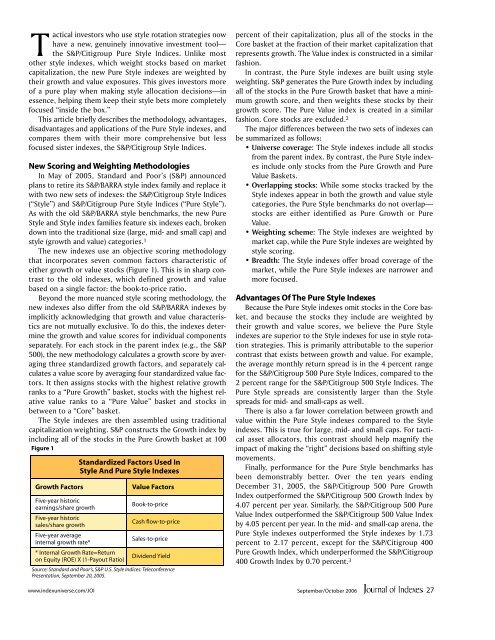
The new indexes use an objective scoring methodology<br />
that incorporates seven <strong>com</strong>mon factors characteristic <strong>of</strong><br />
either growth or value stocks (Figure 1). This is in sharp contrast<br />
to the old indexes, which defined growth and value<br />
based on a single factor: the book-to-price ratio.<br />
Beyond the more nuanced style scoring methodology, the<br />
new indexes also differ from the old S&P/BARRA indexes by<br />
implicitly acknowledging that growth and value characteristics<br />
are not mutually exclusive. To do this, the indexes determine<br />
the growth and value scores for individual <strong>com</strong>ponents<br />
separately. For each stock in the parent index (e.g., the S&P<br />
500), the new methodology calculates a growth score by averaging<br />
three standardized growth factors, and separately calculates<br />
a value score by averaging four standardized value factors.<br />
It then assigns stocks with the highest relative growth<br />
ranks to a “Pure Growth” basket, stocks with the highest relative<br />
value ranks to a “Pure Value” basket and stocks in<br />
between to a “Core” basket.<br />
The Style indexes are then assembled using traditional<br />
capitalization weighting. S&P constructs the Growth index by<br />
including all <strong>of</strong> the stocks in the Pure Growth basket at 100<br />
Figure 1<br />
Growth Factors<br />
Five-year historic<br />
earnings/share growth<br />
Five-year historic<br />
sales/share growth<br />
Five-year average<br />
internal growth rate*<br />
www.indexuniverse.<strong>com</strong>/JOI<br />
Standardized Factors Used In<br />
Style And Pure Style <strong>Indexes</strong><br />
* Internal Growth Rate=Return<br />
on Equity (ROE) X (1-Payout Ratio)<br />
Value Factors<br />
Book-to-price<br />
Cash flow-to-price<br />
Sales-to-price<br />
Dividend Yield<br />
Source: Standard and Poor’s, S&P U.S. Style Indices: Teleconference<br />
Presentation, September 20, 2005.<br />
percent <strong>of</strong> their capitalization, plus all <strong>of</strong> the stocks in the<br />
Core basket at the fraction <strong>of</strong> their market capitalization that<br />
represents growth. The Value index is constructed in a similar<br />
fashion.<br />
In contrast, the Pure Style indexes are built using style<br />
weighting. S&P generates the Pure Growth index by including<br />
all <strong>of</strong> the stocks in the Pure Growth basket that have a minimum<br />
growth score, and then weights these stocks by their<br />
growth score. The Pure Value index is created in a similar<br />
fashion. Core stocks are excluded. 2<br />
The major differences between the two sets <strong>of</strong> indexes can<br />
be summarized as follows:<br />
• Universe coverage: The Style indexes include all stocks<br />
from the parent index. By contrast, the Pure Style indexes<br />
include only stocks from the Pure Growth and Pure<br />
Value Baskets.<br />
• Overlapping stocks: While some stocks tracked by the<br />
Style indexes appear in both the growth and value style<br />
categories, the Pure Style benchmarks do not overlap—<br />
stocks are either identified as Pure Growth or Pure<br />
Value.<br />
• Weighting scheme: The Style indexes are weighted by<br />
market cap, while the Pure Style indexes are weighted by<br />
style scoring.<br />
• Breadth: The Style indexes <strong>of</strong>fer broad coverage <strong>of</strong> the<br />
market, while the Pure Style indexes are narrower and<br />
more focused.<br />
Adva ntages Of The Pu re Style Indexe s<br />
Because the Pure Style indexes omit stocks in the Core basket,<br />
and because the stocks they include are weighted by<br />
their growth and value scores, we believe the Pure Style<br />
indexes are superior to the Style indexes for use in style rotation<br />
strategies. This is primarily attributable to the superior<br />
contrast that exists between growth and value. For example,<br />
the average monthly return spread is in the 4 percent range<br />
for the S&P/Citigroup 500 Pure Style Indices, <strong>com</strong>pared to the<br />
2 percent range for the S&P/Citigroup 500 Style Indices. The<br />
Pure Style spreads are consistently larger than the Style<br />
spreads for mid- and small-caps as well.<br />
There is also a far lower correlation between growth and<br />
value within the Pure Style indexes <strong>com</strong>pared to the Style<br />
indexes. This is true for large, mid- and small caps. For tactical<br />
asset allocators, this contrast should help magnify the<br />
impact <strong>of</strong> making the “right” decisions based on shifting style<br />
movements.<br />
Finally, performance for the Pure Style benchmarks has<br />
been demonstrably better. Over the ten years ending<br />
December 31, 2005, the S&P/Citigroup 500 Pure Growth<br />
Index outperformed the S&P/Citigroup 500 Growth Index by<br />
4.07 percent per year. Similarly, the S&P/Citigroup 500 Pure<br />
Value Index outperformed the S&P/Citigroup 500 Value Index<br />
by 4.05 percent per year. In the mid- and small-cap arena, the<br />
Pure Style indexes outperformed the Style indexes by 1.73<br />
percent to 2.17 percent, except for the S&P/Citigroup 400<br />
Pure Growth Index, which underperformed the S&P/Citigroup<br />
400 Growth Index by 0.70 percent. 3<br />
September/October <strong>2006</strong><br />
27


