- Page 1 and 2:
MICHAEL NEGNEVITSKY Artificial Inte
- Page 3 and 4:
We work with leading authors to dev
- Page 5 and 6:
Pearson Education Limited Edinburgh
- Page 8 and 9:
Contents Preface Preface to the sec
- Page 10 and 11:
CONTENTS ix 7 Evolutionary computat
- Page 12 and 13:
Preface ‘The only way not to succ
- Page 14 and 15:
PREFACE xiii In Chapter 3, we prese
- Page 16:
Prefacetothesecondedition The main
- Page 20 and 21:
Introduction to knowledgebased inte
- Page 22 and 23:
INTELLIGENT MACHINES 3 Figure 1.1 T
- Page 24 and 25:
THE HISTORY OF ARTIFICIAL INTELLIGE
- Page 26 and 27:
THE HISTORY OF ARTIFICIAL INTELLIGE
- Page 28 and 29:
THE HISTORY OF ARTIFICIAL INTELLIGE
- Page 30 and 31:
THE HISTORY OF ARTIFICIAL INTELLIGE
- Page 32 and 33:
THE HISTORY OF ARTIFICIAL INTELLIGE
- Page 34 and 35:
THE HISTORY OF ARTIFICIAL INTELLIGE
- Page 36 and 37:
SUMMARY 17 Although fuzzy systems a
- Page 38 and 39:
SUMMARY 19 Table 1.1 Period A summa
- Page 40 and 41:
QUESTIONS FOR REVIEW 21 or fuzzy se
- Page 42 and 43:
REFERENCES 23 Kosko, B. (1997). Fuz
- Page 44 and 45:
Rule-based expert systems 2 In whic
- Page 46 and 47:
RULES AS A KNOWLEDGE REPRESENTATION
- Page 48 and 49:
THE MAIN PLAYERS IN THE EXPERT SYST
- Page 50 and 51:
STRUCTURE OF A RULE-BASED EXPERT SY
- Page 52 and 53:
FUNDAMENTAL CHARACTERISTICS OF AN E
- Page 54 and 55:
FORWARD AND BACKWARD CHAINING INFER
- Page 56 and 57:
FORWARD AND BACKWARD CHAINING INFER
- Page 58 and 59:
FORWARD AND BACKWARD CHAINING INFER
- Page 60 and 61:
MEDIA ADVISOR: A DEMONSTRATION RULE
- Page 62 and 63:
MEDIA ADVISOR: A DEMONSTRATION RULE
- Page 64 and 65:
MEDIA: A DEMONSTRATION RULE-BASED E
- Page 66 and 67:
CONFLICT RESOLUTION 47 Does MEDIA A
- Page 68 and 69:
CONFLICT RESOLUTION 49 . Fire the m
- Page 70 and 71:
SUMMARY 51 . Dealing with incomplet
- Page 72 and 73:
QUESTIONS FOR REVIEW 53 . Expert sy
- Page 74 and 75:
Uncertainty management in rule-base
- Page 76 and 77:
BASIC PROBABILITY THEORY 57 Table 3
- Page 78 and 79:
BASIC PROBABILITY THEORY 59 single
- Page 80 and 81:
BAYESIAN REASONING 61 Figure 3.1 Th
- Page 82 and 83:
BAYESIAN REASONING 63 places an eno
- Page 84 and 85:
FORECAST: BAYESIAN ACCUMULATION OF
- Page 86 and 87:
FORECAST: BAYESIAN ACCUMULATION OF
- Page 88 and 89:
FORECAST: BAYESIAN ACCUMULATION OF
- Page 90 and 91:
FORECAST: BAYESIAN ACCUMULATION OF
- Page 92 and 93:
BIAS OF THE BAYESIAN METHOD 73 Doma
- Page 94 and 95:
CERTAINTY FACTORS THEORY AND EVIDEN
- Page 96 and 97:
CERTAINTY FACTORS THEORY AND EVIDEN
- Page 98 and 99:
CERTAINTY FACTORS THEORY AND EVIDEN
- Page 100 and 101:
FORECAST: AN APPLICATION OF CERTAIN
- Page 102 and 103:
SUMMARY 83 team also could assume t
- Page 104 and 105:
REFERENCES 85 . Both Bayesian reaso
- Page 106 and 107:
Fuzzy expert systems 4 In which we
- Page 108 and 109:
FUZZY SETS 89 Range of logical valu
- Page 110 and 111:
FUZZY SETS 91 Figure 4.2 Crisp (a)
- Page 112 and 113:
FUZZY SETS 93 Figure 4.3 Crisp (a)
- Page 114 and 115:
LINGUISTIC VARIABLES AND HEDGES 95
- Page 116 and 117:
OPERATIONS OF FUZZY SETS 97 Table 4
- Page 118 and 119:
OPERATIONS OF FUZZY SETS 99 Similar
- Page 120 and 121:
OPERATIONS OF FUZZY SETS 101 Figure
- Page 122 and 123:
FUZZY RULES 103 Example: NOT (tall
- Page 124 and 125:
FUZZY RULES 105 Figure 4.9 Monotoni
- Page 126 and 127:
FUZZY INFERENCE 107 determined by f
- Page 128 and 129:
FUZZY INFERENCE 109 However, the OR
- Page 130 and 131:
FUZZY INFERENCE 111 Step 4: Defuzzi
- Page 132 and 133:
FUZZY INFERENCE 113 Figure 4.15 The
- Page 134 and 135:
BUILDING A FUZZY EXPERT SYSTEM 115
- Page 136 and 137:
BUILDING A FUZZY EXPERT SYSTEM 117
- Page 138 and 139:
BUILDING A FUZZY EXPERT SYSTEM 119
- Page 140 and 141:
BUILDING A FUZZY EXPERT SYSTEM 121
- Page 142 and 143:
BUILDING A FUZZY EXPERT SYSTEM 123
- Page 144 and 145:
SUMMARY 125 4.8 Summary In this cha
- Page 146 and 147:
BIBLIOGRAPHY 127 9 What is clipping
- Page 148:
BIBLIOGRAPHY 129 Zadeh, L.A. (1975)
- Page 151 and 152:
132 FRAME-BASED EXPERT SYSTEMS Figu
- Page 153 and 154:
134 FRAME-BASED EXPERT SYSTEMS of a
- Page 155 and 156:
136 FRAME-BASED EXPERT SYSTEMS - -
- Page 157 and 158:
138 FRAME-BASED EXPERT SYSTEMS Figu
- Page 159 and 160:
140 FRAME-BASED EXPERT SYSTEMS and
- Page 161 and 162:
142 FRAME-BASED EXPERT SYSTEMS such
- Page 163 and 164:
144 FRAME-BASED EXPERT SYSTEMS Figu
- Page 165 and 166:
146 FRAME-BASED EXPERT SYSTEMS valu
- Page 167 and 168:
148 FRAME-BASED EXPERT SYSTEMS Figu
- Page 169 and 170:
150 FRAME-BASED EXPERT SYSTEMS In a
- Page 171 and 172:
152 FRAME-BASED EXPERT SYSTEMS Figu
- Page 173 and 174:
154 FRAME-BASED EXPERT SYSTEMS Figu
- Page 175 and 176:
156 FRAME-BASED EXPERT SYSTEMS illu
- Page 177 and 178:
158 FRAME-BASED EXPERT SYSTEMS Area
- Page 179 and 180:
160 FRAME-BASED EXPERT SYSTEMS ) On
- Page 181 and 182:
162 FRAME-BASED EXPERT SYSTEMS The
- Page 183 and 184:
164 FRAME-BASED EXPERT SYSTEMS Bibl
- Page 185 and 186:
166 ARTIFICIAL NEURAL NETWORKS What
- Page 187 and 188:
168 ARTIFICIAL NEURAL NETWORKS Tabl
- Page 189 and 190:
170 ARTIFICIAL NEURAL NETWORKS Figu
- Page 191 and 192:
172 ARTIFICIAL NEURAL NETWORKS Step
- Page 193 and 194:
174 ARTIFICIAL NEURAL NETWORKS In F
- Page 195 and 196:
176 ARTIFICIAL NEURAL NETWORKS Why
- Page 197 and 198:
178 ARTIFICIAL NEURAL NETWORKS To p
- Page 199 and 200: 180 ARTIFICIAL NEURAL NETWORKS (b)
- Page 201 and 202: 182 ARTIFICIAL NEURAL NETWORKS Then
- Page 203 and 204: 184 ARTIFICIAL NEURAL NETWORKS The
- Page 205 and 206: 186 ARTIFICIAL NEURAL NETWORKS Figu
- Page 207 and 208: 188 ARTIFICIAL NEURAL NETWORKS Figu
- Page 209 and 210: 190 ARTIFICIAL NEURAL NETWORKS Figu
- Page 211 and 212: 192 ARTIFICIAL NEURAL NETWORKS In o
- Page 213 and 214: 194 ARTIFICIAL NEURAL NETWORKS wher
- Page 215 and 216: 196 ARTIFICIAL NEURAL NETWORKS What
- Page 217 and 218: 198 ARTIFICIAL NEURAL NETWORKS In t
- Page 219 and 220: 200 ARTIFICIAL NEURAL NETWORKS Ther
- Page 221 and 222: 202 ARTIFICIAL NEURAL NETWORKS What
- Page 223 and 224: 204 ARTIFICIAL NEURAL NETWORKS Here
- Page 225 and 226: 206 ARTIFICIAL NEURAL NETWORKS The
- Page 227 and 228: 208 ARTIFICIAL NEURAL NETWORKS Figu
- Page 229 and 230: 210 ARTIFICIAL NEURAL NETWORKS Figu
- Page 231 and 232: 212 ARTIFICIAL NEURAL NETWORKS Figu
- Page 233 and 234: 214 ARTIFICIAL NEURAL NETWORKS phys
- Page 235 and 236: 216 ARTIFICIAL NEURAL NETWORKS 10 D
- Page 238 and 239: Evolutionary computation 7 In which
- Page 240 and 241: SIMULATION OF NATURAL EVOLUTION 221
- Page 242 and 243: GENETIC ALGORITHMS 223 Figure 7.2 A
- Page 244 and 245: GENETIC ALGORITHMS 225 Figure 7.3 T
- Page 246 and 247: GENETIC ALGORITHMS 227 Figure 7.5 T
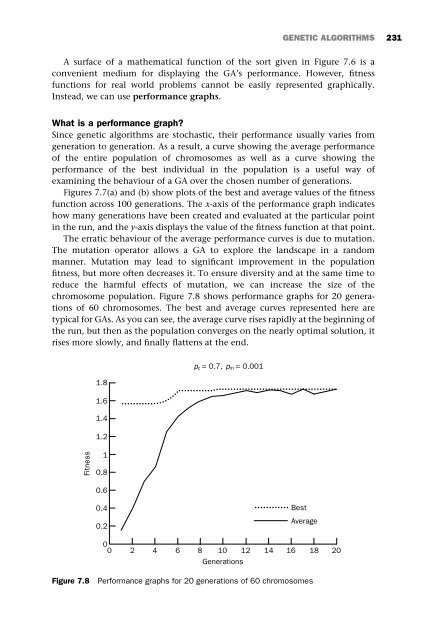
- Page 248 and 249: GENETIC ALGORITHMS 229 When necessa
- Page 252 and 253: WHY GENETIC ALGORITHMS WORK 233 m x
- Page 254 and 255: MAINTENANCE SCHEDULING WITH GENETIC
- Page 256 and 257: MAINTENANCE SCHEDULING WITH GENETIC
- Page 258 and 259: MAINTENANCE SCHEDULING WITH GENETIC
- Page 260 and 261: MAINTENANCE SCHEDULING WITH GENETIC
- Page 262 and 263: EVOLUTION STRATEGIES 243 Define a s
- Page 264 and 265: GENETIC PROGRAMMING 245 Which metho
- Page 266 and 267: GENETIC PROGRAMMING 247 Table 7.3 T
- Page 268 and 269: GENETIC PROGRAMMING 249 Figure 7.15
- Page 270 and 271: GENETIC PROGRAMMING 251 Figure 7.16
- Page 272 and 273: GENETIC PROGRAMMING 253 Figure 7.18
- Page 274 and 275: QUESTIONS FOR REVIEW 255 . Evolutio
- Page 276: BIBLIOGRAPHY 257 Whitley, L.D. (199
- Page 279 and 280: 260 HYBRID INTELLIGENT SYSTEMS repr
- Page 281 and 282: 262 HYBRID INTELLIGENT SYSTEMS enti
- Page 283 and 284: 264 HYBRID INTELLIGENT SYSTEMS Figu
- Page 285 and 286: 266 HYBRID INTELLIGENT SYSTEMS Now
- Page 287 and 288: 268 HYBRID INTELLIGENT SYSTEMS Figu
- Page 289 and 290: 270 HYBRID INTELLIGENT SYSTEMS Figu
- Page 291 and 292: 272 HYBRID INTELLIGENT SYSTEMS Figu
- Page 293 and 294: 274 HYBRID INTELLIGENT SYSTEMS Figu
- Page 295 and 296: 276 HYBRID INTELLIGENT SYSTEMS Figu
- Page 297 and 298: 278 HYBRID INTELLIGENT SYSTEMS sets
- Page 299 and 300: 280 HYBRID INTELLIGENT SYSTEMS How
- Page 301 and 302:
282 HYBRID INTELLIGENT SYSTEMS In t
- Page 303 and 304:
284 HYBRID INTELLIGENT SYSTEMS Figu
- Page 305 and 306:
286 HYBRID INTELLIGENT SYSTEMS Figu
- Page 307 and 308:
288 HYBRID INTELLIGENT SYSTEMS Figu
- Page 309 and 310:
290 HYBRID INTELLIGENT SYSTEMS Figu
- Page 311 and 312:
292 HYBRID INTELLIGENT SYSTEMS word
- Page 313 and 314:
294 HYBRID INTELLIGENT SYSTEMS Step
- Page 315 and 316:
296 HYBRID INTELLIGENT SYSTEMS Step
- Page 317 and 318:
298 HYBRID INTELLIGENT SYSTEMS 4 De
- Page 320 and 321:
Knowledge engineering and data mini
- Page 322 and 323:
INTRODUCTION, OR WHAT IS KNOWLEDGE
- Page 324 and 325:
INTRODUCTION, OR WHAT IS KNOWLEDGE
- Page 326 and 327:
INTRODUCTION, OR WHAT IS KNOWLEDGE
- Page 328 and 329:
WILL AN EXPERT SYSTEM WORK FOR MY P
- Page 330 and 331:
WILL AN EXPERT SYSTEM WORK FOR MY P
- Page 332 and 333:
WILL AN EXPERT SYSTEM WORK FOR MY P
- Page 334 and 335:
WILL AN EXPERT SYSTEM WORK FOR MY P
- Page 336 and 337:
WILL A FUZZY EXPERT SYSTEM WORK FOR
- Page 338 and 339:
WILL A FUZZY EXPERT SYSTEM WORK FOR
- Page 340 and 341:
WILL A FUZZY EXPERT SYSTEM WORK FOR
- Page 342 and 343:
WILL A NEURAL NETWORK WORK FOR MY P
- Page 344 and 345:
WILL A NEURAL NETWORK WORK FOR MY P
- Page 346 and 347:
WILL A NEURAL NETWORK WORK FOR MY P
- Page 348 and 349:
WILL A NEURAL NETWORK WORK FOR MY P
- Page 350 and 351:
WILL A NEURAL NETWORK WORK FOR MY P
- Page 352 and 353:
WILL A NEURAL NETWORK WORK FOR MY P
- Page 354 and 355:
WILL A NEURAL NETWORK WORK FOR MY P
- Page 356 and 357:
WILL GENETIC ALGORITHMS WORK FOR MY
- Page 358 and 359:
WILL A HYBRID INTELLIGENT SYSTEM WO
- Page 360 and 361:
WILL A HYBRID INTELLIGENT SYSTEM WO
- Page 362 and 363:
WILL A HYBRID INTELLIGENT SYSTEM WO
- Page 364 and 365:
WILL A HYBRID INTELLIGENT SYSTEM WO
- Page 366 and 367:
WILL A HYBRID INTELLIGENT SYSTEM WO
- Page 368 and 369:
DATA MINING AND KNOWLEDGE DISCOVERY
- Page 370 and 371:
DATA MINING AND KNOWLEDGE DISCOVERY
- Page 372 and 373:
DATA MINING AND KNOWLEDGE DISCOVERY
- Page 374 and 375:
DATA MINING AND KNOWLEDGE DISCOVERY
- Page 376 and 377:
DATA MINING AND KNOWLEDGE DISCOVERY
- Page 378 and 379:
DATA MINING AND KNOWLEDGE DISCOVERY
- Page 380 and 381:
SUMMARY 361 9.8 Summary In this cha
- Page 382 and 383:
REFERENCES 363 7 Why are fuzzy syst
- Page 384 and 385:
Glossary The glossary entries are c
- Page 386 and 387:
GLOSSARY 367 Back-propagation see B
- Page 388 and 389:
GLOSSARY 369 Clipping A common meth
- Page 390 and 391:
GLOSSARY 371 amounts of data in ord
- Page 392 and 393:
GLOSSARY 373 Evolution strategy A n
- Page 394 and 395:
GLOSSARY 375 Fuzzy rule A condition
- Page 396 and 397:
GLOSSARY 377 Heuristic search A sea
- Page 398 and 399:
GLOSSARY 379 Knowledge base A basic
- Page 400 and 401:
GLOSSARY 381 Method A procedure ass
- Page 402 and 403:
GLOSSARY 383 Output layer The last
- Page 404 and 405:
GLOSSARY 385 Roulette wheel selecti
- Page 406 and 407:
GLOSSARY 387 the network differs fr
- Page 408:
GLOSSARY 389 determines the strengt
- Page 411 and 412:
392 AI TOOLS AND VENDORS EXSYS, Inc
- Page 413 and 414:
394 AI TOOLS AND VENDORS M.4 A powe
- Page 415 and 416:
396 AI TOOLS AND VENDORS CynapSys,
- Page 417 and 418:
398 AI TOOLS AND VENDORS 215 Parkwa
- Page 419 and 420:
400 AI TOOLS AND VENDORS text files
- Page 421 and 422:
402 AI TOOLS AND VENDORS TransferTe
- Page 423 and 424:
404 AI TOOLS AND VENDORS La Jolla,
- Page 425 and 426:
406 AI TOOLS AND VENDORS Fax: +1 (3
- Page 427 and 428:
408 INDEX belongs-to 137-8 Berkeley
- Page 429 and 430:
410 INDEX fuzzification 107 fuzzifi
- Page 431 and 432:
412 INDEX Mamdani, E. 20, 106 Mamda
- Page 434:
INDEX 415 unsupervised learning 200