Sharing the Cost of Backbone Networks - Computer Science
Sharing the Cost of Backbone Networks - Computer Science
Sharing the Cost of Backbone Networks - Computer Science
Create successful ePaper yourself
Turn your PDF publications into a flip-book with our unique Google optimized e-Paper software.
3<br />
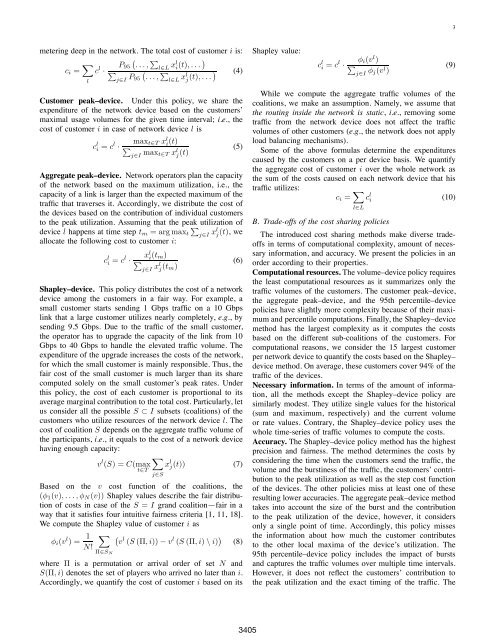
metering deep in <strong>the</strong> network. The total cost <strong>of</strong> customer i is:<br />
c i = ∑ ( ∑<br />
c l P 95 ...,<br />
l∈L ·<br />
xl i<br />
∑<br />
(t),...)<br />
l j∈I P ( (4)<br />
95 ...,<br />
∑l∈L xl j (t),...)<br />
Customer peak–device. Under this policy, we share <strong>the</strong><br />
expenditure <strong>of</strong> <strong>the</strong> network device based on <strong>the</strong> customers’<br />
maximal usage volumes for <strong>the</strong> given time interval; i.e., <strong>the</strong><br />
cost <strong>of</strong> customer i in case <strong>of</strong> network device l is<br />
c l i = cl ·<br />
max t∈T x l i (t)<br />
∑j∈I max t∈T x l j (t) (5)<br />
Aggregate peak–device. Network operators plan <strong>the</strong> capacity<br />
<strong>of</strong> <strong>the</strong> network based on <strong>the</strong> maximum utilization, i.e., <strong>the</strong><br />
capacity <strong>of</strong> a link is larger than <strong>the</strong> expected maximum <strong>of</strong> <strong>the</strong><br />
traffic that traverses it. Accordingly, we distribute <strong>the</strong> cost <strong>of</strong><br />
<strong>the</strong> devices based on <strong>the</strong> contribution <strong>of</strong> individual customers<br />
to <strong>the</strong> peak utilization. Assuming that <strong>the</strong> peak utilization <strong>of</strong><br />
device l happens at time step t m =argmax t<br />
∑j∈I xl j (t), we<br />
allocate <strong>the</strong> following cost to customer i:<br />
c l i = x l<br />
cl i ·<br />
(t m)<br />
∑<br />
j∈I xl j (t m)<br />
Shapley–device. This policy distributes <strong>the</strong> cost <strong>of</strong> a network<br />
device among <strong>the</strong> customers in a fair way. For example, a<br />
small customer starts sending 1 Gbps traffic on a 10 Gbps<br />
link that a large customer utilizes nearly completely, e.g., by<br />
sending 9.5 Gbps. Due to <strong>the</strong> traffic <strong>of</strong> <strong>the</strong> small customer,<br />
<strong>the</strong> operator has to upgrade <strong>the</strong> capacity <strong>of</strong> <strong>the</strong> link from 10<br />
Gbps to 40 Gbps to handle <strong>the</strong> elevated traffic volume. The<br />
expenditure <strong>of</strong> <strong>the</strong> upgrade increases <strong>the</strong> costs <strong>of</strong> <strong>the</strong> network,<br />
for which <strong>the</strong> small customer is mainly responsible. Thus, <strong>the</strong><br />
fair cost <strong>of</strong> <strong>the</strong> small customer is much larger than its share<br />
computed solely on <strong>the</strong> small customer’s peak rates. Under<br />
this policy, <strong>the</strong> cost <strong>of</strong> each customer is proportional to its<br />
average marginal contribution to <strong>the</strong> total cost. Particularly, let<br />
us consider all <strong>the</strong> possible S ⊂ I subsets (coalitions) <strong>of</strong> <strong>the</strong><br />
customers who utilize resources <strong>of</strong> <strong>the</strong> network device l. The<br />
cost <strong>of</strong> coalition S depends on <strong>the</strong> aggregate traffic volume <strong>of</strong><br />
<strong>the</strong> participants, i.e., itequalsto<strong>the</strong>cost<strong>of</strong>anetworkdevice<br />
having enough capacity:<br />
v l (S) =C(max<br />
t∈T<br />
(6)<br />
∑<br />
x l j(t)) (7)<br />
j∈S<br />
Based on <strong>the</strong> v cost function <strong>of</strong> <strong>the</strong> coalitions, <strong>the</strong><br />
(φ 1 (v),...,φ N (v)) Shapley values describe <strong>the</strong> fair distribution<br />
<strong>of</strong> costs in case <strong>of</strong> <strong>the</strong> S = I grand coalition—fair in a<br />
way that it satisfies four intuitive fairness criteria [1, 11, 18].<br />
We compute <strong>the</strong> Shapley value <strong>of</strong> customer i as<br />
φ i (v l )= 1 ∑ (<br />
v l (S (Π,i)) − v l (S (Π,i) \ i) ) (8)<br />
N!<br />
Π∈S N<br />
where Π is a permutation or arrival order <strong>of</strong> set N and<br />
S(Π,i) denotes <strong>the</strong> set <strong>of</strong> players who arrived no later than i.<br />
Accordingly, we quantify <strong>the</strong> cost <strong>of</strong> customer i based on its<br />
Shapley value:<br />
c l i = φ i (v l )<br />
cl · ∑<br />
j∈I φ j(v l )<br />
While we compute <strong>the</strong> aggregate traffic volumes <strong>of</strong> <strong>the</strong><br />
coalitions, we make an assumption. Namely, we assume that<br />
<strong>the</strong> routing inside <strong>the</strong> network is static, i.e., removingsome<br />
traffic from <strong>the</strong> network device does not affect <strong>the</strong> traffic<br />
volumes <strong>of</strong> o<strong>the</strong>r customers (e.g., <strong>the</strong>networkdoesnotapply<br />
load balancing mechanisms).<br />
Some <strong>of</strong> <strong>the</strong> above formulas determine <strong>the</strong> expenditures<br />
caused by <strong>the</strong> customers on a per device basis. We quantify<br />
<strong>the</strong> aggregate cost <strong>of</strong> customer i over <strong>the</strong> whole network as<br />
<strong>the</strong> sum <strong>of</strong> <strong>the</strong> costs caused on each network device that his<br />
traffic utilizes:<br />
c i = ∑ c l i (10)<br />
l∈L<br />
B. Trade-<strong>of</strong>fs <strong>of</strong> <strong>the</strong> cost sharing policies<br />
The introduced cost sharing methods make diverse trade<strong>of</strong>fs<br />
in terms <strong>of</strong> computational complexity, amount <strong>of</strong> necessary<br />
information, and accuracy. We present <strong>the</strong> policies in an<br />
order according to <strong>the</strong>ir properties.<br />
Computational resources. The volume–device policy requires<br />
<strong>the</strong> least computational resources as it summarizes only <strong>the</strong><br />
traffic volumes <strong>of</strong> <strong>the</strong> customers. The customer peak–device,<br />
<strong>the</strong> aggregate peak–device, and <strong>the</strong> 95th percentile–device<br />
policies have slightly more complexity because <strong>of</strong> <strong>the</strong>ir maximum<br />
and percentile computations. Finally, <strong>the</strong> Shapley–device<br />
method has <strong>the</strong> largest complexity as it computes <strong>the</strong> costs<br />
based on <strong>the</strong> different sub-coalitions <strong>of</strong> <strong>the</strong> customers. For<br />
computational reasons, we consider <strong>the</strong> 15 largest customer<br />
per network device to quantify <strong>the</strong> costs based on <strong>the</strong> Shapley–<br />
device method. On average, <strong>the</strong>se customers cover 94% <strong>of</strong> <strong>the</strong><br />
traffic <strong>of</strong> <strong>the</strong> devices.<br />
Necessary information. In terms <strong>of</strong> <strong>the</strong> amount <strong>of</strong> information,<br />
all <strong>the</strong> methods except <strong>the</strong> Shapley–device policy are<br />
similarly modest. They utilize single values for <strong>the</strong> historical<br />
(sum and maximum, respectively) and <strong>the</strong> current volume<br />
or rate values. Contrary, <strong>the</strong> Shapley–device policy uses <strong>the</strong><br />
whole time-series <strong>of</strong> traffic volumes to compute <strong>the</strong> costs.<br />
Accuracy. The Shapley–device policy method has <strong>the</strong> highest<br />
precision and fairness. The method determines <strong>the</strong> costs by<br />
considering <strong>the</strong> time when <strong>the</strong> customers send <strong>the</strong> traffic, <strong>the</strong><br />
volume and <strong>the</strong> burstiness <strong>of</strong> <strong>the</strong> traffic, <strong>the</strong> customers’ contribution<br />
to <strong>the</strong> peak utilization as well as <strong>the</strong> step cost function<br />
<strong>of</strong> <strong>the</strong> devices. The o<strong>the</strong>r policies miss at least one <strong>of</strong> <strong>the</strong>se<br />
resulting lower accuracies. The aggregate peak–device method<br />
takes into account <strong>the</strong> size <strong>of</strong> <strong>the</strong> burst and <strong>the</strong> contribution<br />
to <strong>the</strong> peak utilization <strong>of</strong> <strong>the</strong> device, however, it considers<br />
only a single point <strong>of</strong> time. Accordingly, this policy misses<br />
<strong>the</strong> information about how much <strong>the</strong> customer contributes<br />
to <strong>the</strong> o<strong>the</strong>r local maxima <strong>of</strong> <strong>the</strong> device’s utilization. The<br />
95th percentile–device policy includes <strong>the</strong> impact <strong>of</strong> bursts<br />
and captures <strong>the</strong> traffic volumes over multiple time intervals.<br />
However, it does not reflect <strong>the</strong> customers’ contribution to<br />
<strong>the</strong> peak utilization and <strong>the</strong> exact timing <strong>of</strong> <strong>the</strong> traffic. The<br />
(9)<br />
3405


