Sharing the Cost of Backbone Networks - Computer Science
Sharing the Cost of Backbone Networks - Computer Science
Sharing the Cost of Backbone Networks - Computer Science

You also want an ePaper? Increase the reach of your titles
YUMPU automatically turns print PDFs into web optimized ePapers that Google loves.
4<br />
customer peak–device method solely captures <strong>the</strong> burstiness<br />
<strong>of</strong> <strong>the</strong> traffic. Similarly, <strong>the</strong> volume–device policy focuses<br />
exclusively on <strong>the</strong> aggregate volume <strong>of</strong> <strong>the</strong> customers.<br />
C. Datasets<br />
To quantify <strong>the</strong> costs <strong>of</strong> <strong>the</strong> individual customers, we utilize<br />
two types <strong>of</strong> datasets: traffic volumes and cost functions. We<br />
collected <strong>the</strong> time-series <strong>of</strong> traffic volumes in <strong>the</strong> network <strong>of</strong><br />
abackboneprovider.Weextracted<strong>the</strong>95thpercentiletraffic<br />
volumes <strong>of</strong> individual customers on a two-hour basis using<br />
proprietary network monitoring tools. Our dataset contains<br />
<strong>the</strong> traffic information <strong>of</strong> 401 geographically distributed links<br />
located in 9 countries. More specifically, a customer connects<br />
to a router through one interface; as <strong>the</strong> router has multiple interfaces<br />
it aggregates <strong>the</strong> traffic <strong>of</strong> <strong>the</strong> customers and forwards<br />
this aggregate to <strong>the</strong> monitoring devices. We select <strong>the</strong>se links<br />
because <strong>of</strong> <strong>the</strong>ir number, as <strong>the</strong>y are <strong>the</strong> leaves <strong>of</strong> <strong>the</strong> network,<br />
and <strong>the</strong>refore <strong>the</strong>y account for a large portion <strong>of</strong> <strong>the</strong> overall<br />
cost <strong>of</strong> network [3]. The dataset stores 4 weeks <strong>of</strong> traffic data<br />
ranging from 5 May 2011 until 11 June 2011.<br />
As numerous factors impact <strong>the</strong> network cost, such as<br />
hardware costs, energy prices, deployment costs, or taxation—<br />
to mention a few—it is challenging to quantify <strong>the</strong> accurate<br />
cost <strong>of</strong> every single network device. To overcome this issue,<br />
we estimate <strong>the</strong> expenditures <strong>of</strong> network links based on <strong>the</strong><br />
wholesale lease prices <strong>of</strong> a backbone operator. To this extent,<br />
we assume that <strong>the</strong> pricing <strong>of</strong> <strong>the</strong> network services is in line<br />
with <strong>the</strong> inferred costs. The cost <strong>of</strong> network links depends<br />
on <strong>the</strong> capacity <strong>of</strong> <strong>the</strong> link, i.e., alinkcapabletotransmit<br />
more data costs more. However, <strong>the</strong> geographic location <strong>of</strong> <strong>the</strong><br />
link plays a crucial role in <strong>the</strong> expenditures. In our empirical<br />
study, we apply <strong>the</strong> normalized prices <strong>of</strong> network links with<br />
different capacities, ranging from E-1 (2 Mbps) throughout<br />
STM-4 (622 Mbps) and 2.5G waves to 40G waves (40000<br />
Mbps), and geographic locations such as Europe, USA, and<br />
Latin America. The costs <strong>of</strong> <strong>the</strong>se links define a step function<br />
for <strong>the</strong> network expenditures. Exact values can be provided to<br />
interested parties if confidentiality requirements are met.<br />
III. EMPIRICAL RESULTS<br />
In this section we analyze <strong>the</strong> costs <strong>of</strong> customers from an<br />
empirical point <strong>of</strong> view by building on <strong>the</strong> policies and datasets<br />
described in <strong>the</strong> previous section.<br />
A. Discrepancies between <strong>the</strong> cost sharing policies<br />
First, we focus on <strong>the</strong> accuracy <strong>of</strong> <strong>the</strong> different policies that<br />
allocate <strong>the</strong> cost <strong>of</strong> <strong>the</strong> network infrastructure to <strong>the</strong> customers.<br />
In order to focus solely on <strong>the</strong> features <strong>of</strong> <strong>the</strong> methods, we<br />
apply <strong>the</strong> same cost function under all policies.<br />
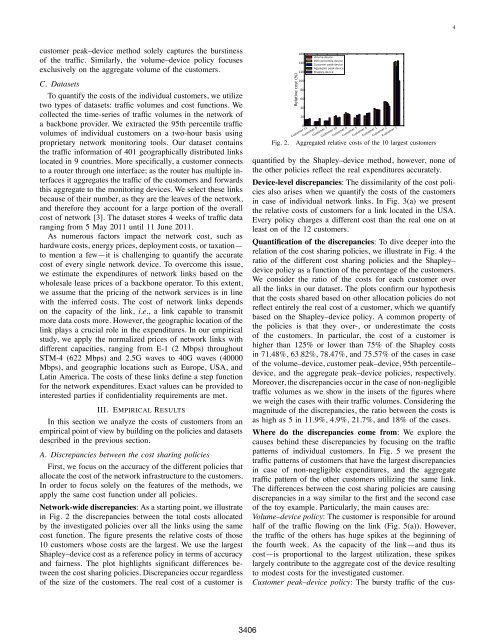
Network-wide discrepancies:Asastartingpoint,weillustrate<br />
in Fig. 2 <strong>the</strong> discrepancies between <strong>the</strong> total costs allocated<br />
by <strong>the</strong> investigated policies over all <strong>the</strong> links using <strong>the</strong> same<br />
cost function. The figure presents <strong>the</strong> relative costs <strong>of</strong> those<br />
10 customers whose costs are <strong>the</strong> largest. We use <strong>the</strong> largest<br />
Shapley–device cost as a reference policy in terms <strong>of</strong> accuracy<br />
and fairness. The plot highlights significant differences between<br />
<strong>the</strong> cost sharing policies. Discrepancies occur regardless<br />
<strong>of</strong> <strong>the</strong> size <strong>of</strong> <strong>the</strong> customers. The real cost <strong>of</strong> a customer is<br />
Fig. 2.<br />
Aggregated relative costs <strong>of</strong> <strong>the</strong> 10 largest customers<br />
quantified by <strong>the</strong> Shapley–device method, however, none <strong>of</strong><br />
<strong>the</strong> o<strong>the</strong>r policies reflect <strong>the</strong> real expenditures accurately.<br />
Device-level discrepancies: Thedissimilarity<strong>of</strong><strong>the</strong>costpolicies<br />
also arises when we quantify <strong>the</strong> costs <strong>of</strong> <strong>the</strong> customers<br />
in case <strong>of</strong> individual network links. In Fig. 3(a) we present<br />
<strong>the</strong> relative costs <strong>of</strong> customers for a link located in <strong>the</strong> USA.<br />
Every policy charges a different cost than <strong>the</strong> real one on at<br />
least on <strong>of</strong> <strong>the</strong> 12 customers.<br />
Quantification <strong>of</strong> <strong>the</strong> discrepancies: Todivedeeperinto<strong>the</strong><br />
relation <strong>of</strong> <strong>the</strong> cost sharing policies, we illustrate in Fig. 4<strong>the</strong><br />
ratio <strong>of</strong> <strong>the</strong> different cost sharing policies and <strong>the</strong> Shapley–<br />
device policy as a function <strong>of</strong> <strong>the</strong> percentage <strong>of</strong> <strong>the</strong> customers.<br />
We consider <strong>the</strong> ratio <strong>of</strong> <strong>the</strong> costs for each customer over<br />
all <strong>the</strong> links in our dataset. The plots confirm our hypo<strong>the</strong>sis<br />
that <strong>the</strong> costs shared based on o<strong>the</strong>r allocation policies do not<br />
reflect entirely <strong>the</strong> real cost <strong>of</strong> a customer, which we quantify<br />
based on <strong>the</strong> Shapley–device policy. A common property <strong>of</strong><br />
<strong>the</strong> policies is that <strong>the</strong>y over-, or underestimate <strong>the</strong> costs<br />
<strong>of</strong> <strong>the</strong> customers. In particular, <strong>the</strong> cost <strong>of</strong> a customer is<br />
higher than 125% or lower than 75% <strong>of</strong> <strong>the</strong> Shapley costs<br />
in 71.48%, 63.82%, 78.47%, and 75.57% <strong>of</strong> <strong>the</strong> cases in case<br />
<strong>of</strong> <strong>the</strong> volume–device, customer peak–device, 95th percentile–<br />
device, and <strong>the</strong> aggregate peak–device policies, respectively.<br />
Moreover, <strong>the</strong> discrepancies occur in <strong>the</strong> case <strong>of</strong> non-negligible<br />
traffic volumes as we show in <strong>the</strong> insets <strong>of</strong> <strong>the</strong> figures where<br />
we weigh <strong>the</strong> cases with <strong>the</strong>ir traffic volumes. Considering <strong>the</strong><br />
magnitude <strong>of</strong> <strong>the</strong> discrepancies, <strong>the</strong> ratio between <strong>the</strong> costs is<br />
as high as 5 in 11.9%, 4.9%, 21.7%, and 18% <strong>of</strong> <strong>the</strong> cases.<br />
Where do <strong>the</strong> discrepancies come from: Weexplore<strong>the</strong><br />
causes behind <strong>the</strong>se discrepancies by focusing on <strong>the</strong> traffic<br />
patterns <strong>of</strong> individual customers. In Fig. 5 we present <strong>the</strong><br />
traffic patterns <strong>of</strong> customers that have <strong>the</strong> largest discrepancies<br />
in case <strong>of</strong> non-negligible expenditures, and <strong>the</strong> aggregate<br />
traffic pattern <strong>of</strong> <strong>the</strong> o<strong>the</strong>r customers utilizing <strong>the</strong> same link.<br />
The differences between <strong>the</strong> cost sharing policies are causing<br />
discrepancies in a way similar to <strong>the</strong> first and <strong>the</strong> second case<br />
<strong>of</strong> <strong>the</strong> toy example. Particularly, <strong>the</strong> main causes are:<br />
Volume–device policy:Thecustomerisresponsibleforaround<br />
half <strong>of</strong> <strong>the</strong> traffic flowing on <strong>the</strong> link (Fig. 5(a)). However,<br />
<strong>the</strong> traffic <strong>of</strong> <strong>the</strong> o<strong>the</strong>rs has huge spikes at <strong>the</strong> beginning <strong>of</strong><br />
<strong>the</strong> fourth week. As <strong>the</strong> capacity <strong>of</strong> <strong>the</strong> link—and thus its<br />
cost—is proportional to <strong>the</strong> largest utilization, <strong>the</strong>se spikes<br />
largely contribute to <strong>the</strong> aggregate cost <strong>of</strong> <strong>the</strong> device resulting<br />
to modest costs for <strong>the</strong> investigated customer.<br />
Customer peak–device policy: Theburstytraffic<strong>of</strong><strong>the</strong>cus-<br />
3406