Teacher turnover in special and general education: attrition
Teacher turnover in special and general education: attrition
Teacher turnover in special and general education: attrition

Create successful ePaper yourself
Turn your PDF publications into a flip-book with our unique Google optimized e-Paper software.
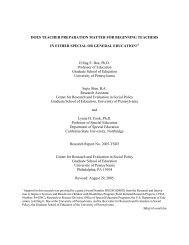
<strong>Teacher</strong> Turnover<br />
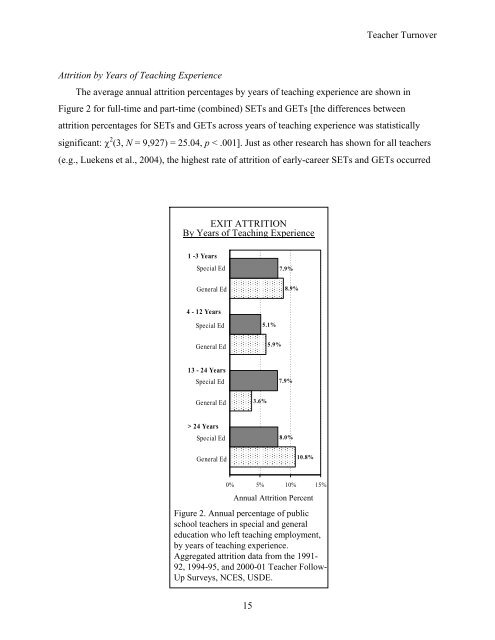
Attrition by Years of Teach<strong>in</strong>g Experience<br />
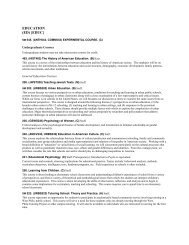
The average annual <strong>attrition</strong> percentages by years of teach<strong>in</strong>g experience are shown <strong>in</strong><br />
Figure 2 for full-time <strong>and</strong> part-time (comb<strong>in</strong>ed) SETs <strong>and</strong> GETs [the differences between<br />
<strong>attrition</strong> percentages for SETs <strong>and</strong> GETs across years of teach<strong>in</strong>g experience was statistically<br />
significant: χ 2 (3, N = 9,927) = 25.04, p < .001]. Just as other research has shown for all teachers<br />
(e.g., Luekens et al., 2004), the highest rate of <strong>attrition</strong> of early-career SETs <strong>and</strong> GETs occurred<br />
EXIT ATTRITION<br />
By Years of Teach<strong>in</strong>g Experience<br />
1 -3 Years<br />
Special Ed<br />
7.9%<br />
General Ed<br />
8.9%<br />
4 - 12 Years<br />
Special Ed<br />
5.1%<br />
General Ed<br />
5.9%<br />
13 - 24 Years<br />
Special Ed<br />
7.9%<br />
General Ed<br />
3.6%<br />
> 24 Years<br />
Special Ed<br />
8.0%<br />
General Ed<br />
10.8%<br />
0% 5% 10% 15%<br />
Annual Attrition Percent<br />
Figure 2. Annual percentage of public<br />
school teachers <strong>in</strong> <strong>special</strong> <strong>and</strong> <strong>general</strong><br />
<strong>education</strong> who left teach<strong>in</strong>g employment,<br />
by years of teach<strong>in</strong>g experience.<br />
Aggregated <strong>attrition</strong> data from the 1991-<br />
92, 1994-95, <strong>and</strong> 2000-01 <strong>Teacher</strong> Follow-<br />
Up Surveys, NCES, USDE.<br />
15