Teacher turnover in special and general education: attrition
Teacher turnover in special and general education: attrition
Teacher turnover in special and general education: attrition

You also want an ePaper? Increase the reach of your titles
YUMPU automatically turns print PDFs into web optimized ePapers that Google loves.
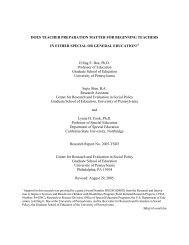
<strong>Teacher</strong> Turnover<br />
Corporate Attrition<br />
NonBus<strong>in</strong>ess<br />
Health Care<br />
13.2%<br />
17.2%<br />
Special Ed<br />
General Ed<br />
10.1%<br />
9.7%<br />
0% 5% 10% 15% 20% 25%<br />
Annual Corporate Attrition Percent<br />
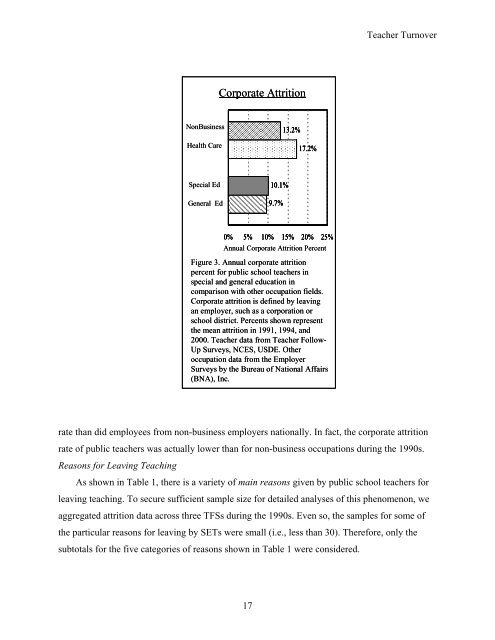
Figure 3. Annual corporate <strong>attrition</strong><br />
percent for public school teachers <strong>in</strong><br />
<strong>special</strong> <strong>and</strong> <strong>general</strong> <strong>education</strong> <strong>in</strong><br />
comparison with other occupation fields.<br />
Corporate <strong>attrition</strong> is def<strong>in</strong>ed by leav<strong>in</strong>g<br />
an employer, such as a corporation or<br />
school district. Percents shown represent<br />
the mean <strong>attrition</strong> <strong>in</strong> 1991, 1994, <strong>and</strong><br />
2000. <strong>Teacher</strong> data from <strong>Teacher</strong> Follow-<br />
Up Surveys, NCES, USDE. Other<br />
occupation data from the Employer<br />
Surveys by the Bureau of National Affairs<br />
(BNA), Inc.<br />
rate than did employees from non-bus<strong>in</strong>ess employers nationally. In fact, the corporate <strong>attrition</strong><br />
rate of public teachers was actually lower than for non-bus<strong>in</strong>ess occupations dur<strong>in</strong>g the 1990s.<br />
Reasons for Leav<strong>in</strong>g Teach<strong>in</strong>g<br />
As shown <strong>in</strong> Table 1, there is a variety of ma<strong>in</strong> reasons given by public school teachers for<br />
leav<strong>in</strong>g teach<strong>in</strong>g. To secure sufficient sample size for detailed analyses of this phenomenon, we<br />
aggregated <strong>attrition</strong> data across three TFSs dur<strong>in</strong>g the 1990s. Even so, the samples for some of<br />
the particular reasons for leav<strong>in</strong>g by SETs were small (i.e., less than 30). Therefore, only the<br />
subtotals for the five categories of reasons shown <strong>in</strong> Table 1 were considered.<br />
17