Teacher turnover in special and general education: attrition
Teacher turnover in special and general education: attrition
Teacher turnover in special and general education: attrition

Create successful ePaper yourself
Turn your PDF publications into a flip-book with our unique Google optimized e-Paper software.
<strong>Teacher</strong> Turnover<br />
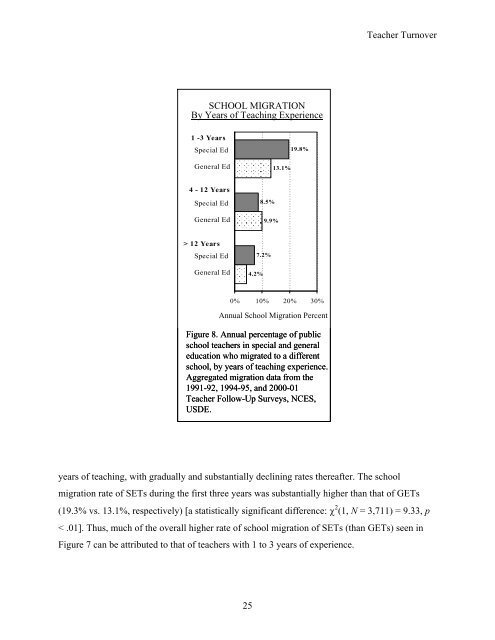
SCHOOL MIGRATION<br />
By Years of Teach<strong>in</strong>g Experience<br />
1 -3 Years<br />
Special Ed<br />
General Ed<br />
19.8%<br />
13.1%<br />
4 - 12 Years<br />
Special Ed<br />
General Ed<br />
8.5%<br />
9.9%<br />
> 12 Years<br />
Special Ed<br />
General Ed<br />
7.2%<br />
4.2%<br />
0% 10% 20% 30%<br />
Annual School Migration Percent<br />
Figure 8. Annual percentage of public<br />
school teachers <strong>in</strong> <strong>special</strong> <strong>and</strong> <strong>general</strong><br />
<strong>education</strong> who migrated to a different<br />
school, by years of teach<strong>in</strong>g experience.<br />
Aggregated migration data from the<br />
1991-92, 1994-95, <strong>and</strong> 2000-01<br />
<strong>Teacher</strong> Follow-Up Surveys, NCES,<br />
USDE.<br />
years of teach<strong>in</strong>g, with gradually <strong>and</strong> substantially decl<strong>in</strong><strong>in</strong>g rates thereafter. The school<br />
migration rate of SETs dur<strong>in</strong>g the first three years was substantially higher than that of GETs<br />
(19.3% vs. 13.1%, respectively) [a statistically significant difference: χ 2 (1, N = 3,711) = 9.33, p<br />
< .01]. Thus, much of the overall higher rate of school migration of SETs (than GETs) seen <strong>in</strong><br />
Figure 7 can be attributed to that of teachers with 1 to 3 years of experience.<br />
25