Teacher turnover in special and general education: attrition
Teacher turnover in special and general education: attrition
Teacher turnover in special and general education: attrition

You also want an ePaper? Increase the reach of your titles
YUMPU automatically turns print PDFs into web optimized ePapers that Google loves.
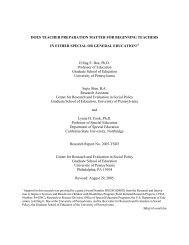
<strong>Teacher</strong> Turnover<br />
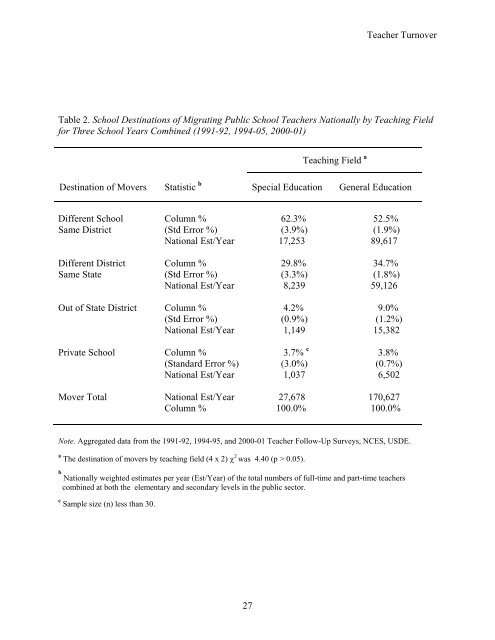
Table 2. School Dest<strong>in</strong>ations of Migrat<strong>in</strong>g Public School <strong>Teacher</strong>s Nationally by Teach<strong>in</strong>g Field<br />
for Three School Years Comb<strong>in</strong>ed (1991-92, 1994-05, 2000-01)<br />
Teach<strong>in</strong>g Field a<br />
Dest<strong>in</strong>ation of Movers Statistic b Special Education General Education<br />
Different School Column % 62.3% 52.5%<br />
Same District (Std Error %) (3.9%) (1.9%)<br />
National Est/Year 17,253 89,617<br />
Different District Column % 29.8% 34.7%<br />
Same State (Std Error %) (3.3%) (1.8%)<br />
National Est/Year 8,239 59,126<br />
Out of State District Column % 4.2% 9.0%<br />
(Std Error %) (0.9%) (1.2%)<br />
National Est/Year 1,149 15,382<br />
Private School Column % 3.7% c 3.8%<br />
(St<strong>and</strong>ard Error %) (3.0%) (0.7%)<br />
National Est/Year 1,037 6,502<br />
Mover Total National Est/Year 27,678 170,627<br />
Column % 100.0% 100.0%<br />
Note. Aggregated data from the 1991-92, 1994-95, <strong>and</strong> 2000-01 <strong>Teacher</strong> Follow-Up Surveys, NCES, USDE.<br />
a The dest<strong>in</strong>ation of movers by teach<strong>in</strong>g field (4 x 2) χ 2 was 4.40 (p > 0.05).<br />
b<br />
Nationally weighted estimates per year (Est/Year) of the total numbers of full-time <strong>and</strong> part-time teachers<br />
comb<strong>in</strong>ed at both the elementary <strong>and</strong> secondary levels <strong>in</strong> the public sector.<br />
c Sample size (n) less than 30.<br />
27