UG-571 - Analog Devices
UG-571 - Analog Devices
UG-571 - Analog Devices

You also want an ePaper? Increase the reach of your titles
YUMPU automatically turns print PDFs into web optimized ePapers that Google loves.
EVAL-ADE7913EBZ User Guide<br />
<strong>UG</strong>-<strong>571</strong><br />
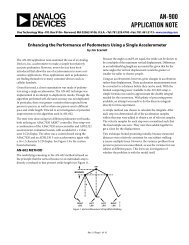
WAVEFORM SAMPLING<br />
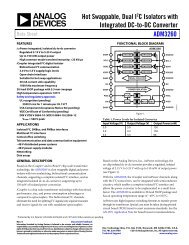
The Waveform Sampling window is shown in Figure 14. It<br />
provides full access to the ADC outputs (waveforms) of the<br />
ADE7913 ADCs that populate the board.<br />
1. Enter an acquisition time (ACCUMULATION TIME)<br />
expressed in milliseconds.<br />
2. Select the ADE7913 ADCs to be analyzed by checking the<br />
A, B, and C boxes. Leave the N box unchecked because the<br />
ADE7913 evaluation board contains only three ADE7913<br />
ADCs.<br />
3. Select START ANALYSIS.<br />
The SDP Blackfin board acquires the waveform samples using<br />
the Phase C ADE7913 DREADY signal as an interrupt. The<br />
green bar under the plot shows the acquisition progress. A box<br />
under the START ANALYSIS button selects which waveform is<br />
visualized in the plot. By default, all the waveforms acquired<br />
from all ADE7913 ADCs selected for analysis are displayed.<br />
• For single waveform visualization, select the desired<br />
waveform under SELECT WAVEFORMS.<br />
• For multiple waveform visualization, select the desired<br />
waveforms under SELECT WAVEFORMS while pressing<br />
the CTRL key.<br />
To write the waveforms into files,<br />
1. Select the folder for file storage (SELECT FOLDER).<br />
2. Select WRITE WAVEFORMS TO FILES.<br />
The program stores every waveform into a file called<br />
Waveform_sample_X.dat, where X is a number between 0<br />
or 8. The order of the waveforms listed in the SELECT<br />
WAVEFORMS box is reflected in the file name identification<br />
number. As the default selects all waveforms to be acquired,<br />
Waveform_sample_0.dat contains Phase A current waveform,<br />
Waveform_sample_1.dat contains Phase A voltage 1 waveform,<br />
Waveform_sample_2.dat contains Phase A voltage 2 waveform,<br />
and so on.<br />
The plot always visualizes 100 ms worth of waveform samples.<br />
If the acquisition time is greater, a scroll bar below the plot<br />
allows the visualization of an additional 100 ms periods.<br />
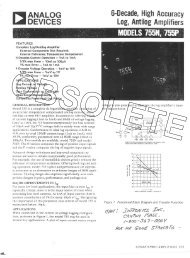
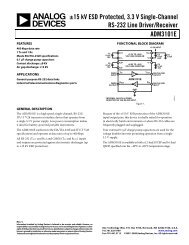
A Fourier analysis of the acquired waveforms may be enabled<br />
by changing the position of the SELECT ANALYSIS switch.<br />
In this case, the window shown in Figure 15 is enabled. Only<br />
one waveform at a time is visualized in the plot.<br />
The type of windowing may be selected: Hanning, Blackman-<br />
Harris, or none.<br />
Various FFT Settings may be selected: 0 dB level reference may<br />
be at the signal peak, the theoretical maximum, or at a manual<br />
entry. When selecting Signal Peak, the plot uses the amplitude<br />
of the maximum peak of the waveform as the 0 dB level and<br />
writes it in the Manual entry box.<br />
Other selection include the Bandwidth under analysis (default<br />
is between 10 Hz and 4000 Hz), the Fundamental Frequency<br />
Rev. 0 | Page 11 of 16<br />
(the default is 50 Hz), the width of the FFT bins, Fund/Harm<br />
Sideband Bins, (the default is 10 Hz), and the Number of<br />
Harmonics used in the ADC specifications visualized under<br />
the plot (default is 6).<br />
When the FFT plot is visualized, the program calculates and<br />
visualizes the following ADC specifications:<br />
• SNR (signal-to-noise ratio)<br />
• THD (total harmonic distortion)<br />
• SNDR (signal-to-noise and distortion ratio)<br />
• SFDR (spurious-free dynamic range)<br />
• Signal (rms of the fundamental component)<br />
• Noise (rms of the noise)<br />
• Harmonics (rms value of all harmonics)<br />
Figure 14. Waveform Sampling<br />
Figure 15. Fourier Analysis<br />
11671-014<br />
11671-015