relation between till geochemistry and the occurrence ... - Arkisto.gsf.fi
relation between till geochemistry and the occurrence ... - Arkisto.gsf.fi
relation between till geochemistry and the occurrence ... - Arkisto.gsf.fi

Create successful ePaper yourself
Turn your PDF publications into a flip-book with our unique Google optimized e-Paper software.
Geological Survey of Finl<strong>and</strong>, Special Paper 9<br />
Pertti Hari, Alf Björklund, Hannu Rita <strong>and</strong> Anneli Ylimartimo<br />
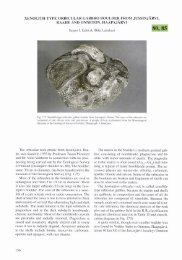
samples are from a depth of 1-2<br />
m, which is well<br />
below <strong>the</strong> sai1 horizon in this area. After drying,<br />
< 0.06 mm fraction was sieved from <strong>the</strong> samples<br />
<strong>and</strong> leached at + 80°C for 1 h in 7N aqua regia.<br />
An extract was analyzed by induction-coupled<br />
plasma atomic emission spectrometry (ICP).<br />
An index was developed based on knowledge of<br />
<strong>the</strong> effects of acid deposition on soil properties <strong>and</strong><br />
tree nutrition . The values of <strong>the</strong> variables describing<br />
<strong>the</strong> concentrations of K, Mg, Ca, Al, Fe, <strong>and</strong><br />
Mn were st<strong>and</strong>ardized. The <strong>fi</strong>rst principal component<br />
coef<strong>fi</strong>cients of <strong>the</strong>se variables were roughly<br />
equal. This supported <strong>the</strong> choice of equal weights<br />
in <strong>the</strong> de<strong>fi</strong>nition of <strong>the</strong> index, which we here call<br />
<strong>the</strong> GEI (Geochemical Environmental Index):<br />
(K + Mg + Ca)-(Al + Fe + Mn). We use this index<br />
to describe <strong>the</strong> geochemical properties of <strong>till</strong>.<br />
Unfortunately, <strong>the</strong>re is no systematic inventory<br />
of <strong>the</strong> area of damage by scleroderris canker in<br />
Finl<strong>and</strong>; <strong>the</strong> available records are sporadic <strong>and</strong><br />
often based on subjective observations. To obtain<br />
a more quantitative picture of <strong>the</strong> frequency of<br />
scleroderris canker an experimental survey was ar-<br />
ranged in July, 1986, in sou<strong>the</strong>rn Finl<strong>and</strong> in <strong>the</strong><br />
above-mentioned 100 kmx 300 km area. The<br />
method was to involve a quick-survey to estimate<br />
<strong>the</strong> disease intensity near by <strong>the</strong> geochemical survey<br />
points. The most severely damaged young pine<br />
st<strong>and</strong> not more than in <strong>the</strong> 0.5 km neighborhood<br />
of each geochemical sampling point was chosen.<br />
In each st<strong>and</strong><strong>the</strong> proportion of all trees having 1)<br />
recovered crowns with one or more changes of a<br />
leading shoot, 2) crowns with recent browning of<br />
shoots, <strong>and</strong> 3) dead crowns was measured. The<br />
sum of <strong>the</strong> values of <strong>the</strong>se three response variables<br />
was <strong>the</strong>n calculated for each st<strong>and</strong> to describe <strong>the</strong><br />
long-term situation of damage <strong>occurrence</strong>. We use<br />
this sum as a disease index.<br />
The 80 pine st<strong>and</strong>s surveyed were ranked according<br />
to <strong>the</strong> value of <strong>the</strong> GEI, <strong>and</strong> 20 st<strong>and</strong>s with<br />
<strong>the</strong> lowest <strong>and</strong> 20 st<strong>and</strong>s with <strong>the</strong> highest GEI<br />
values were chosen for <strong>the</strong> comparison. Owing to<br />
<strong>the</strong> strong skewness of <strong>the</strong> distribution of <strong>the</strong> disease<br />
index <strong>the</strong>se two chosen pine-st<strong>and</strong>-groups<br />
were compared using <strong>the</strong> Mann-Whitney U-test.<br />
RESULTS AND DISCUSSION<br />
It has been normal practice to predict <strong>the</strong> <strong>geochemistry</strong><br />
of glacial overburden on <strong>the</strong> basis of <strong>the</strong><br />
known geology of <strong>the</strong> bedrock. Accordingly,<br />
predictions of <strong>the</strong> acidi<strong>fi</strong>cation sensitivity of soil<br />
in an area have been made on <strong>the</strong> basis of bedrockgeological<br />
maps (Kommitten Miljö 1982, Shilts<br />
1981). Recent geochemical maps over large regions<br />
- e.g. maps of <strong>the</strong> Nordkalott project (Be~lviken<br />
et al. 1986), maps of <strong>the</strong> Geochemical Atlas of Finl<strong>and</strong>,<br />
<strong>and</strong> maps of <strong>the</strong> Geological Survey of Finl<strong>and</strong><br />
- show that <strong>the</strong> areal distribution of <strong>the</strong><br />
aqua-regia extractable contents of most elements<br />
correlates with <strong>the</strong> main bedrock units only to a<br />
limited extent. The reason for <strong>the</strong> disagreement<br />
<strong>and</strong> <strong>the</strong> source of increased contents unrelated to<br />
bedrock geology has not yet been explained. Björklund<br />
(1988a, b), who pointed out this feature, suggests<br />
a <strong>relation</strong> <strong>between</strong> past hydro<strong>the</strong>rmal processes,<br />
with related alteration <strong>and</strong> metal enrichment<br />
in <strong>the</strong> bedrock, <strong>and</strong> an increase in <strong>the</strong> mobile<br />
phases of elements in <strong>the</strong> overlying glacial drift.<br />
He suggests that deep salt groundwater <strong>and</strong><br />
ascending geogas may play an important role in<br />
<strong>the</strong> transport <strong>and</strong> enrichment of <strong>the</strong> mobile phase<br />
of elements in overburden.<br />
The pine st<strong>and</strong>s in <strong>the</strong> lowest quartile of <strong>the</strong> GEI<br />
value had a higher disease index mean than <strong>the</strong><br />
pine st<strong>and</strong>s in <strong>the</strong> highest quartile. We used <strong>the</strong><br />
Mann-Whitney U-procedure to test <strong>the</strong> hypo<strong>the</strong>sis<br />
of equal means <strong>and</strong> were able to reject it with<br />
<strong>the</strong> p-value of 3.15 %. Areas susceptible to<br />
scleroderris canker can thus be predicted using <strong>the</strong><br />
GEI (Figs. 2 <strong>and</strong> 3). Figure 2 shows a color image<br />
of <strong>the</strong> moving median (Björklund & Gustavsson,<br />
1987) for GEI based on <strong>the</strong> data of <strong>the</strong> Geochemical<br />
Atlas of Finl<strong>and</strong>. The color image of <strong>the</strong><br />
moving median of GEI in Fig. 3 is based on <strong>the</strong><br />
denser sampling grid of <strong>the</strong> Geological Survey of<br />
Finl<strong>and</strong>. Because <strong>the</strong>re is no systematic inventory<br />
of <strong>the</strong> area damaged by scleroderris canker in Finl<strong>and</strong><br />
<strong>the</strong> compatibility of <strong>the</strong> damaged area with<br />
<strong>the</strong> prediction in <strong>the</strong> Figs. 2 <strong>and</strong> 3 cannot be tested.<br />
The disease frequency has been recorded very sporadically<br />
<strong>and</strong> <strong>the</strong> records are often based on subjective<br />
observations. A more detailed, long-term<br />
survey of <strong>the</strong> damage by scleroderris canker in Finl<strong>and</strong><br />
is needed.<br />
The results of <strong>the</strong> present study give support to<br />
<strong>the</strong> hypo<strong>the</strong>sis that <strong>till</strong> <strong>geochemistry</strong> <strong>and</strong> <strong>the</strong> <strong>occurrence</strong><br />
of scleroderris canker are related to each