DNA triplex structures in neurodegenerative disorder, Friedreich's ...
DNA triplex structures in neurodegenerative disorder, Friedreich's ...
DNA triplex structures in neurodegenerative disorder, Friedreich's ...

You also want an ePaper? Increase the reach of your titles
YUMPU automatically turns print PDFs into web optimized ePapers that Google loves.
526 Moganty R Rajeswari<br />
at different salt concentration us<strong>in</strong>g the follow<strong>in</strong>g bimolecular<br />
methods equation:<br />
$HðHGÞ ¼ 2nþ ð 1Þ: RT2½da=dTŠTm1 ð1Þ<br />
$HðWCÞ ¼ 2nþ ð 1Þ: RT2½da=dTŠTm2 ð2Þ<br />
Tm1 and Tm2 are the melt<strong>in</strong>g temperatures of <strong>DNA</strong> <strong>triplex</strong><br />
and duplex respectively. α is the fraction of dissociation at a<br />
given temperature, of <strong>triplex</strong> <strong>in</strong> equation 1 and duplex <strong>in</strong><br />
equation 2. While n represents the number of molecular species,<br />
is considered to be 1 for the monomolecular process and<br />
to be 2 for the bimolecular process (Marky and Breslauer<br />
1987). The estimated values of ΔH us<strong>in</strong>g the Tm data were<br />
found to be generally <strong>in</strong> good agreement with the vant Hoff<br />
analysis with<strong>in</strong> 10% error. The ΔH WC corresponds to<br />
Watson–Crick base pair<strong>in</strong>g <strong>in</strong> duplex <strong>DNA</strong> and ΔH HG to<br />
that of Hoogsteen base pair<strong>in</strong>g <strong>in</strong> <strong>triplex</strong>. Obviously, the<br />
<strong>triplex</strong> is thermodynamically less stable than its host duplex.<br />
While the pur<strong>in</strong>e–motif <strong>triplex</strong> shows greater stability, as can<br />
be seen from the table 2, the free energy of <strong>triplex</strong> and<br />
duplex are 7.9 and 16.36 kcal/mol respectively. The enthalpy<br />
changes ΔH for duplex and its complex with drug at different<br />
ratios of D/N (‘D’ and ‘N’ represent the concentration<br />
of drug and duplex, respectively) were evaluated by the<br />
shape analysis of the UV melt<strong>in</strong>g curves by us<strong>in</strong>g the<br />
equation 1.<br />
Circular dichroic spectra also reveal changes <strong>in</strong> the <strong>triplex</strong><br />
and duplex. The calculated CD spectrum of the <strong>triplex</strong><br />
(weighted sum total of 23 RY and 15R) is significantly<br />
different from that of the experimentally measured <strong>triplex</strong>.<br />
Further, the spectrum of 23RY duplex corresponds to the<br />
usual B-<strong>DNA</strong> and has the characteristic broad positive band<br />
at ~279 nm and negative band at 245 nm (figure 6A).The<br />
mathematical addition of 23RY with 15R showed a spectrum<br />
similar to the duplex 23RY with positive maxima at 279 nm<br />
and 220 nm and m<strong>in</strong>imum at 248 nm. However, an experimentally<br />
generated CD spectrum on addition of 15R to the<br />
23RY duplex showed strong changes; the positive band at<br />
220 nm had disappeared while an <strong>in</strong>tense negative band<br />
appeared at 210 nm. The negative band ~210 nm is characteristic<br />
of the <strong>triplex</strong> and generally considered as a ‘hall<br />
mark’ for <strong>triplex</strong> formation <strong>in</strong> oligonucleotides conta<strong>in</strong><strong>in</strong>g<br />
GA or GT or CT repeats (Roberts and Crothers 1992;<br />
Kandimalla et al. 1996; Heet al. 1997; Ja<strong>in</strong> et al. 2002).<br />
2-D electrophoresis has proved to be the method of choice<br />
for thermodynamic description of <strong>triplex</strong> formation <strong>in</strong> ‘<strong>in</strong>tramolecular’<br />
<strong>triplex</strong>es, while gel retardation assay can be performed<br />
us<strong>in</strong>g [γ-32P]-labelled <strong>DNA</strong>. Triplexes exhibit much<br />
slower electrophoretic mobility than their correspond<strong>in</strong>g<br />
duplexes due to the larger mass. Figure 6B shows the autoradiogram<br />
of the gel retardation assay (GRA) of 50 nM<br />
duplex, 23RY (lane 1) (with hot 23Y) and mixtures of<br />
duplex 23RYand 15R <strong>in</strong> different mole ratios 2:1 (lane 2);<br />
1:1 (lane 3) and 1:2 (lane 4).<br />
7. Friedreich’s ataxia<br />
7.1 Cl<strong>in</strong>ical aspects<br />
Freidreich’s ataxia (FRDA) (Romeo et al. 1983), named<br />
after the German doctor Nikolaus Friedreich, who first described<br />
the disease <strong>in</strong> 1863, is an autosomal recessive disease,<br />
caused by mutations <strong>in</strong> the FRDA gene, located on<br />
chromosome 9 (Campuzano et al. 1996). It is the most<br />
common <strong>in</strong>herited ataxia although the <strong>in</strong>cidence is low.<br />
The <strong>neurodegenerative</strong> <strong>disorder</strong>, affect<strong>in</strong>g both males and<br />
females, usually manifests before adolescence and is generally<br />
characterized by progressive gait ataxia and ataxia of all<br />
four limbs, hypertrophic cardiomyopathy and <strong>in</strong>creased <strong>in</strong>cidence<br />
of diabetes mellitus/impaired glucose tolerance.<br />
There is a progressive loss of voluntary muscular coord<strong>in</strong>ation<br />
and most of the patients are wheelchair bound by their<br />
late twenties, with myocardial failure be<strong>in</strong>g the most common<br />
cause of the death.<br />
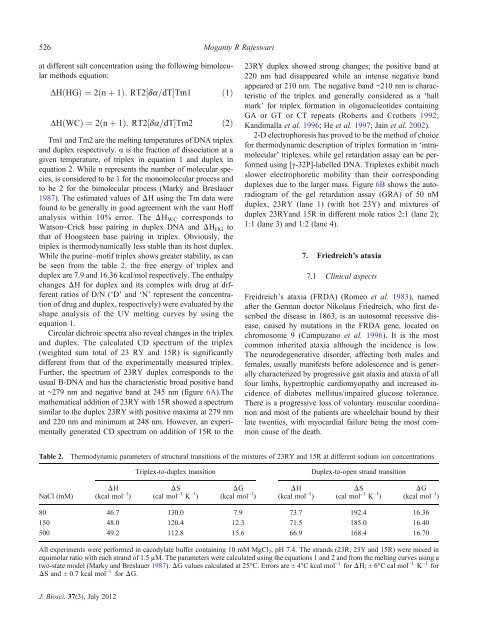
Table 2.<br />
Thermodynamic parameters of structural transitions of the mixtures of 23RY and 15R at different sodium ion concentrations<br />
Triplex-to-duplex transition<br />
Duplex-to-open strand transition<br />
NaCl (mM)<br />
ΔH ΔS ΔG ΔH ΔS ΔG<br />
(kcal mol –1 ) (cal mol –1 K –1 ) (kcal mol –1 ) (kcal mol –1 ) (cal mol –1 K –1 ) (kcal mol –1 )<br />
80 46.7 130.0 7.9 73.7 192.4 16.36<br />
150 48.0 120.4 12.3 71.5 185.0 16.40<br />
500 49.2 112.8 15.6 66.9 168.4 16.70<br />
All experiments were performed <strong>in</strong> cacodylate buffer conta<strong>in</strong><strong>in</strong>g 10 mM MgCl 2 , pH 7.4. The strands (23R, 23Y and 15R) were mixed <strong>in</strong><br />
equimolar ratio with each strand of 1.5 μM. The parameters were calculated us<strong>in</strong>g the equations 1 and 2 and from the melt<strong>in</strong>g curves us<strong>in</strong>g a<br />
two-state model (Marky and Breslauer 1987). ΔG values calculated at 25°C. Errors are ± 4°C kcal mol –1 for ΔH; ± 6°C cal mol –1 K –1 for<br />
ΔS and ± 0.7 kcal mol –1 for ΔG.<br />
J. Biosci. 37(3), July 2012