Photon-Induced Near Field Electron Microscopy - California Institute ...
Photon-Induced Near Field Electron Microscopy - California Institute ...
Photon-Induced Near Field Electron Microscopy - California Institute ...

You also want an ePaper? Increase the reach of your titles
YUMPU automatically turns print PDFs into web optimized ePapers that Google loves.
Q x<br />
8<br />
6<br />
4<br />
2<br />
0<br />
0E+0<br />
x<br />
2E+4<br />
y<br />
cap<br />
4E+4<br />
center<br />
6E+4<br />
side<br />
8E+4<br />
0 1 2 3 4 5<br />
photon energy (eV)<br />
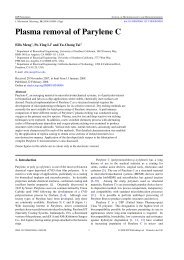
Figure 7. Optical and electric excitation efficiencies of a silver nanorod.<br />
|E| 2 Re[E Im[F 0 ] |F 0 | 2<br />
// ]<br />
Q x<br />
x<br />
y<br />
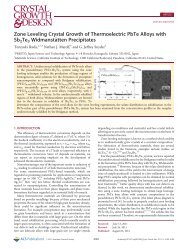
Figure 8. Scattered electric fields ( E), ⃗ field integral ( ˜F 0), and transition probabilities ( ˛ ˜F 0˛˛˛2<br />
) for a silver nanorod at ŷ and<br />
ˆx polarized 519 nm excitations. Note that electric fields were Gaussian-filtered (σ = 1 pixel) to reduce DDA artifact.<br />
∣<br />
with much stronger intensities in the middle. Furthermore, ∣Ẽ ∣ is dominated by Ẽx at ends, but by Ẽy in<br />
∣<br />
the middle, which results in different numbers of nodes between ∣Ẽ ∣ 2 ]<br />
and Re<br />
[Ẽx , and the PINEM image is<br />
correlated to ∣E<br />
⃗ ∣ 2 .<br />
Figs. 9 and 10 show scattering intensities and PINEM images at various resonance energies, respectively.<br />
Good correlations between scattering intensities and PINEM images are readily seen. Perpendicular excitations<br />
all show PINEM images similar to that at 519 nm, which is a dipole excitation in a cylinder. Parallel excitations<br />
show a strong wavelength dependence. In particular, 400 nm shows (linear) hexapole (l = 5) behavior, and the<br />
PINEM image shows six maxima along the rod axis. 342 nm corresponds to 3.6 eV peak in Fig. 7, which shows a<br />
strong excitation for perpendicular polarization and almost no excitation for parallel polarization. Consequently,<br />
the PINEM image for 342 nm parallel polarization shows non-resonant behavior, namely a weak dipole excitation.<br />
489 nm 400 nm<br />
342 nm 250 nm<br />
x<br />
y<br />
Figure 9. Scattering intensities of a silver nanorod at 489, 400, 342, and 250 nm. Note that electric fields were Gaussianfiltered<br />
(σ = 1 pixel) to reduce DDA artifact.<br />
489 nm 400 nm<br />
342 nm 250 nm<br />
x<br />
y<br />
Figure 10. Transition probabilities of a silver nanorod at 489, 400, 342, and 250 nm.<br />
Proc. of SPIE Vol. 8845 884506-7