- Page 1 and 2:
Growth and Change Dynamics in Open
- Page 3 and 4:
Dedicated to all my teachers ii
- Page 5 and 6:
Declaration I declare that this the
- Page 7 and 8:
7. R. Vasa, M. Lumpe, P. Branch, an
- Page 9 and 10:
Contents 3.4 Selection Criteria . .
- Page 11 and 12:
Contents 5.4.5 Identifying Change u
- Page 13 and 14:
Contents 7.2.2 Software Metric Tool
- Page 15 and 16:
List of Figures 4.7 Class diagram s
- Page 17 and 18:
List of Figures 6.9 Probability of
- Page 19 and 20:
List of Tables 5.2 Spearman’s Ran
- Page 21 and 22:
Chapter 1. Introduction in the laws
- Page 23 and 24:
Chapter 1. Introduction models that
- Page 25 and 26:
Chapter 1. Introduction compute at
- Page 27 and 28:
Chapter 1. Introduction undergo con
- Page 29 and 30:
Chapter 2 Software Evolution How do
- Page 31 and 32:
Chapter 2. Software Evolution Proce
- Page 33 and 34:
Chapter 2. Software Evolution Softw
- Page 35 and 36:
Chapter 2. Software Evolution devel
- Page 37 and 38:
Chapter 2. Software Evolution [59,
- Page 39 and 40:
Chapter 2. Software Evolution These
- Page 41 and 42:
Chapter 2. Software Evolution and C
- Page 43 and 44:
Chapter 2. Software Evolution Tursk
- Page 45 and 46:
Chapter 2. Software Evolution nenti
- Page 47 and 48:
Chapter 2. Software Evolution The o
- Page 49 and 50:
Chapter 2. Software Evolution used
- Page 51 and 52:
Chapter 2. Software Evolution durin
- Page 53 and 54:
Chapter 2. Software Evolution added
- Page 55 and 56:
Chapter 2. Software Evolution that
- Page 57 and 58:
Chapter 2. Software Evolution the c
- Page 59 and 60:
Chapter 2. Software Evolution The q
- Page 61 and 62:
Chapter 3. Data Selection Methodolo
- Page 63 and 64: Chapter 3. Data Selection Methodolo
- Page 65 and 66: Chapter 3. Data Selection Methodolo
- Page 67 and 68: Chapter 3. Data Selection Methodolo
- Page 69 and 70: Chapter 3. Data Selection Methodolo
- Page 71 and 72: Chapter 3. Data Selection Methodolo
- Page 73 and 74: Chapter 3. Data Selection Methodolo
- Page 75 and 76: Chapter 3. Data Selection Methodolo
- Page 77 and 78: Chapter 3. Data Selection Methodolo
- Page 79 and 80: Chapter 4 Measuring Evolving Softwa
- Page 81 and 82: Chapter 4. Measuring Evolving Softw
- Page 83 and 84: Chapter 4. Measuring Evolving Softw
- Page 85 and 86: Chapter 4. Measuring Evolving Softw
- Page 87 and 88: Chapter 4. Measuring Evolving Softw
- Page 89 and 90: Chapter 4. Measuring Evolving Softw
- Page 91 and 92: Chapter 4. Measuring Evolving Softw
- Page 93 and 94: Chapter 4. Measuring Evolving Softw
- Page 95 and 96: Chapter 4. Measuring Evolving Softw
- Page 97 and 98: Chapter 4. Measuring Evolving Softw
- Page 99 and 100: Chapter 4. Measuring Evolving Softw
- Page 101 and 102: Chapter 4. Measuring Evolving Softw
- Page 103 and 104: Chapter 4. Measuring Evolving Softw
- Page 105 and 106: Chapter 4. Measuring Evolving Softw
- Page 107 and 108: Chapter 4. Measuring Evolving Softw
- Page 109 and 110: Chapter 5 Growth Dynamics Current m
- Page 111 and 112: Chapter 5. Growth Dynamics used to
- Page 113: Chapter 5. Growth Dynamics mean, me
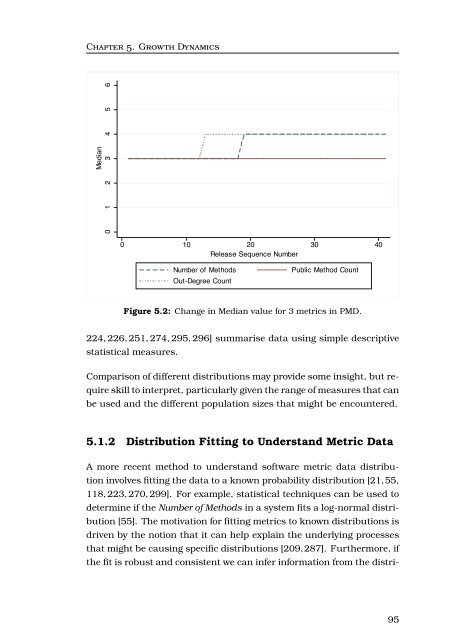
- Page 117 and 118: Chapter 5. Growth Dynamics Though,
- Page 119 and 120: Chapter 5. Growth Dynamics Figure 5
- Page 121 and 122: Chapter 5. Growth Dynamics 5.2.4 Ap
- Page 123 and 124: Chapter 5. Growth Dynamics measure
- Page 125 and 126: Chapter 5. Growth Dynamics 5.3.1) [
- Page 127 and 128: Chapter 5. Growth Dynamics Figure 5
- Page 129 and 130: Chapter 5. Growth Dynamics • The
- Page 131 and 132: Chapter 5. Growth Dynamics 50.0% 45
- Page 133 and 134: Chapter 5. Growth Dynamics Metric M
- Page 135 and 136: Chapter 5. Growth Dynamics Figure 5
- Page 137 and 138: Chapter 5. Growth Dynamics ber of M
- Page 139 and 140: Chapter 5. Growth Dynamics Spearman
- Page 141 and 142: Chapter 5. Growth Dynamics Spearman
- Page 143 and 144: Chapter 5. Growth Dynamics as exist
- Page 145 and 146: Chapter 5. Growth Dynamics sented i
- Page 147 and 148: Chapter 5. Growth Dynamics System M
- Page 149 and 150: Chapter 5. Growth Dynamics populati
- Page 151 and 152: Chapter 5. Growth Dynamics abstract
- Page 153 and 154: Chapter 5. Growth Dynamics Figure 5
- Page 155 and 156: Chapter 5. Growth Dynamics Another
- Page 157 and 158: Chapter 6 Change Dynamics It is a w
- Page 159 and 160: Chapter 6. Change Dynamics 6.1 Dete
- Page 161 and 162: Chapter 6. Change Dynamics often ma
- Page 163 and 164: Chapter 6. Change Dynamics The set
- Page 165 and 166:
Chapter 6. Change Dynamics analysis
- Page 167 and 168:
10 12 14 16 18 20 22 24 26 28 30 32
- Page 169 and 170:
Chapter 6. Change Dynamics Age (Day
- Page 171 and 172:
Chapter 6. Change Dynamics erties h
- Page 173 and 174:
Chapter 6. Change Dynamics 100% 90%
- Page 175 and 176:
Chapter 6. Change Dynamics the meas
- Page 177 and 178:
Chapter 6. Change Dynamics 50.0% 45
- Page 179 and 180:
Chapter 6. Change Dynamics Figure 6
- Page 181 and 182:
Chapter 6. Change Dynamics new clas
- Page 183 and 184:
Chapter 6. Change Dynamics We obser
- Page 185 and 186:
Chapter 6. Change Dynamics the chan
- Page 187 and 188:
Chapter 6. Change Dynamics other en
- Page 189 and 190:
Chapter 6. Change Dynamics 6.3.4 Po
- Page 191 and 192:
Chapter 6. Change Dynamics stance,
- Page 193 and 194:
Chapter 6. Change Dynamics ing a lo
- Page 195 and 196:
Chapter 6. Change Dynamics Lanza et
- Page 197 and 198:
Chapter 6. Change Dynamics smells t
- Page 199 and 200:
Chapter 6. Change Dynamics growth i
- Page 201 and 202:
Chapter 7. Implications ically, we
- Page 203 and 204:
Chapter 7. Implications overall str
- Page 205 and 206:
Chapter 7. Implications contain new
- Page 207 and 208:
Chapter 7. Implications ciently bro
- Page 209 and 210:
Chapter 7. Implications tional supp
- Page 211 and 212:
Chapter 7. Implications where a sof
- Page 213 and 214:
Chapter 8. Conclusions • We prese
- Page 215:
Chapter 8. Conclusions [302], and g
- Page 218 and 219:
Appendix A Meta Data Collected for
- Page 220 and 221:
Appendix C Mapping between Metrics
- Page 222 and 223:
Chapter D. Metric Extraction Illust
- Page 224 and 225:
Appendix F Change Dynamics Data Fil
- Page 226 and 227:
References [1] S. Alam and P. Duger
- Page 228 and 229:
References Software. In Proceedings
- Page 230 and 231:
References [43] N. Chapin, J. Hale,
- Page 232 and 233:
References [68] M. Di Penta, L. Cer
- Page 234 and 235:
References [91] C. Gini. Measuremen
- Page 236 and 237:
References [115] I. Held. The Scien
- Page 238 and 239:
References [140] H. Kagdi, S. Yusuf
- Page 240 and 241:
References [164] M. Lanza, H. Gall,
- Page 242 and 243:
References [190] T. J. McCabe. A Co
- Page 244 and 245:
References [214] H. Olague, L. Etzk
- Page 246 and 247:
References [242] C. Roy, J. Cordy,
- Page 248 and 249:
References [266] G. Succi, W. Pedry
- Page 250 and 251:
References ECOOP Workshop on Quanti
- Page 252:
References [315] T. Zimmermann, V.


