

CIAB Market & Policy developments 2005/06 - IEA
CIAB Market & Policy developments 2005/06 - IEA
CIAB Market & Policy developments 2005/06 - IEA

You also want an ePaper? Increase the reach of your titles
YUMPU automatically turns print PDFs into web optimized ePapers that Google loves.
The main reason for the electricity sector increase has been the 1320MW Isken-Sugözü<br />
power station which started operating in 2004 and uses imported coal.<br />
3.2.2 Steam Coal Consumption<br />
98. World consumption of steam coal increased by over 8% (350 million tonnes) in 20<strong>06</strong><br />
according to <strong>IEA</strong> provisional estimates, a further significant increase on the 5.1%<br />
increase seen in <strong>2005</strong> 4 . World steam coal consumption has increased by 40% since the<br />
year 2000. Recent growth has been driven by continued steam coal use in developed<br />
economies as well as very rapid growth in developing economies including China (17%,<br />
building on <strong>2005</strong> growth of 9%) and India (8%, building on <strong>2005</strong> growth of 5%). Growth<br />
in non-OECD countries in 20<strong>06</strong> was over 13%.<br />
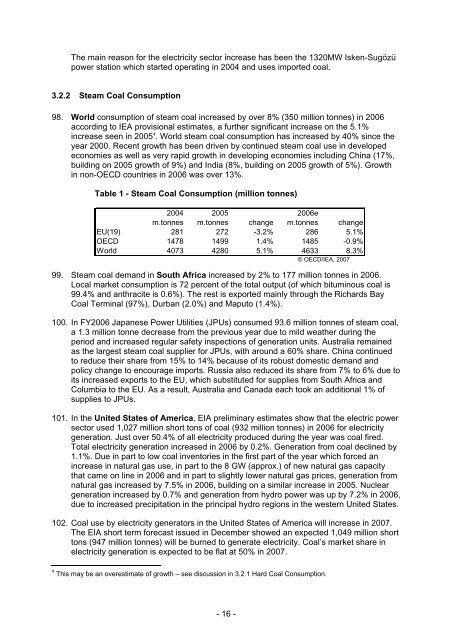
Table 1 - Steam Coal Consumption (million tonnes)<br />
2004 <strong>2005</strong> 20<strong>06</strong>e<br />
m.tonnes m.tonnes change m.tonnes change<br />
EU(19) 281 272 -3.2% 286 5.1%<br />
OECD 1478 1499 1.4% 1485 -0.9%<br />
World 4073 4280 5.1% 4633 8.3%<br />
© OECD/<strong>IEA</strong>, 2007<br />
99. Steam coal demand in South Africa increased by 2% to 177 million tonnes in 20<strong>06</strong>.<br />
Local market consumption is 72 percent of the total output (of which bituminous coal is<br />
99.4% and anthracite is 0.6%). The rest is exported mainly through the Richards Bay<br />
Coal Terminal (97%), Durban (2.0%) and Maputo (1.4%).<br />
100. In FY20<strong>06</strong> Japanese Power Utilities (JPUs) consumed 93.6 million tonnes of steam coal,<br />
a 1.3 million tonne decrease from the previous year due to mild weather during the<br />
period and increased regular safety inspections of generation units. Australia remained<br />
as the largest steam coal supplier for JPUs, with around a 60% share. China continued<br />
to reduce their share from 15% to 14% because of its robust domestic demand and<br />
policy change to encourage imports. Russia also reduced its share from 7% to 6% due to<br />
its increased exports to the EU, which substituted for supplies from South Africa and<br />
Columbia to the EU. As a result, Australia and Canada each took an additional 1% of<br />
supplies to JPUs.<br />
101. In the United States of America, EIA preliminary estimates show that the electric power<br />
sector used 1,027 million short tons of coal (932 million tonnes) in 20<strong>06</strong> for electricity<br />
generation. Just over 50.4% of all electricity produced during the year was coal fired.<br />
Total electricity generation increased in 20<strong>06</strong> by 0.2%. Generation from coal declined by<br />
1.1%. Due in part to low coal inventories in the first part of the year which forced an<br />
increase in natural gas use, in part to the 8 GW (approx.) of new natural gas capacity<br />
that came on line in 20<strong>06</strong> and in part to slightly lower natural gas prices, generation from<br />
natural gas increased by 7.5% in 20<strong>06</strong>, building on a similar increase in <strong>2005</strong>. Nuclear<br />
generation increased by 0.7% and generation from hydro power was up by 7.2% in 20<strong>06</strong>,<br />
due to increased precipitation in the principal hydro regions in the western United States.<br />
102. Coal use by electricity generators in the United States of America will increase in 2007.<br />
The EIA short term forecast issued in December showed an expected 1,049 million short<br />
tons (947 million tonnes) will be burned to generate electricity. Coal’s market share in<br />
electricity generation is expected to be flat at 50% in 2007.<br />
4 This may be an overestimate of growth – see discussion in 3.2.1 Hard Coal Consumption.<br />
- 16 -


