

CIAB Market & Policy developments 2005/06 - IEA
CIAB Market & Policy developments 2005/06 - IEA
CIAB Market & Policy developments 2005/06 - IEA

Create successful ePaper yourself
Turn your PDF publications into a flip-book with our unique Google optimized e-Paper software.
112. The current low cost of CO 2 emissions permits has had limited impact on the running<br />
regime for gas and coal generation in the UK. Phase 2 of the EU Emissions Trading<br />
Scheme has seen a tightening of National Allocation Plan limits across the EU, leading<br />
to higher market prices for CO 2 . This may deteriorate coal’s position, although the<br />
seasonality of gas prices will remain an influence on the relative cost of coal and gas<br />
generation.<br />
3.2.3 Coking Coal Consumption<br />
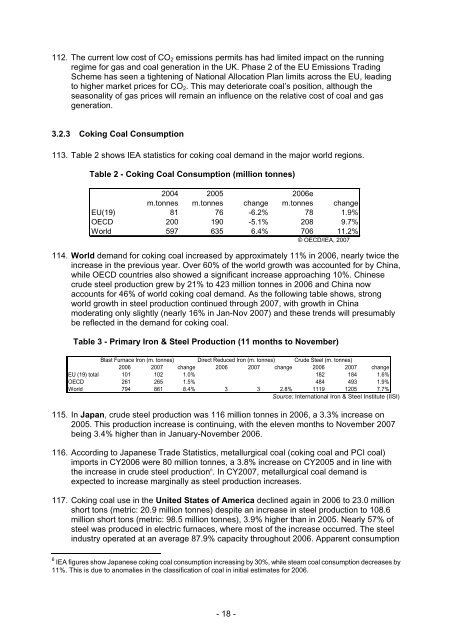
113. Table 2 shows <strong>IEA</strong> statistics for coking coal demand in the major world regions.<br />
Table 2 - Coking Coal Consumption (million tonnes)<br />
2004 <strong>2005</strong> 20<strong>06</strong>e<br />
m.tonnes m.tonnes change m.tonnes change<br />
EU(19) 81 76 -6.2% 78 1.9%<br />
OECD 200 190 -5.1% 208 9.7%<br />
World 597 635 6.4% 7<strong>06</strong> 11.2%<br />
© OECD/<strong>IEA</strong>, 2007<br />
114. World demand for coking coal increased by approximately 11% in 20<strong>06</strong>, nearly twice the<br />
increase in the previous year. Over 60% of the world growth was accounted for by China,<br />
while OECD countries also showed a significant increase approaching 10%. Chinese<br />
crude steel production grew by 21% to 423 million tonnes in 20<strong>06</strong> and China now<br />
accounts for 46% of world coking coal demand. As the following table shows, strong<br />
world growth in steel production continued through 2007, with growth in China<br />
moderating only slightly (nearly 16% in Jan-Nov 2007) and these trends will presumably<br />
be reflected in the demand for coking coal.<br />
Table 3 - Primary Iron & Steel Production (11 months to November)<br />
Blast Furnace Iron (m. tonnes) Direct Reduced Iron (m. tonnes) Crude Steel (m. tonnes)<br />
20<strong>06</strong> 2007 change 20<strong>06</strong> 2007 change 20<strong>06</strong> 2007 change<br />
EU (19) total 101 102 1.0% 182 184 1.6%<br />
OECD 261 265 1.5% 484 493 1.9%<br />
World 794 861 8.4% 3 3 2.8% 1119 1205 7.7%<br />
Source: International Iron & Steel Institute (IISI)<br />
115. In Japan, crude steel production was 116 million tonnes in 20<strong>06</strong>, a 3.3% increase on<br />
<strong>2005</strong>. This production increase is continuing, with the eleven months to November 2007<br />
being 3.4% higher than in January-November 20<strong>06</strong>.<br />
116. According to Japanese Trade Statistics, metallurgical coal (coking coal and PCI coal)<br />
imports in CY20<strong>06</strong> were 80 million tonnes, a 3.8% increase on CY<strong>2005</strong> and in line with<br />
the increase in crude steel production 6 . In CY2007, metallurgical coal demand is<br />
expected to increase marginally as steel production increases.<br />
117. Coking coal use in the United States of America declined again in 20<strong>06</strong> to 23.0 million<br />
short tons (metric: 20.9 million tonnes) despite an increase in steel production to 108.6<br />
million short tons (metric: 98.5 million tonnes), 3.9% higher than in <strong>2005</strong>. Nearly 57% of<br />
steel was produced in electric furnaces, where most of the increase occurred. The steel<br />
industry operated at an average 87.9% capacity throughout 20<strong>06</strong>. Apparent consumption<br />
6 <strong>IEA</strong> figures show Japanese coking coal consumption increasing by 30%, while steam coal consumption decreases by<br />
11%. This is due to anomalies in the classification of coal in initial estimates for 20<strong>06</strong>.<br />
- 18 -


