INDIA INFOLINE FINANCE LIMITED - Securities and Exchange ...
INDIA INFOLINE FINANCE LIMITED - Securities and Exchange ...
INDIA INFOLINE FINANCE LIMITED - Securities and Exchange ...
Create successful ePaper yourself
Turn your PDF publications into a flip-book with our unique Google optimized e-Paper software.
India Infoline Finance Limited<br />
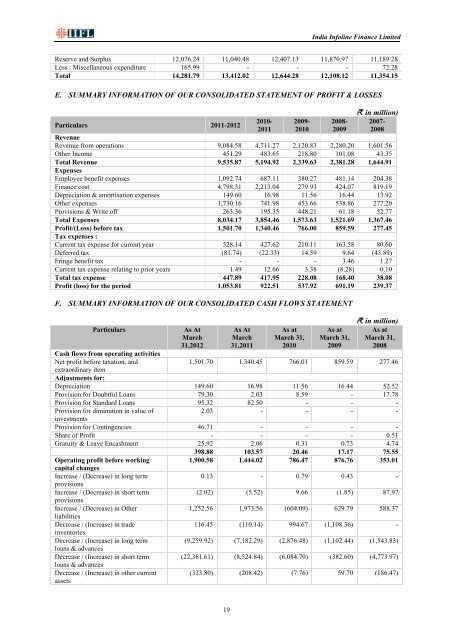
Reserve <strong>and</strong> Surplus 12,076.24 11,040.48 12,407.13 11,870.97 11,189.28<br />
Less : Miscellaneous expenditure 165.99 - - - 72.28<br />
Total 14,281.79 13,412.02 12,644.28 12,108.12 11,354.15<br />
E. SUMMARY INFORMATION OF OUR CONSOLIDATED STATEMENT OF PROFIT & LOSSES<br />
Particulars 2011-2012<br />
2010-<br />
2011<br />
2009-<br />
2010<br />
2008-<br />
2009<br />
(` in million)<br />
2007-<br />
2008<br />
Revenue<br />
Revenue from operations 9,084.58 4,711.27 2,120.83 2,280.20 1,601.56<br />
Other Income 451.29 483.65 218.80 101.08 43.35<br />
Total Revenue 9,535.87 5,194.92 2,339.63 2,381.28 1,644.91<br />
Expenses<br />
Employee benefit expenses 1,092.74 687.11 380.27 481.14 204.38<br />
Finance cost 4,798.31 2,213.04 279.93 424.07 819.19<br />
Depreciation & amortisation expenses 149.60 16.98 11.56 16.44 13.92<br />
Other expenses 1,730.16 741.98 453.66 538.86 277.20<br />
Provisions & Write off 263.36 195.35 448.21 61.18 52.77<br />
Total Expenses 8,034.17 3,854.46 1,573.63 1,521.69 1,367.46<br />
Profit/(Loss) before tax 1,501.70 1,340.46 766.00 859.59 277.45<br />
Tax expenses :<br />
Current tax expense for current year 528.14 427.62 210.11 163.58 80.60<br />
Deferred tax (81.74) (22.33) 14.59 9.64 (43.89)<br />
Fringe benefit tax - - - 3.46 1.27<br />
Current tax expense relating to prior years 1.49 12.66 3.38 (8.28) 0.10<br />
Total tax expense 447.89 417.95 228.08 168.40 38.08<br />
Profit (loss) for the period 1,053.81 922.51 537.92 691.19 239.37<br />
F. SUMMARY INFORMATION OF OUR CONSOLIDATED CASH FLOWS STATEMENT<br />
Particulars<br />
Cash flows from operating activities<br />
Net profit before taxation, <strong>and</strong><br />
extraordinary item<br />
As At<br />
March<br />
31,2012<br />
As At<br />
March<br />
31,2011<br />
As at<br />
March 31,<br />
2010<br />
As at<br />
March 31,<br />
2009<br />
(` in million)<br />
As at<br />
March 31,<br />
2008<br />
1,501.70 1,340.45 766.01 859.59 277.46<br />
Adjustments for:<br />
Depreciation 149.60 16.98 11.56 16.44 52.52<br />
Provision for Doubtful Loans 79.30 2.03 8.59 - 17.78<br />
Provision for St<strong>and</strong>ard Loans 95.32 82.50 - - -<br />
Provision for diminution in value of<br />
2.03 - - - -<br />
investments<br />
Provision for Contingencies 46.71 - - - -<br />
Share of Profit - - - - 0.51<br />
Gratuity & Leave Encashment 25.92 2.06 0.31 0.73 4.74<br />
398.88 103.57 20.46 17.17 75.55<br />
Operating profit before working<br />
capital changes<br />
Increase / (Decrease) in long term<br />
provisions<br />
Increase / (Decrease) in short term<br />
provisions<br />
Increase / (Decrease) in Other<br />
liabilities<br />
Decrease / (Increase) in trade<br />
inventories<br />
Decrease / (Increase) in long term<br />
loans & advances<br />
Decrease / (Increase) in short term<br />
loans & advances<br />
Decrease / (Increase) in other current<br />
assets<br />
1,900.58 1,444.02 786.47 876.76 353.01<br />
0.13 - 0.79 0.43 -<br />
(2.02) (5.52) 9.66 (1.85) 87.97<br />
1,252.56 1,973.56 (604.09) 629.79 588.37<br />
116.45 (110.14) 994.67 (1,108.36) -<br />
(9,259.92) (7,182.29) (2,876.48) (1,102.44) (1,543.83)<br />
(22,361.61) (8,524.84) (6,084.70) (382.60) (4,773.97)<br />
(323.80) (208.42) (7.76) 59.70 (186.47)<br />
19


